| Param | Original file | Final file |
|---|---|---|
| Filename | modeM0/AS1A14_127T10_9000006542_55852cztM0_level2.fits | modeM0/AS1A14_127T10_9000006542_55852cztM0_level2_quad_clean.evt |
| Size (bytes) | 430,752,960 | 97,983,360 |
| Size | 410.8 MB | 93.4 MB |
| Events in quadrant A | 4,235,155 | 632,315 |
| Events in quadrant B | 3,078,379 | 696,725 |
| Events in quadrant C | 3,711,098 | 607,455 |
| Events in quadrant D | 4,403,243 | 566,612 |
| Mode M0 | |||
|---|---|---|---|
| Quadrant | BADHDUFLAG | Total packets | Discarded packets |
| A | 0 | 17048 | 2 |
| B | 0 | 14185 | 2 |
| C | 0 | 16011 | 2 |
| D | 0 | 17829 | 2 |
| Mode M9 | |||
|---|---|---|---|
| Quadrant | BADHDUFLAG | Total packets | Discarded packets |
| A | 0 | 21 | 0 |
| B | 0 | 22 | 0 |
| C | 0 | 22 | 0 |
| D | 0 | 22 | 0 |
| Mode SS | |||
|---|---|---|---|
| Quadrant | BADHDUFLAG | Total packets | Discarded packets |
| A | 0 | 138 | 0 |
| B | 0 | 138 | 0 |
| C | 0 | 138 | 0 |
| D | 0 | 138 | 0 |
| Quadrant | Total seconds | Saturated seconds | Saturation percentage |
|---|---|---|---|
| A | 6651 | 182 | 2.736431% |
| B | 6651 | 62 | 0.932191% |
| C | 6651 | 223 | 3.352879% |
| D | 6651 | 287 | 4.315141% |
Noise dominated data is calculated using 1-second bins in cleaned event files. If a bin has >2000 counts, and if more than 50% of those come from <1% of pixels, then it is considered to be noise-dominated and hence unusable.
| Quadrant | # 1 sec bins | Bins with >0 counts | Bins with >2000 counts | High rate bins dominated by noise | Noise dominated (total time) | Noise dominated (detector-on time) | Marked lightcurve |
|---|---|---|---|---|---|---|---|
| A | 7826 | 6652 | 174 | 174 | 2.22% | 2.62% | 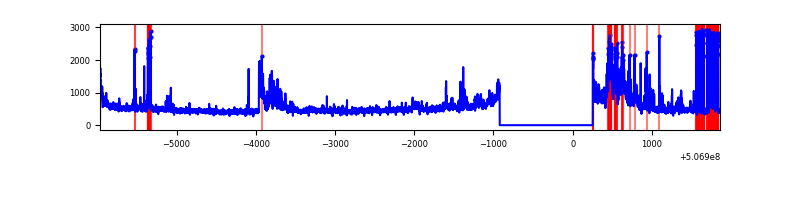 |
| B | 7826 | 6652 | 20 | 20 | 0.26% | 0.30% | 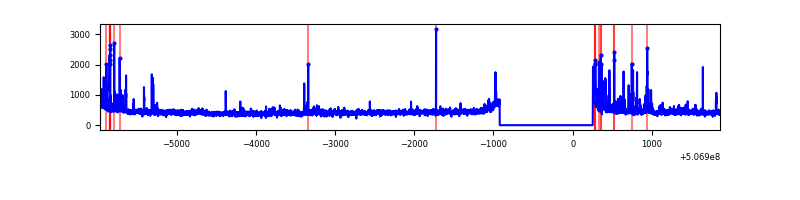 |
| C | 7826 | 6652 | 232 | 232 | 2.96% | 3.49% | 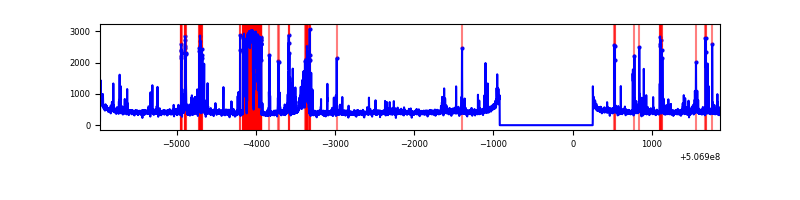 |
| D | 7826 | 6651 | 312 | 312 | 3.99% | 4.69% | 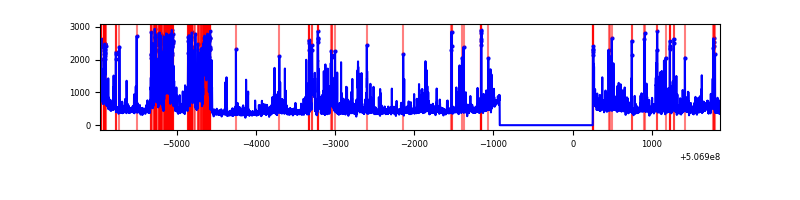 |
Top three noisy pixels from each quadrant. If the there are fewer than three noisy pixels in the level2.evt file, extra rows are filled as -1
| Pixel properties | Quadrant properties | ||||||
|---|---|---|---|---|---|---|---|
| Quadrant | DetID | PixID | Counts | Sigma | Mean | Median | Sigma |
| A | 12 | 115 | 993750 | 5727.21 | 692 | 674 | 173.4 |
| A | 8 | 192 | 225286 | 1295.37 | 692 | 674 | 173.4 |
| A | 4 | 3 | 101858 | 583.54 | 692 | 674 | 173.4 |
| B | 5 | 185 | 168622 | 1115.69 | 696 | 670 | 150.5 |
| B | 10 | 247 | 43096 | 281.83 | 696 | 670 | 150.5 |
| B | 0 | 197 | 27759 | 179.95 | 696 | 670 | 150.5 |
| C | 1 | 246 | 558449 | 3001.61 | 680 | 673 | 185.8 |
| C | 6 | 223 | 205893 | 1104.37 | 680 | 673 | 185.8 |
| C | 13 | 3 | 159447 | 854.42 | 680 | 673 | 185.8 |
| D | 11 | 129 | 899361 | 4697.53 | 673 | 642 | 191.3 |
| D | 7 | 96 | 203097 | 1058.22 | 673 | 642 | 191.3 |
| D | 2 | 62 | 187682 | 977.64 | 673 | 642 | 191.3 |
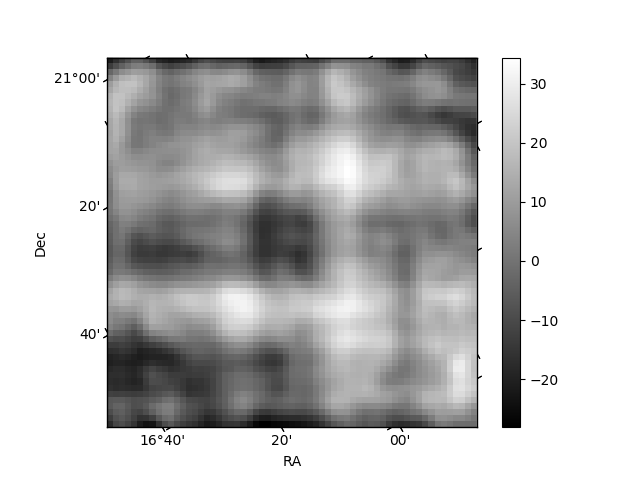
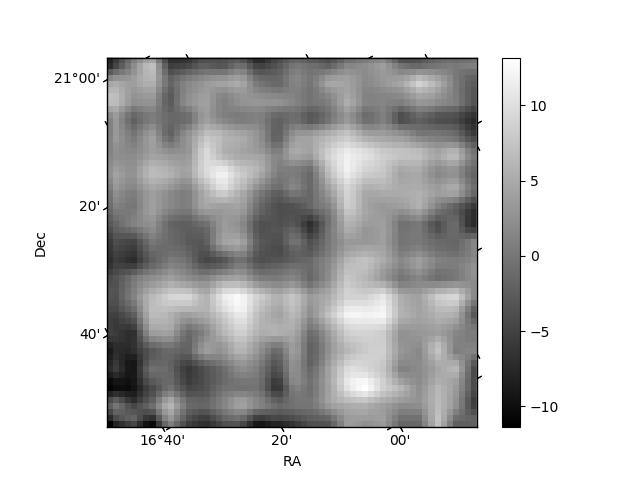
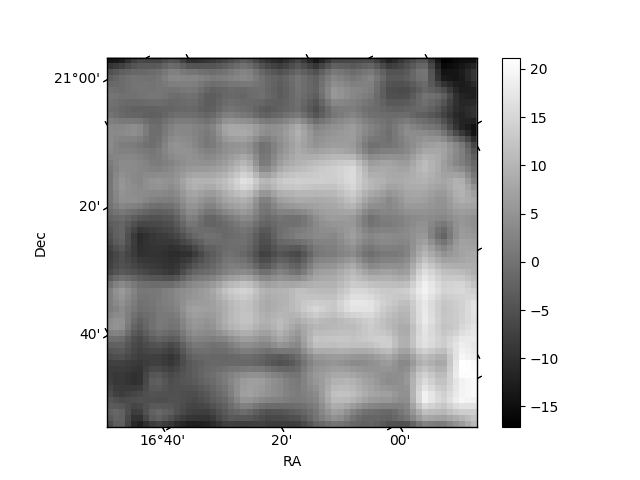
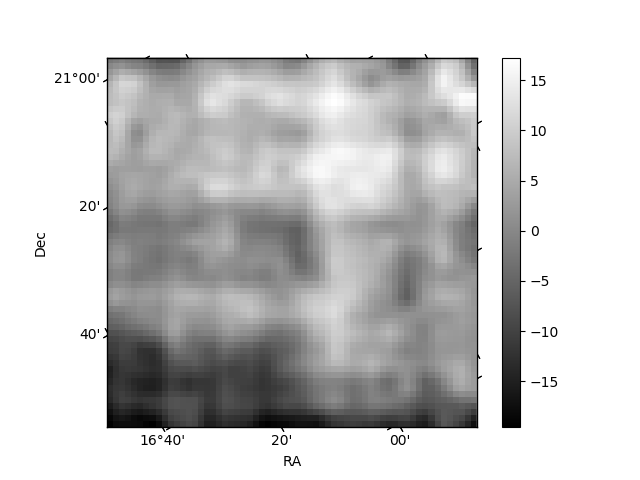
Histogram calculated using DETX and DETY for each event in the final _common_clean file
| Quadrant A | 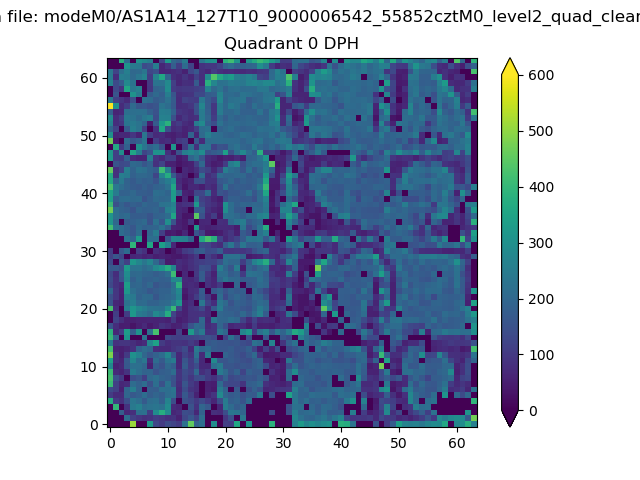 |
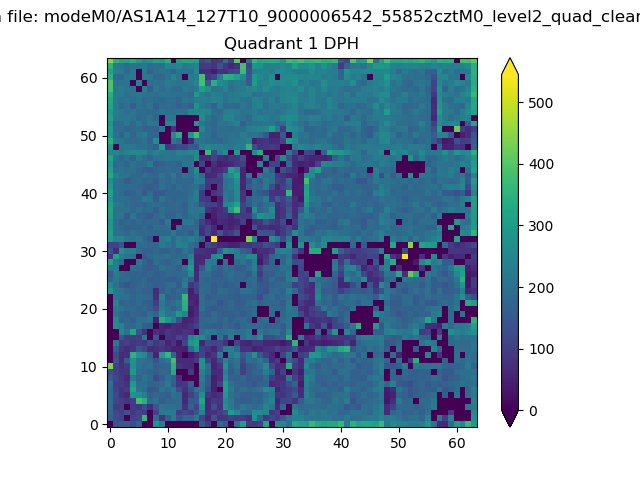 |
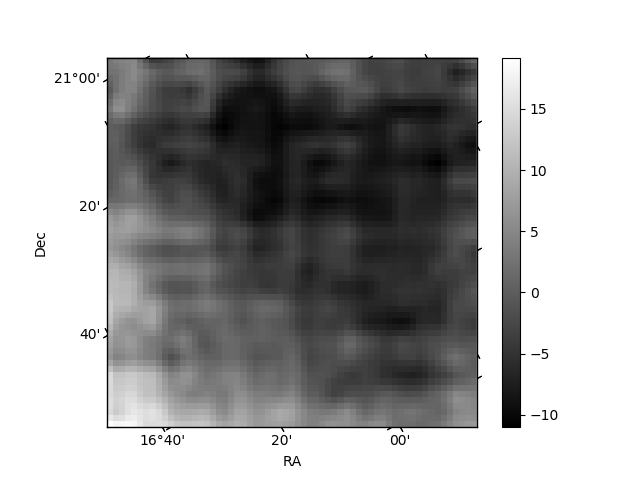
Quadrant B |
|---|---|---|---|
| Quadrant D | 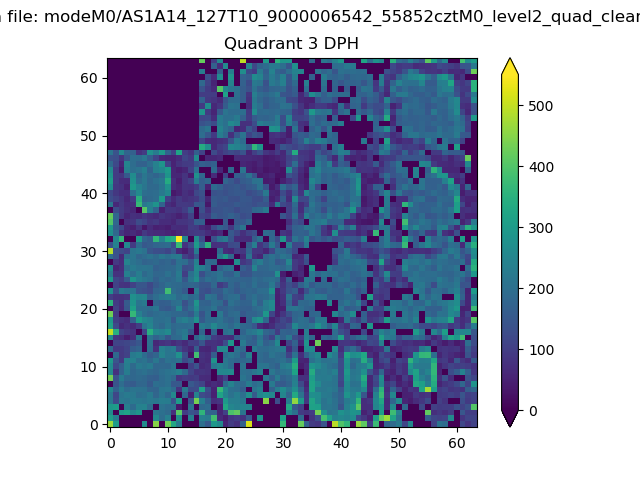 |
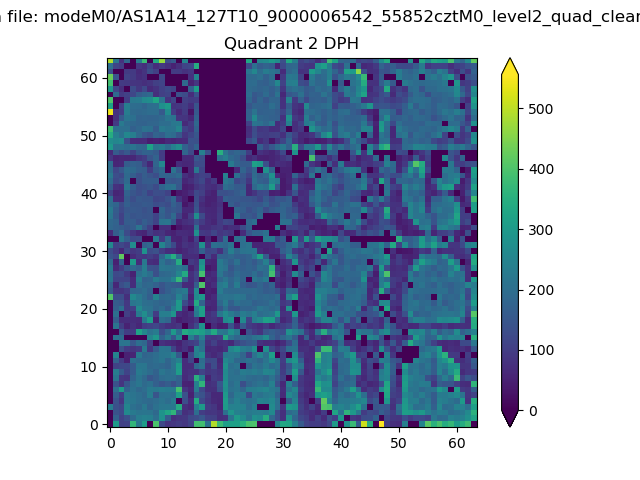 |
Quadrant C |
| Plot type | Count rate plots | Images |
|---|---|---|
| Comparison with Poisson distribution Blue bars denote a histogram of data divided into 1 sec bins. Red curve is a Poisson curve with rate = median count rate of data. |
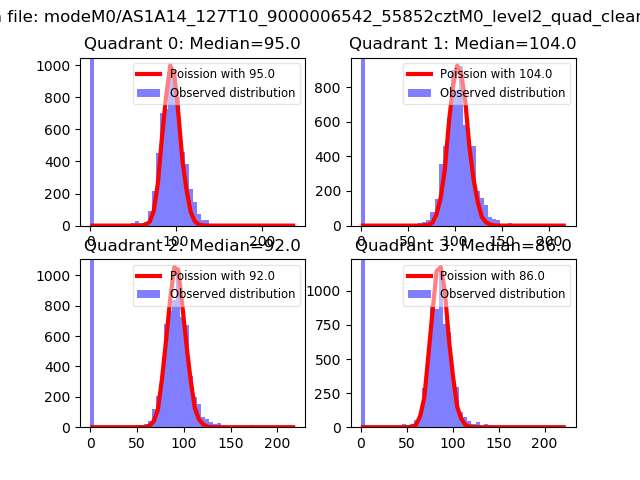 |
 |
| Quadrant-wise count rates Data is divided into 100 sec bins |
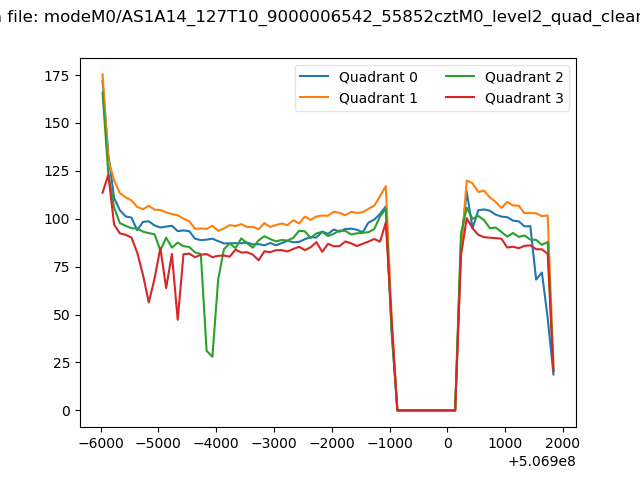 |
|
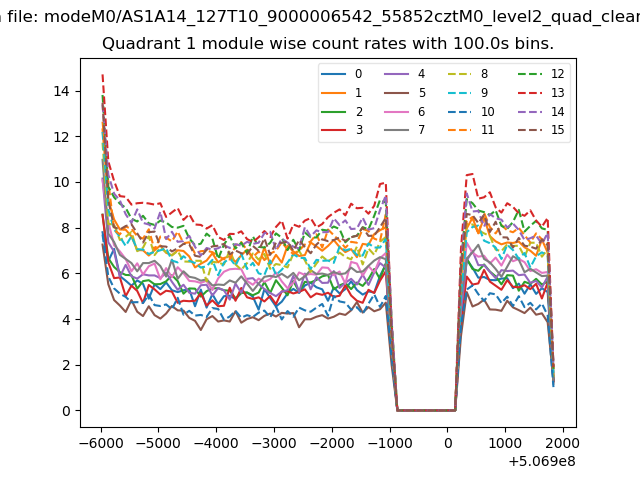
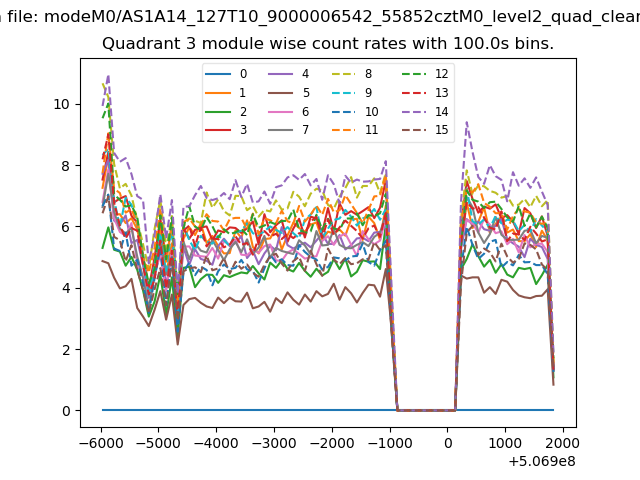
| Module-wise count rates for Quadrant A Data is divided into 100 sec bins |
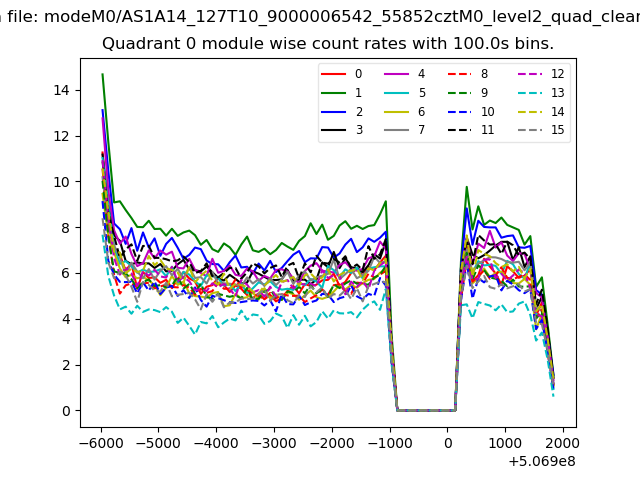 |
 |
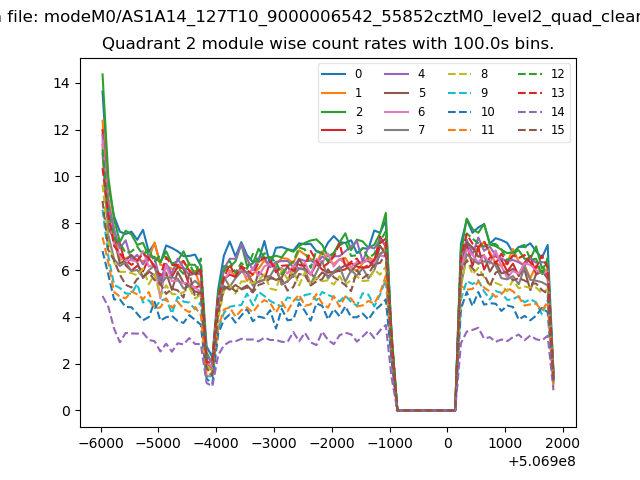
| Module-wise count rates for Quadrant B Data is divided into 100 sec bins |
 |
 |
| Module-wise count rates for Quadrant C Data is divided into 100 sec bins |
 |
 |
| Module-wise count rates for Quadrant D Data is divided into 100 sec bins |
 |
 |
| Parameter | Plot |
|---|---|
| CZT HV Monitor | 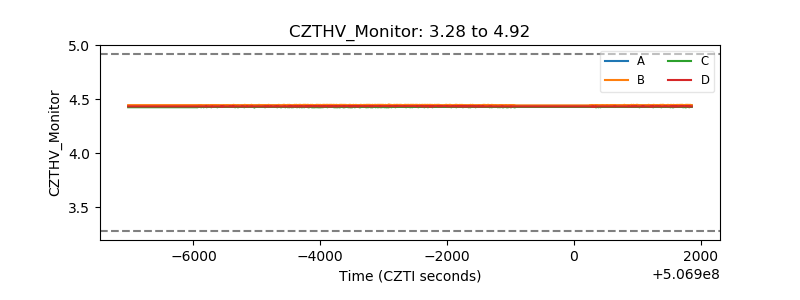 |
| D_VDD | 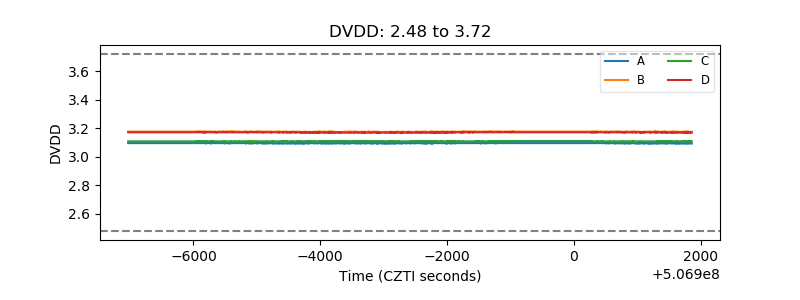 |
| Temperature 1 | 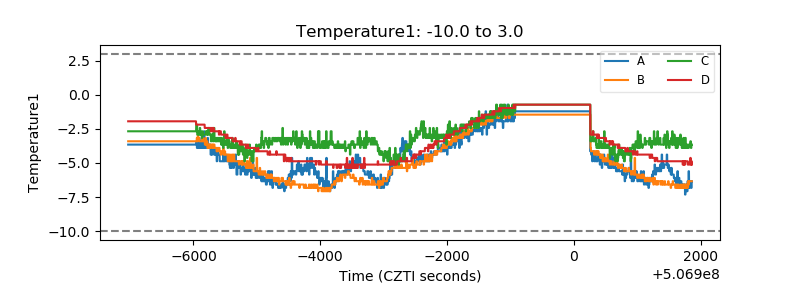 |
| Veto HV Monitor | 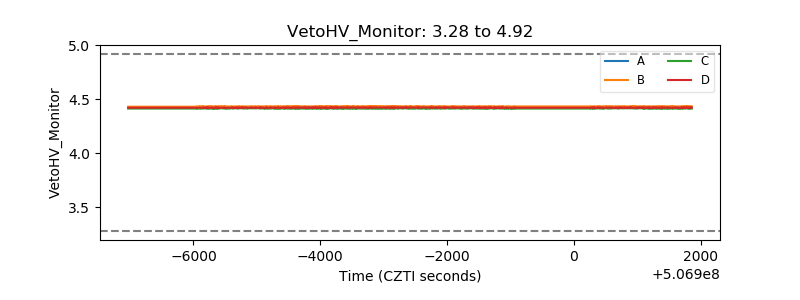 |
| Veto LLD | 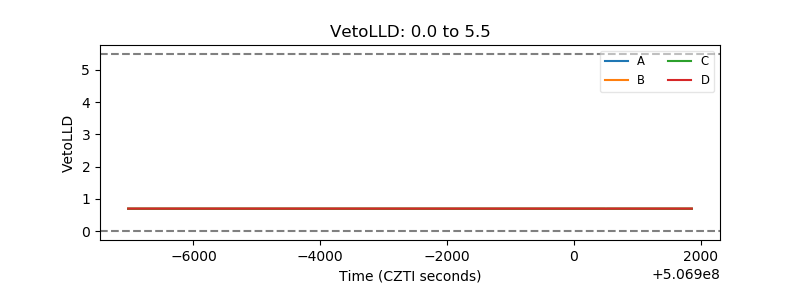 |
| Alpha Counter | 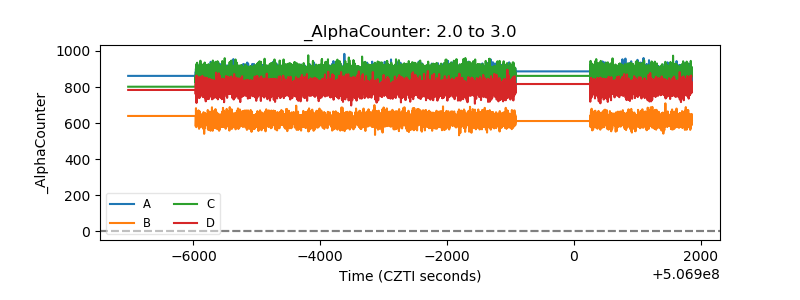 |
| _CPM_Rate | 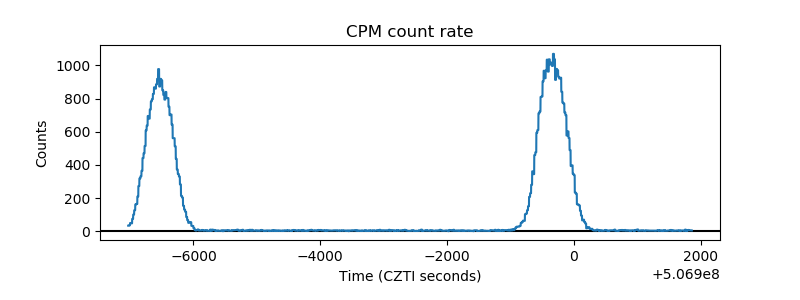 |
| CZT Counter | 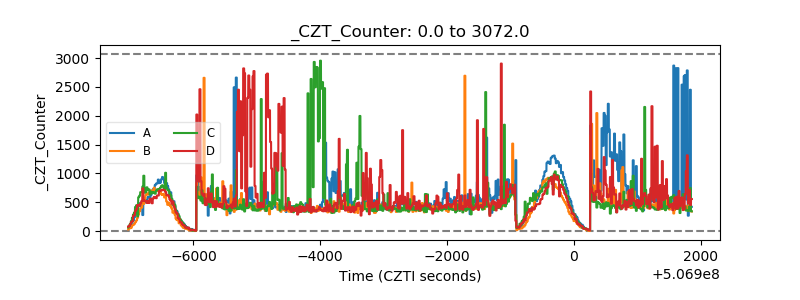 |
| +2.5 Volts monitor | 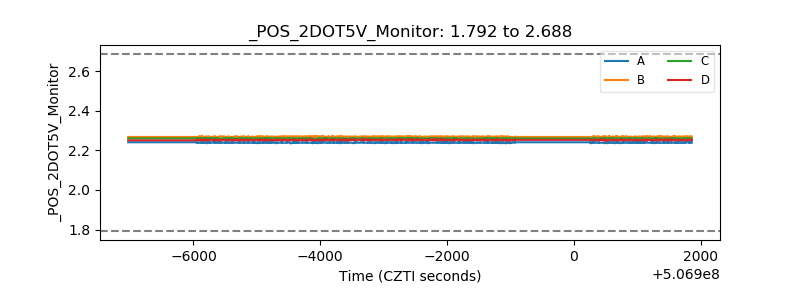 |
| +5 Volts monitor | 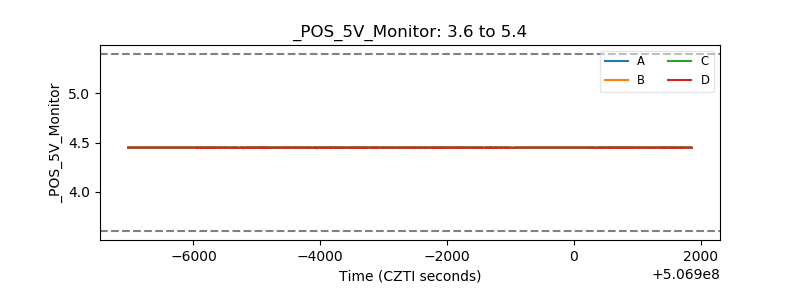 |
| _ROLL_ROT | 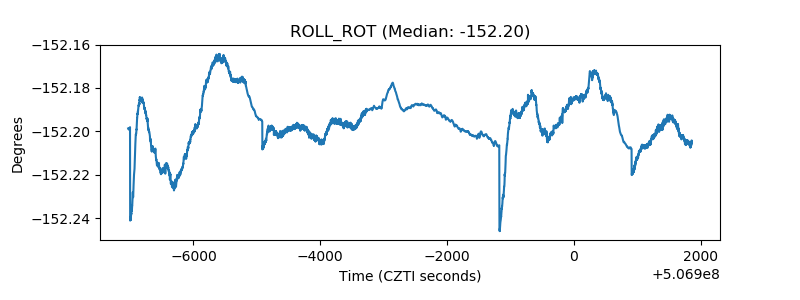 |
| _Roll_DEC | 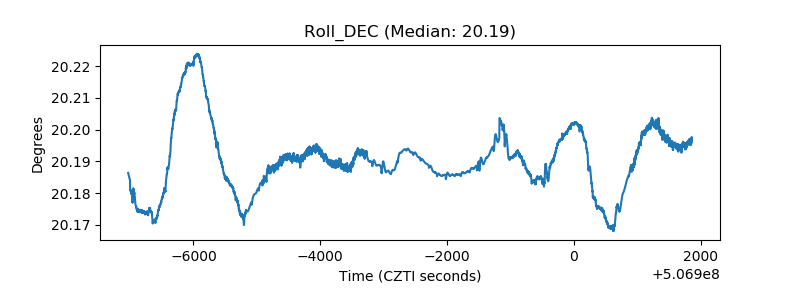 |
| _Roll_RA | 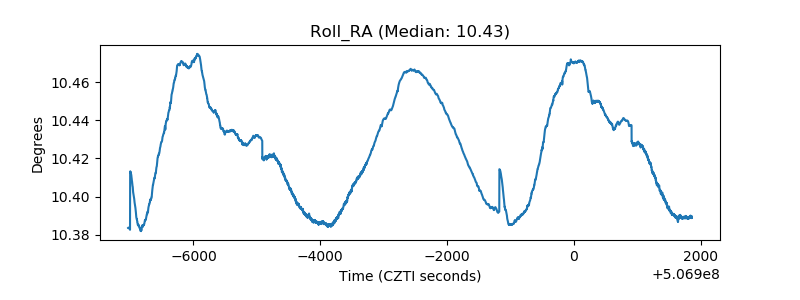 |
| Veto Counter | 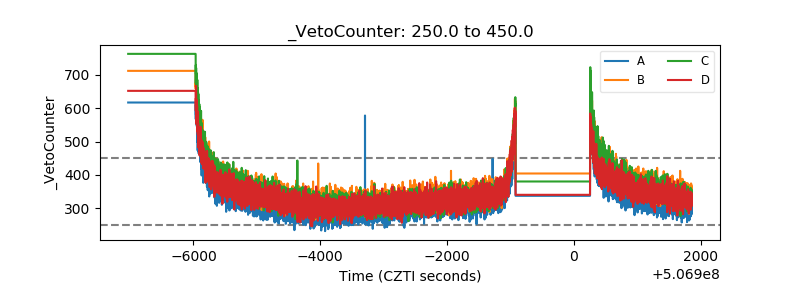 |