| Param | Original file | Final file |
|---|---|---|
| Filename | modeM0/AS1A14_127T10_9000006542_55853cztM0_level2.fits | modeM0/AS1A14_127T10_9000006542_55853cztM0_level2_quad_clean.evt |
| Size (bytes) | 482,290,560 | 95,440,320 |
| Size | 459.9 MB | 91.0 MB |
| Events in quadrant A | 4,502,137 | 618,476 |
| Events in quadrant B | 3,963,534 | 678,602 |
| Events in quadrant C | 4,991,175 | 550,771 |
| Events in quadrant D | 3,878,896 | 578,340 |
| Mode M0 | |||
|---|---|---|---|
| Quadrant | BADHDUFLAG | Total packets | Discarded packets |
| A | 0 | 17981 | 2 |
| B | 0 | 16327 | 2 |
| C | 0 | 19772 | 8 |
| D | 0 | 16205 | 2 |
| Mode M9 | |||
|---|---|---|---|
| Quadrant | BADHDUFLAG | Total packets | Discarded packets |
| A | 0 | 14 | 0 |
| B | 0 | 15 | 0 |
| C | 0 | 15 | 0 |
| D | 0 | 15 | 0 |
| Mode SS | |||
|---|---|---|---|
| Quadrant | BADHDUFLAG | Total packets | Discarded packets |
| A | 0 | 136 | 0 |
| B | 0 | 136 | 0 |
| C | 0 | 136 | 0 |
| D | 0 | 136 | 0 |
| Quadrant | Total seconds | Saturated seconds | Saturation percentage |
|---|---|---|---|
| A | 6649 | 329 | 4.948112% |
| B | 6649 | 276 | 4.151000% |
| C | 6648 | 849 | 12.770758% |
| D | 6648 | 118 | 1.774970% |
Noise dominated data is calculated using 1-second bins in cleaned event files. If a bin has >2000 counts, and if more than 50% of those come from <1% of pixels, then it is considered to be noise-dominated and hence unusable.
| Quadrant | # 1 sec bins | Bins with >0 counts | Bins with >2000 counts | High rate bins dominated by noise | Noise dominated (total time) | Noise dominated (detector-on time) | Marked lightcurve |
|---|---|---|---|---|---|---|---|
| A | 7838 | 6648 | 301 | 301 | 3.84% | 4.53% | 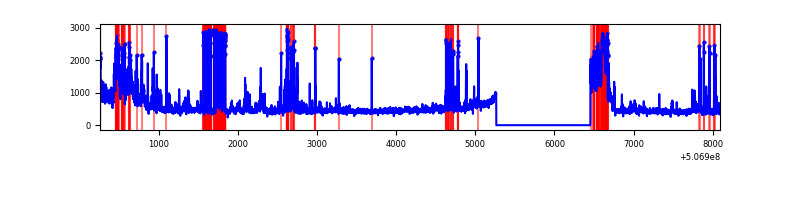 |
| B | 7839 | 6650 | 139 | 139 | 1.77% | 2.09% | 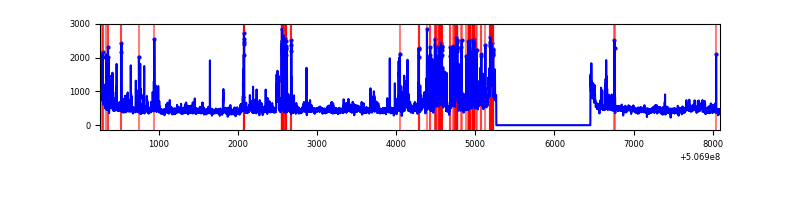 |
| C | 7837 | 6648 | 711 | 711 | 9.07% | 10.69% | 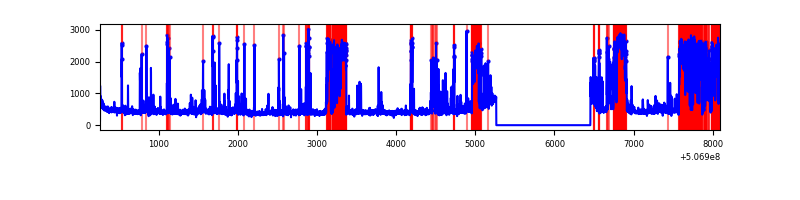 |
| D | 7838 | 6648 | 86 | 86 | 1.10% | 1.29% | 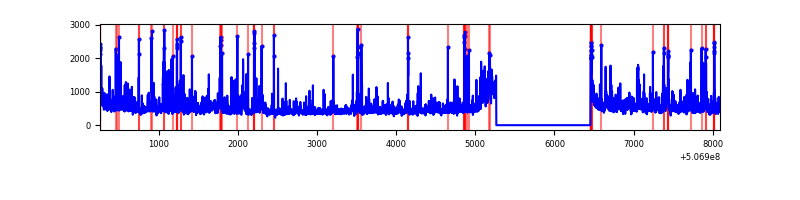 |
Top three noisy pixels from each quadrant. If the there are fewer than three noisy pixels in the level2.evt file, extra rows are filled as -1
| Pixel properties | Quadrant properties | ||||||
|---|---|---|---|---|---|---|---|
| Quadrant | DetID | PixID | Counts | Sigma | Mean | Median | Sigma |
| A | 12 | 115 | 1010223 | 5928.01 | 692 | 675 | 170.3 |
| A | 8 | 192 | 249446 | 1460.77 | 692 | 675 | 170.3 |
| A | 4 | 249 | 184459 | 1079.17 | 692 | 675 | 170.3 |
| B | 5 | 185 | 991678 | 6504.81 | 694 | 666 | 152.4 |
| B | 0 | 197 | 72080 | 468.75 | 694 | 666 | 152.4 |
| B | 2 | 249 | 58295 | 378.27 | 694 | 666 | 152.4 |
| C | 15 | 199 | 1782241 | 10063.29 | 644 | 636 | 177.0 |
| C | 13 | 3 | 230357 | 1297.57 | 644 | 636 | 177.0 |
| C | 6 | 223 | 228934 | 1289.53 | 644 | 636 | 177.0 |
| D | 2 | 62 | 362030 | 1854.12 | 683 | 653 | 194.9 |
| D | 11 | 129 | 229784 | 1175.6 | 683 | 653 | 194.9 |
| D | 7 | 96 | 168216 | 859.71 | 683 | 653 | 194.9 |
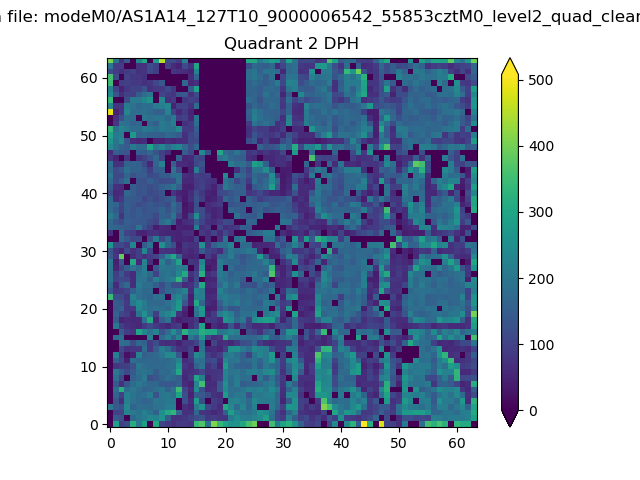
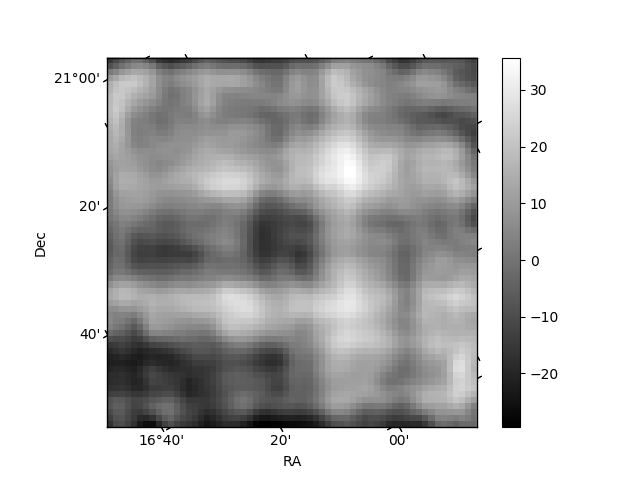
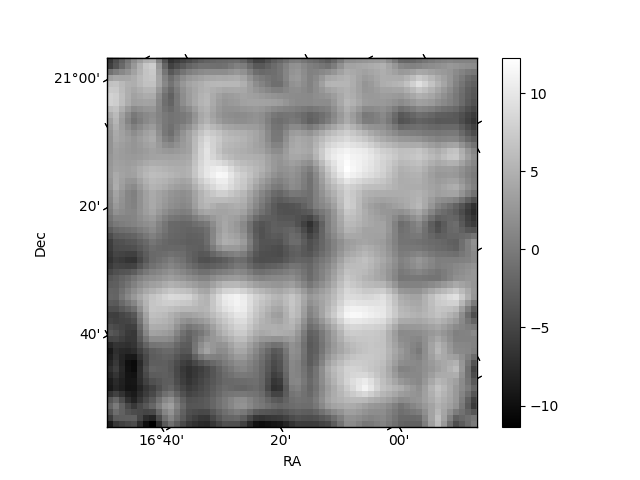
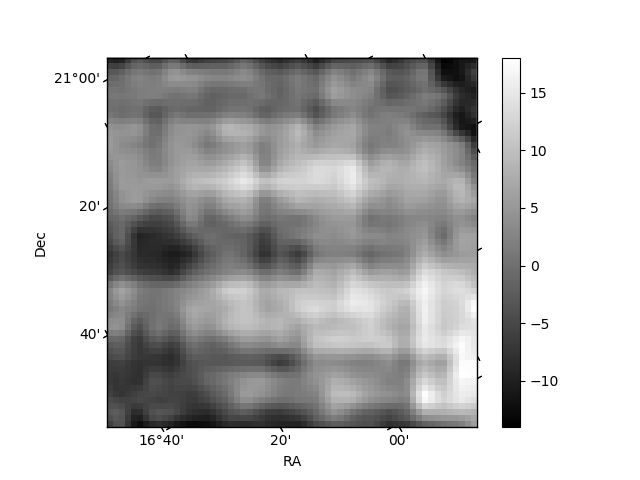
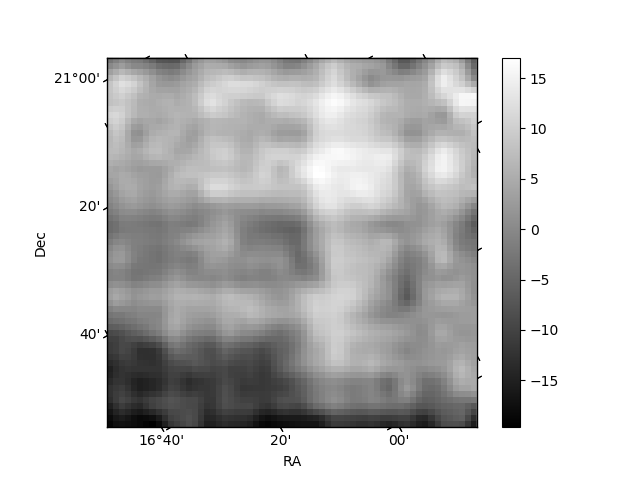
Histogram calculated using DETX and DETY for each event in the final _common_clean file
| Quadrant A | 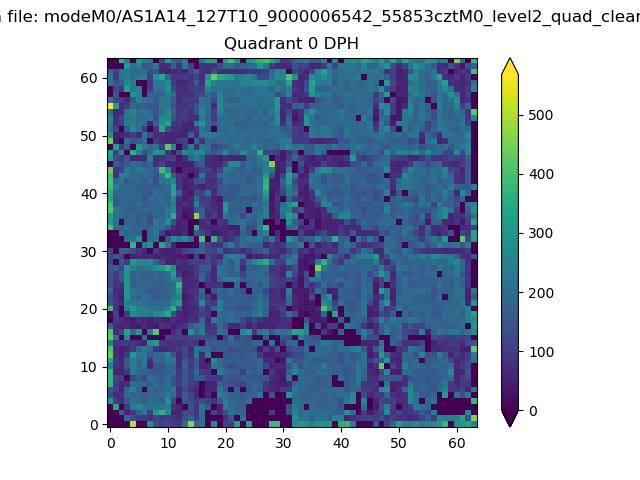 |
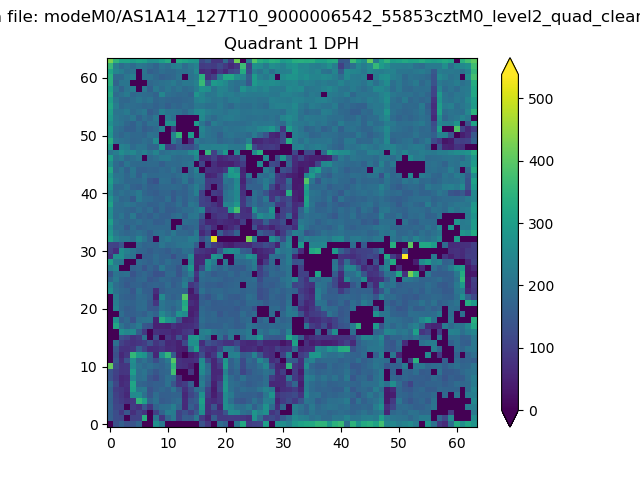 |
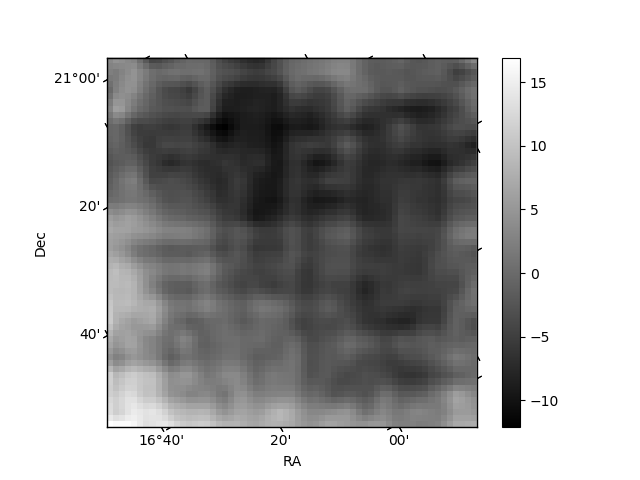
Quadrant B |
|---|---|---|---|
| Quadrant D | 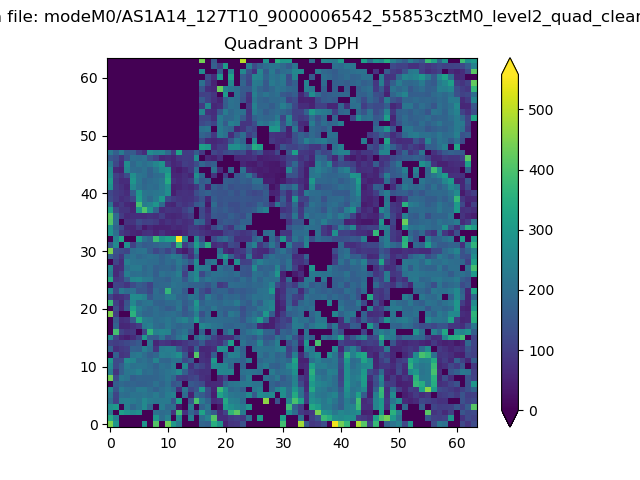 |
 |
Quadrant C |
| Plot type | Count rate plots | Images |
|---|---|---|
| Comparison with Poisson distribution Blue bars denote a histogram of data divided into 1 sec bins. Red curve is a Poisson curve with rate = median count rate of data. |
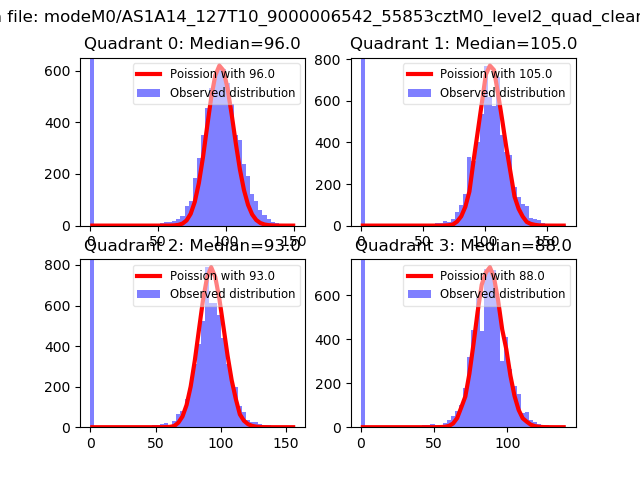 |
 |
| Quadrant-wise count rates Data is divided into 100 sec bins |
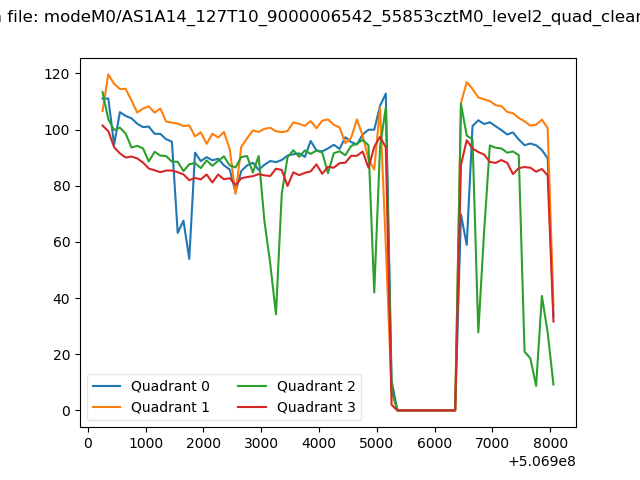 |
|
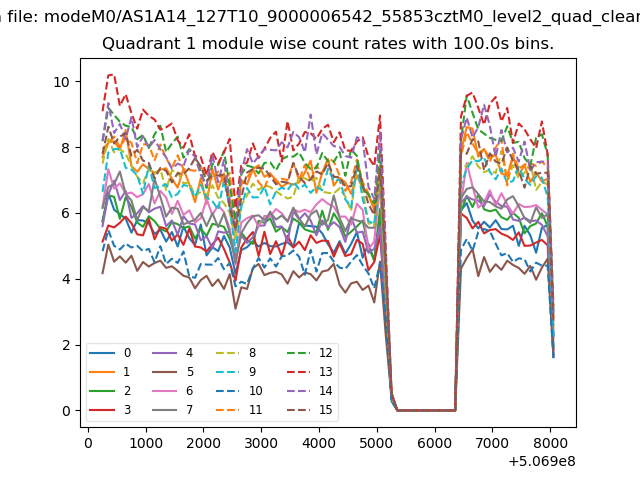
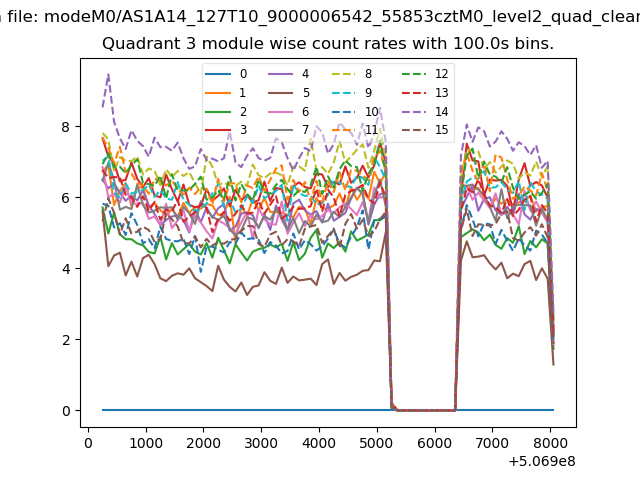
| Module-wise count rates for Quadrant A Data is divided into 100 sec bins |
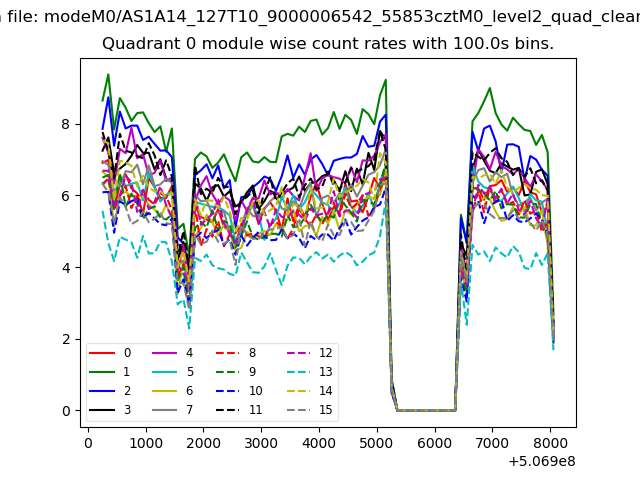 |
 |
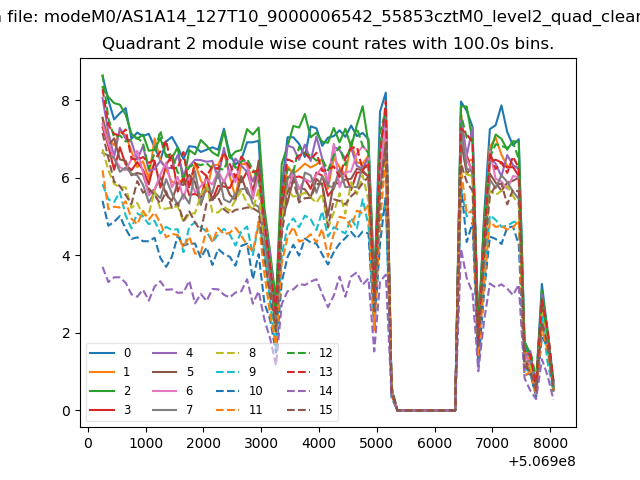
| Module-wise count rates for Quadrant B Data is divided into 100 sec bins |
 |
 |
| Module-wise count rates for Quadrant C Data is divided into 100 sec bins |
 |
 |
| Module-wise count rates for Quadrant D Data is divided into 100 sec bins |
 |
 |
| Parameter | Plot |
|---|---|
| CZT HV Monitor | 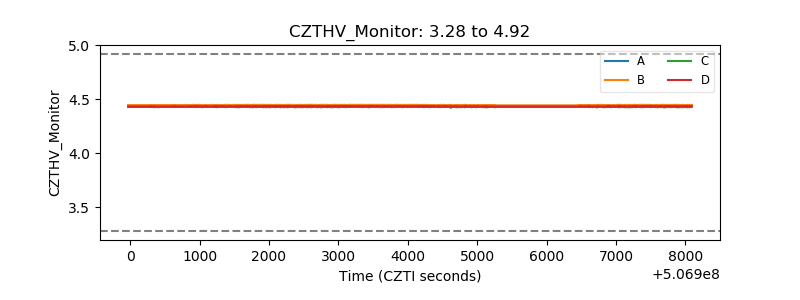 |
| D_VDD | 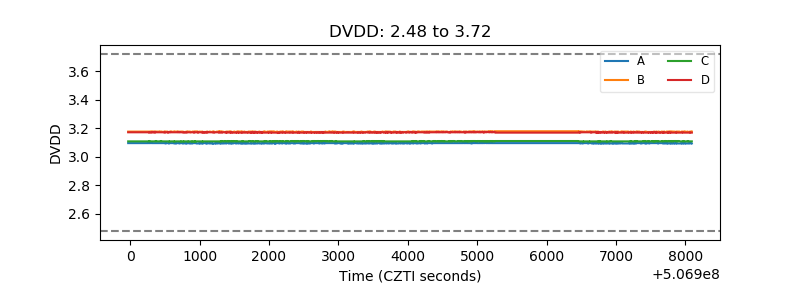 |
| Temperature 1 | 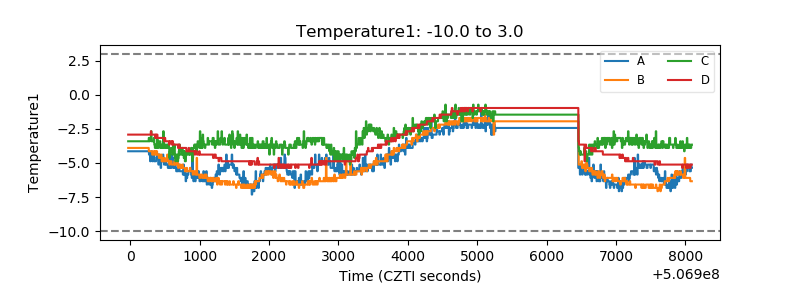 |
| Veto HV Monitor | 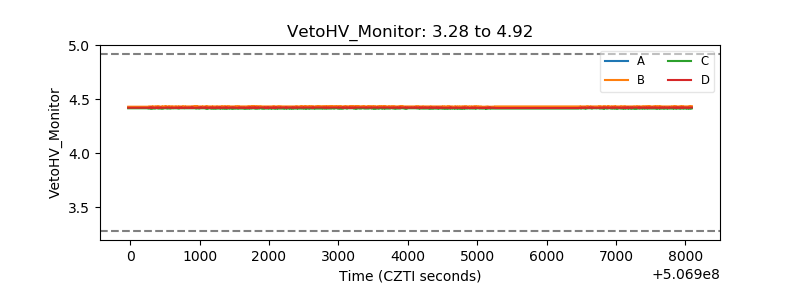 |
| Veto LLD | 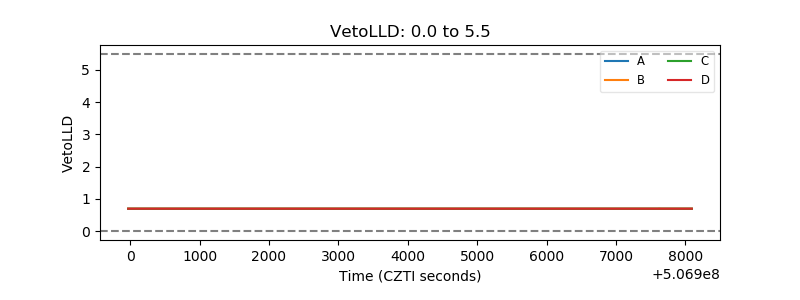 |
| Alpha Counter | 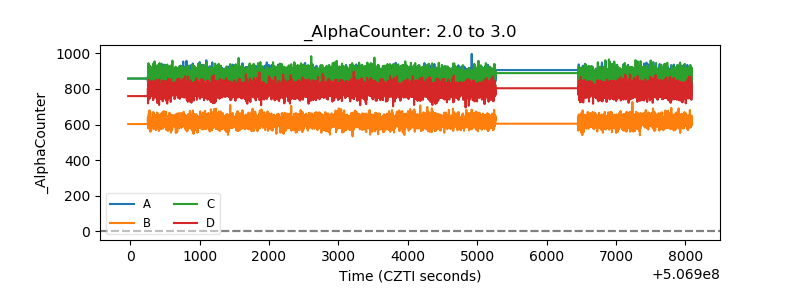 |
| _CPM_Rate | 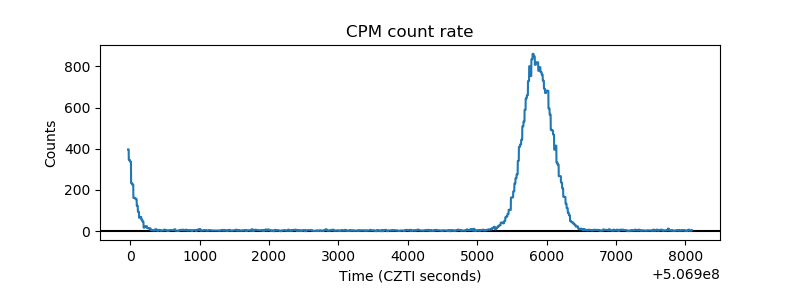 |
| CZT Counter | 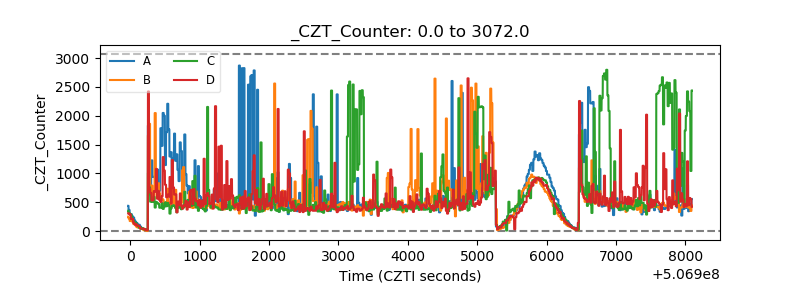 |
| +2.5 Volts monitor | 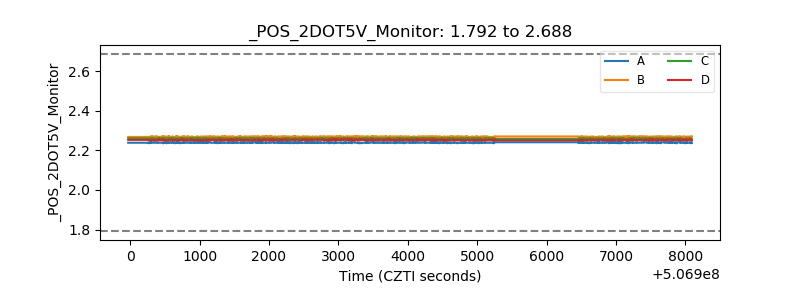 |
| +5 Volts monitor | 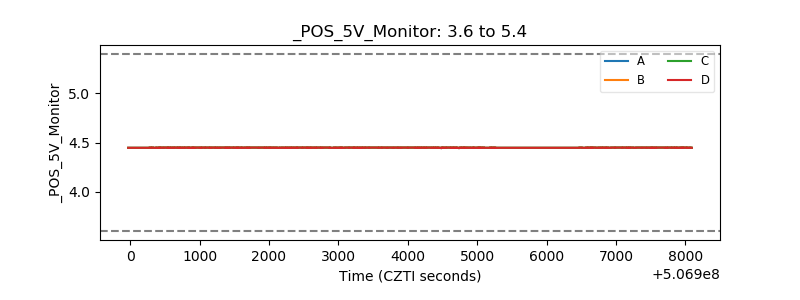 |
| _ROLL_ROT | 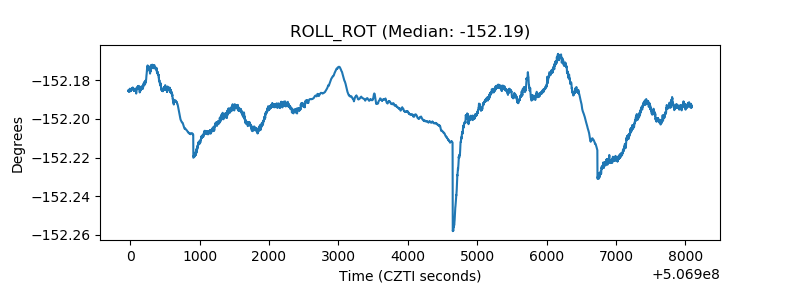 |
| _Roll_DEC | 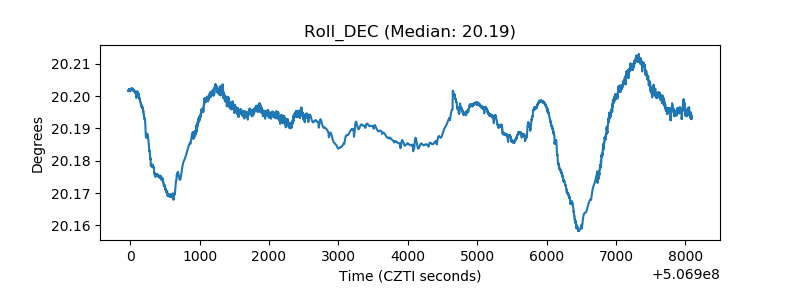 |
| _Roll_RA | 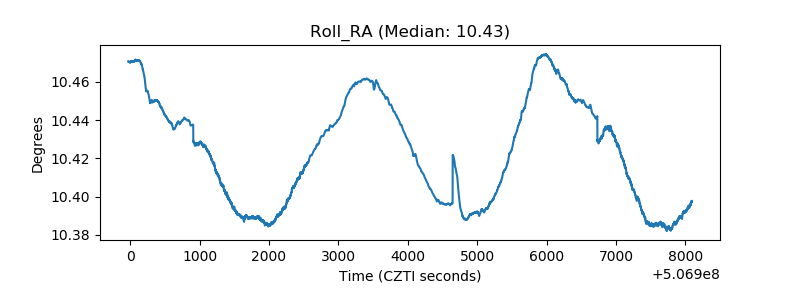 |
| Veto Counter | 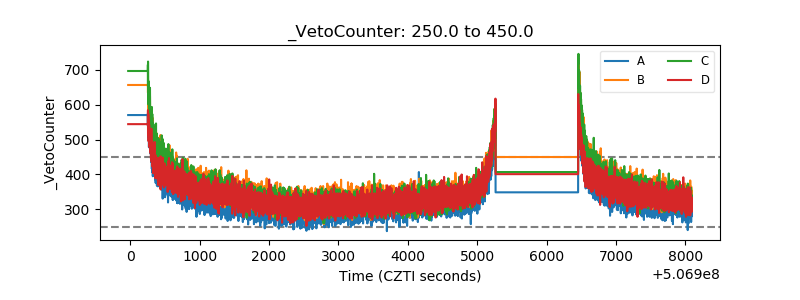 |