| Param | Original file | Final file |
|---|---|---|
| Filename | modeM0/AS1A14_030T02_9000006544_55858cztM0_level2.fits | modeM0/AS1A14_030T02_9000006544_55858cztM0_level2_quad_clean.evt |
| Size (bytes) | 639,141,120 | 108,797,760 |
| Size | 609.5 MB | 103.8 MB |
| Events in quadrant A | 4,493,534 | 695,542 |
| Events in quadrant B | 3,573,943 | 760,356 |
| Events in quadrant C | 4,453,110 | 668,393 |
| Events in quadrant D | 10,533,071 | 625,348 |
| Mode SS | |||
|---|---|---|---|
| Quadrant | BADHDUFLAG | Total packets | Discarded packets |
| A | 0 | 158 | 0 |
| B | 0 | 158 | 0 |
| C | 0 | 158 | 0 |
| D | 0 | 158 | 0 |
| Mode M0 | |||
|---|---|---|---|
| Quadrant | BADHDUFLAG | Total packets | Discarded packets |
| A | 0 | 18894 | 0 |
| B | 0 | 16621 | 0 |
| C | 0 | 19232 | 0 |
| D | 0 | 36969 | 0 |
| Quadrant | Total seconds | Saturated seconds | Saturation percentage |
|---|---|---|---|
| A | 7828 | 142 | 1.814001% |
| B | 7828 | 49 | 0.625958% |
| C | 7828 | 245 | 3.129790% |
| D | 7829 | 347 | 4.432239% |
Noise dominated data is calculated using 1-second bins in cleaned event files. If a bin has >2000 counts, and if more than 50% of those come from <1% of pixels, then it is considered to be noise-dominated and hence unusable.
| Quadrant | # 1 sec bins | Bins with >0 counts | Bins with >2000 counts | High rate bins dominated by noise | Noise dominated (total time) | Noise dominated (detector-on time) | Marked lightcurve |
|---|---|---|---|---|---|---|---|
| A | 7828 | 7828 | 147 | 147 | 1.88% | 1.88% | 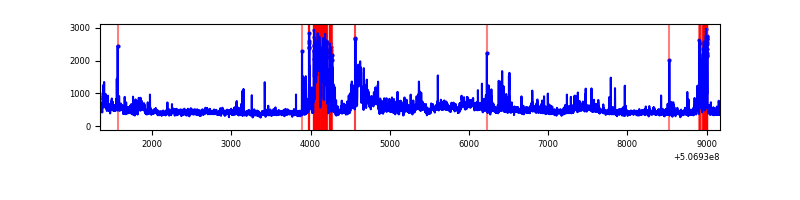 |
| B | 7828 | 7828 | 31 | 31 | 0.40% | 0.40% | 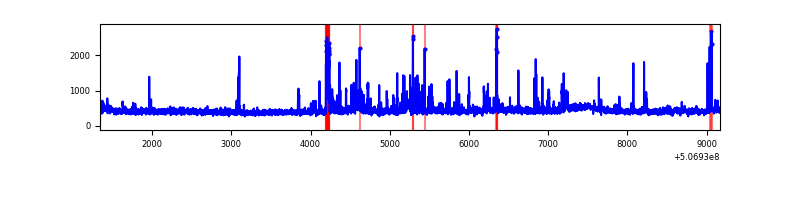 |
| C | 7828 | 7828 | 225 | 225 | 2.87% | 2.87% | 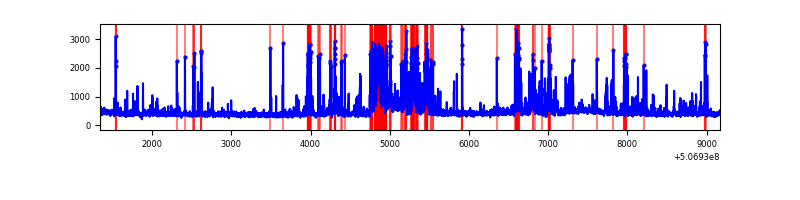 |
| D | 7829 | 7829 | 578 | 578 | 7.38% | 7.38% | 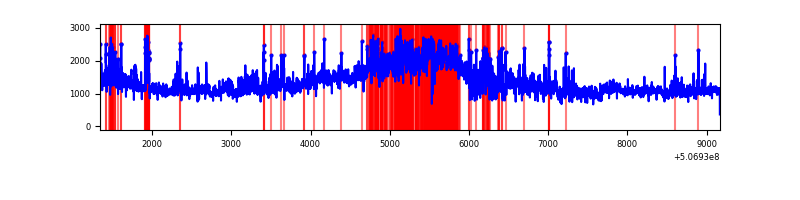 |
Top three noisy pixels from each quadrant. If the there are fewer than three noisy pixels in the level2.evt file, extra rows are filled as -1
| Pixel properties | Quadrant properties | ||||||
|---|---|---|---|---|---|---|---|
| Quadrant | DetID | PixID | Counts | Sigma | Mean | Median | Sigma |
| A | 5 | 168 | 356350 | 1826.06 | 783 | 763 | 194.7 |
| A | 3 | 14 | 285839 | 1463.96 | 783 | 763 | 194.7 |
| A | 12 | 115 | 255455 | 1307.93 | 783 | 763 | 194.7 |
| B | 5 | 185 | 102737 | 607.45 | 783 | 754 | 167.9 |
| B | 5 | 236 | 73814 | 435.17 | 783 | 754 | 167.9 |
| B | 4 | 169 | 53190 | 312.33 | 783 | 754 | 167.9 |
| C | 12 | 254 | 687085 | 3259.85 | 762 | 755 | 210.5 |
| C | 12 | 250 | 313037 | 1483.24 | 762 | 755 | 210.5 |
| C | 12 | 252 | 190418 | 900.84 | 762 | 755 | 210.5 |
| D | 2 | 62 | 6938775 | 32568.24 | 750 | 716 | 213.0 |
| D | 8 | 240 | 199271 | 932.05 | 750 | 716 | 213.0 |
| D | 6 | 239 | 132929 | 620.63 | 750 | 716 | 213.0 |
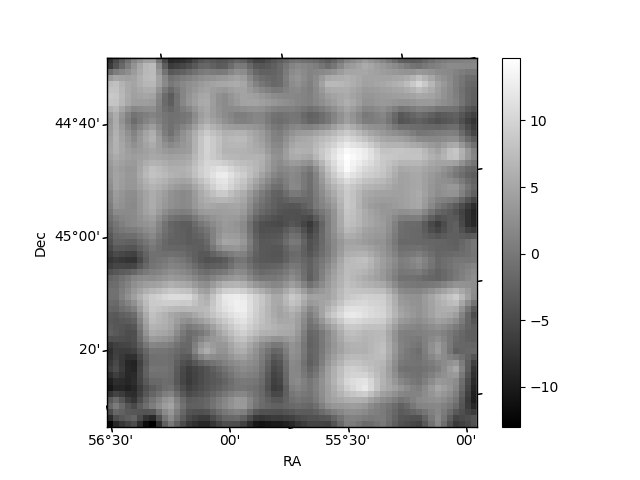
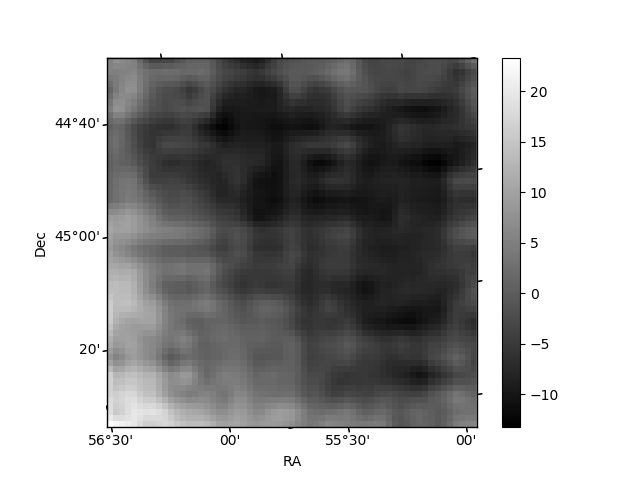
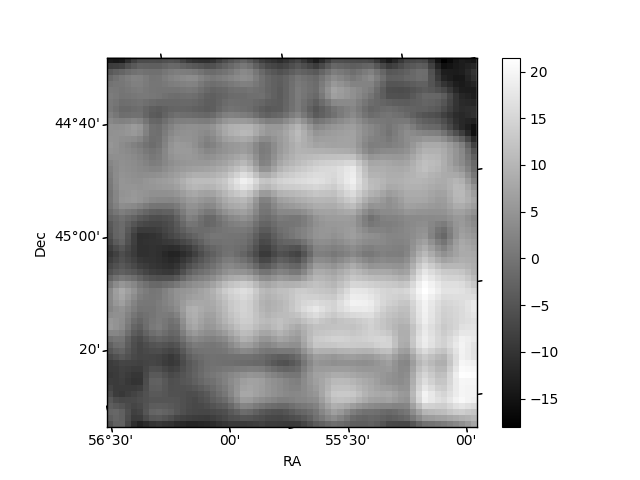
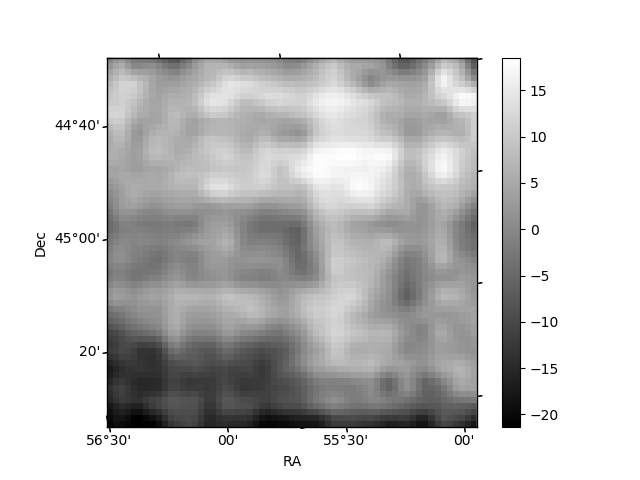
Histogram calculated using DETX and DETY for each event in the final _common_clean file
| Quadrant A | 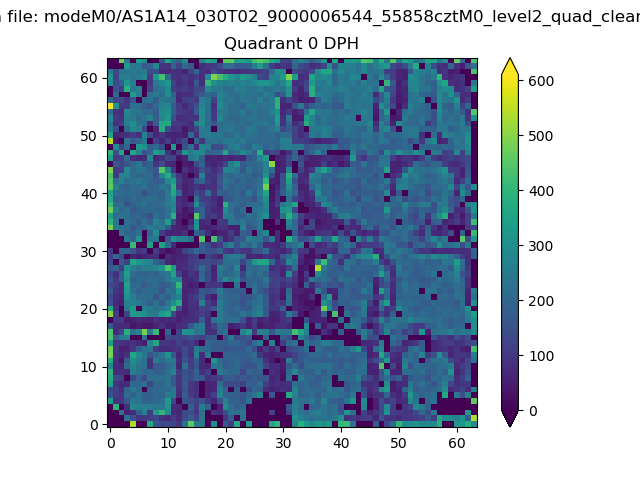 |
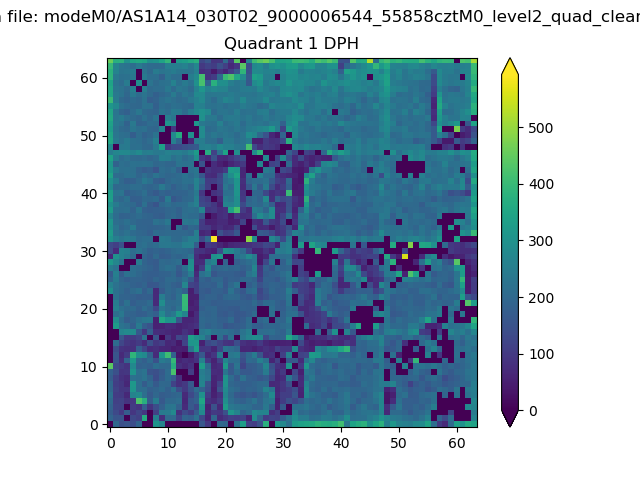 |
Quadrant B |
|---|---|---|---|
| Quadrant D | 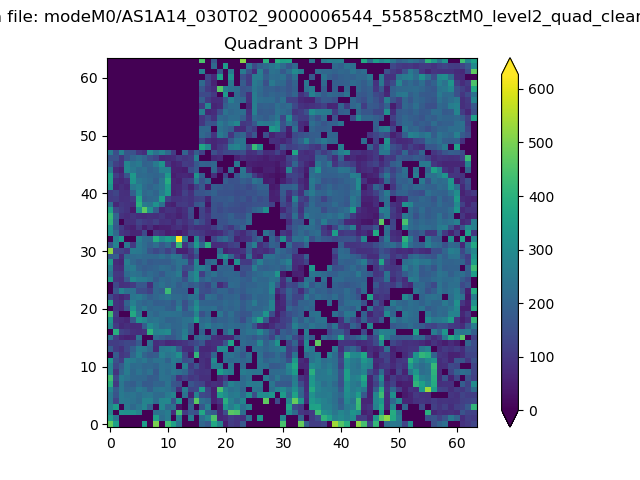 |
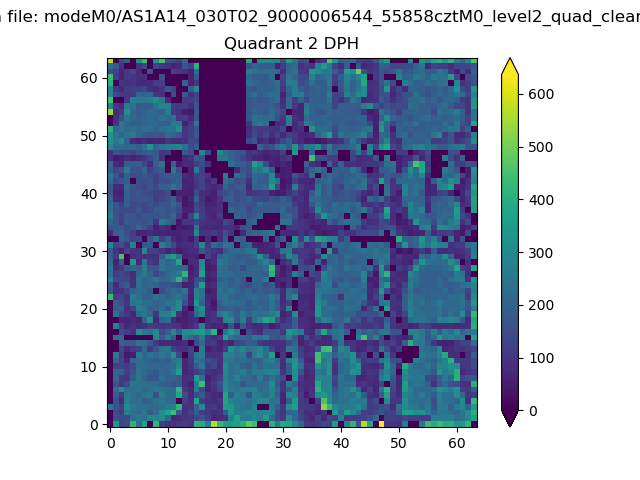 |
Quadrant C |
| Plot type | Count rate plots | Images |
|---|---|---|
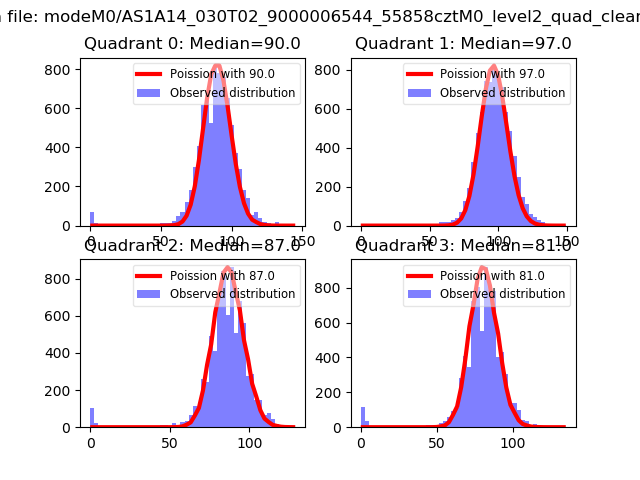
| Comparison with Poisson distribution Blue bars denote a histogram of data divided into 1 sec bins. Red curve is a Poisson curve with rate = median count rate of data. |
 |
 |
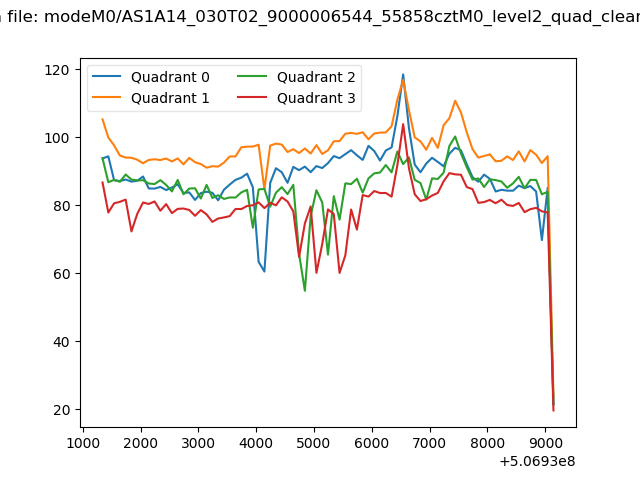
| Quadrant-wise count rates Data is divided into 100 sec bins |
 |
|
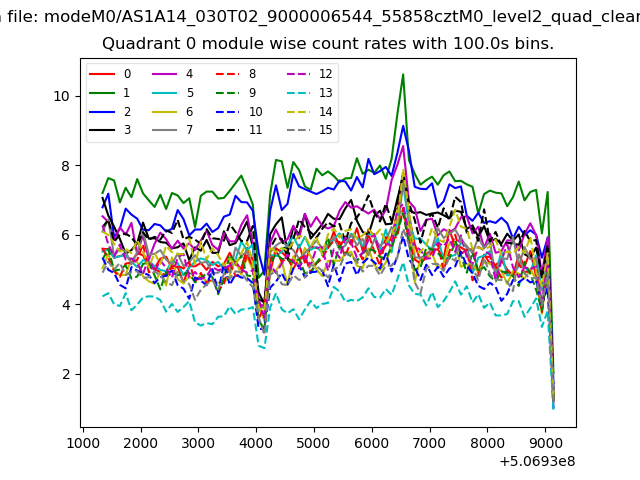
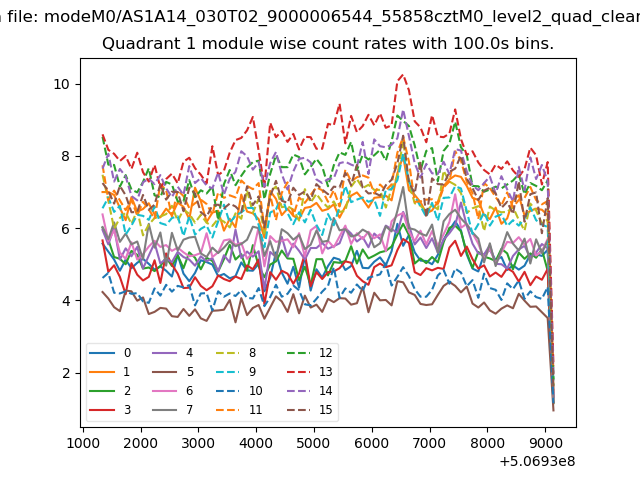
| Module-wise count rates for Quadrant A Data is divided into 100 sec bins |
 |
 |
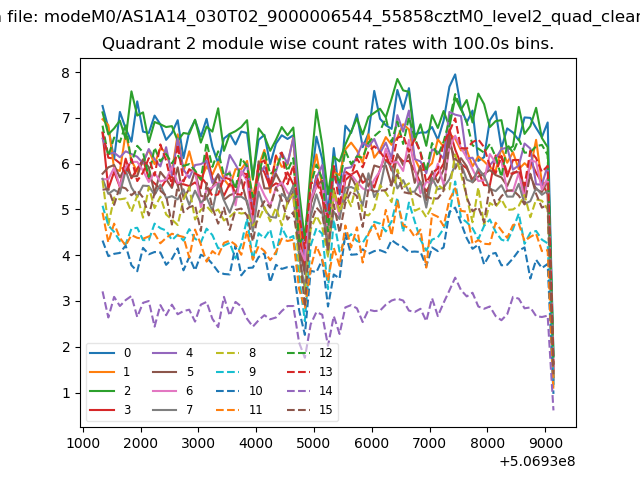
| Module-wise count rates for Quadrant B Data is divided into 100 sec bins |
 |
 |
| Module-wise count rates for Quadrant C Data is divided into 100 sec bins |
 |
 |
| Module-wise count rates for Quadrant D Data is divided into 100 sec bins |
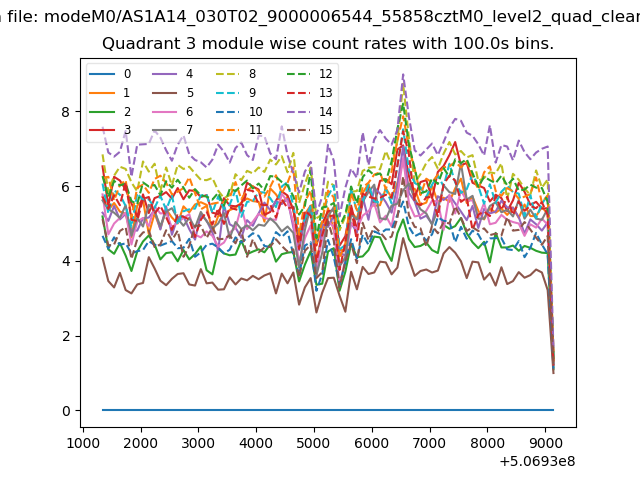 |
 |
| Parameter | Plot |
|---|---|
| CZT HV Monitor | 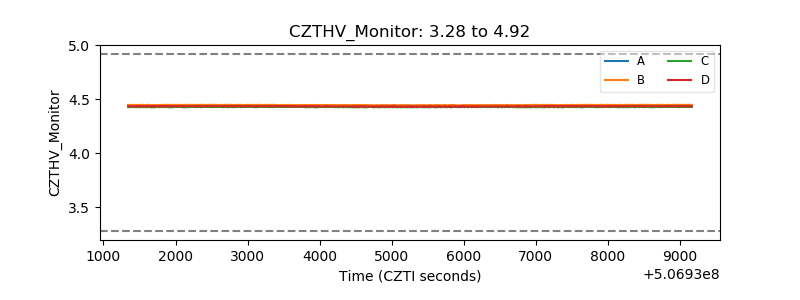 |
| D_VDD | 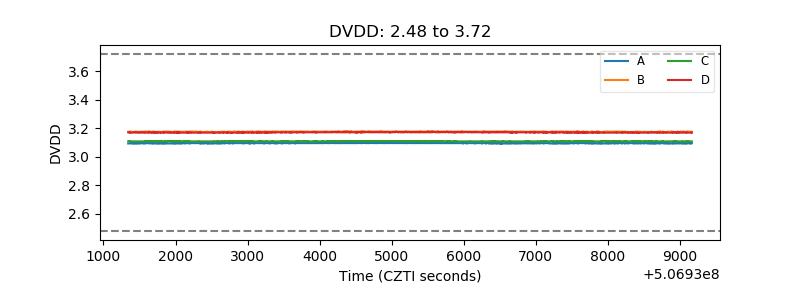 |
| Temperature 1 | 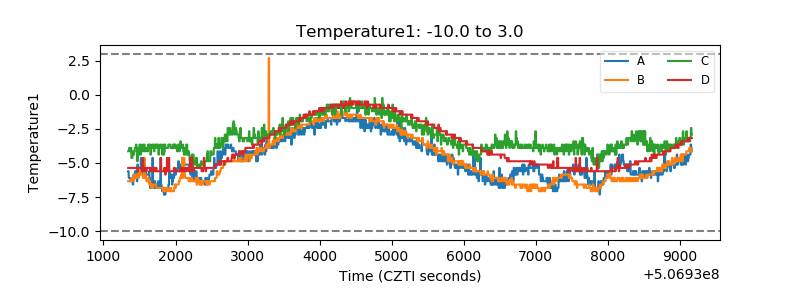 |
| Veto HV Monitor | 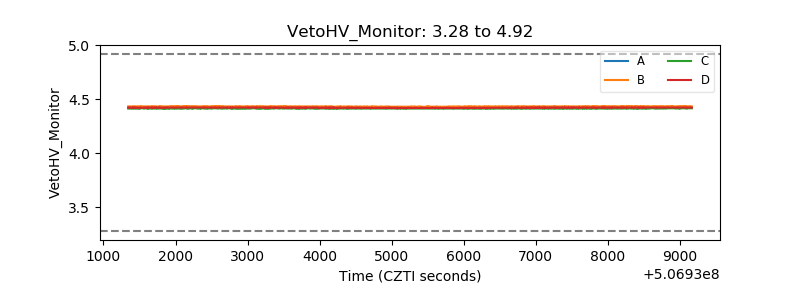 |
| Veto LLD | 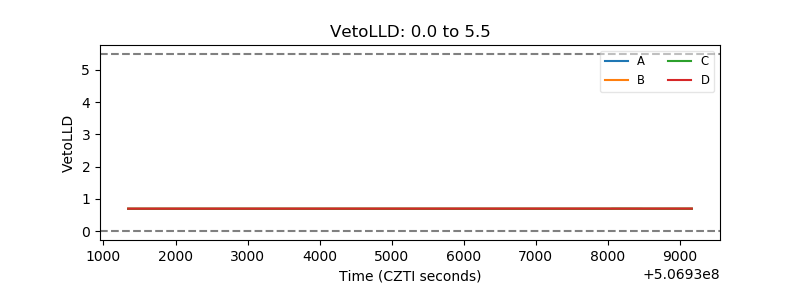 |
| Alpha Counter | 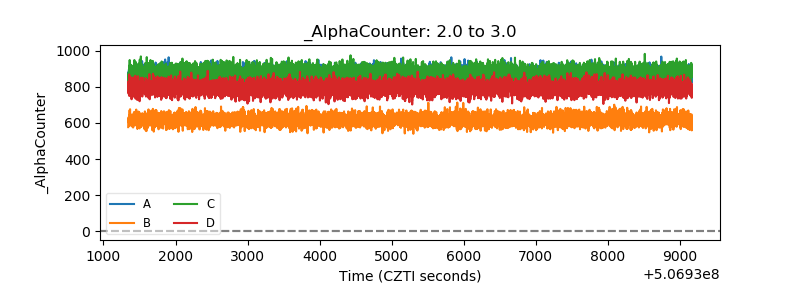 |
| _CPM_Rate | 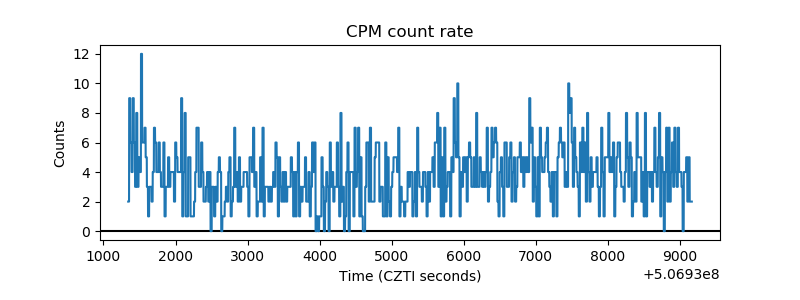 |
| CZT Counter | 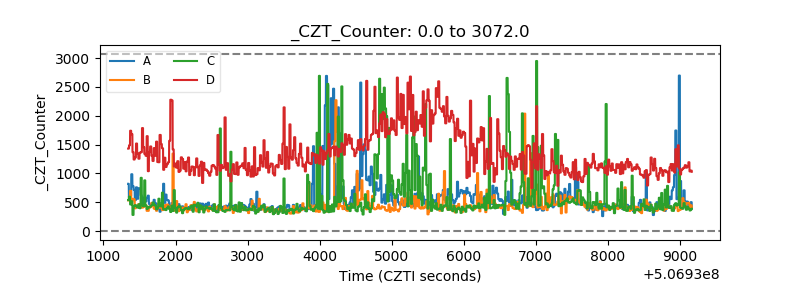 |
| +2.5 Volts monitor |  |
| +5 Volts monitor |  |
| _ROLL_ROT | 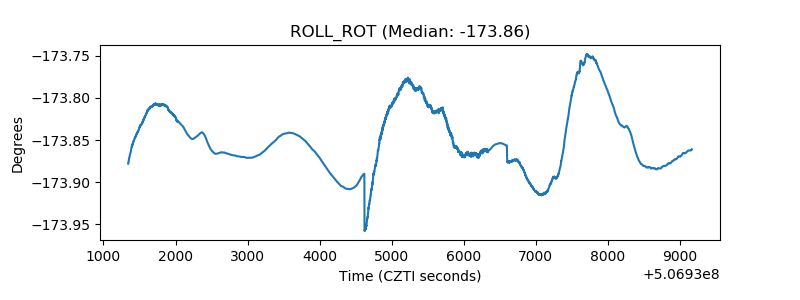 |
| _Roll_DEC | 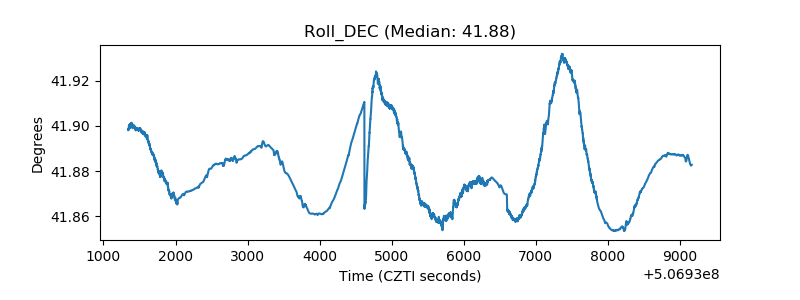 |
| _Roll_RA | 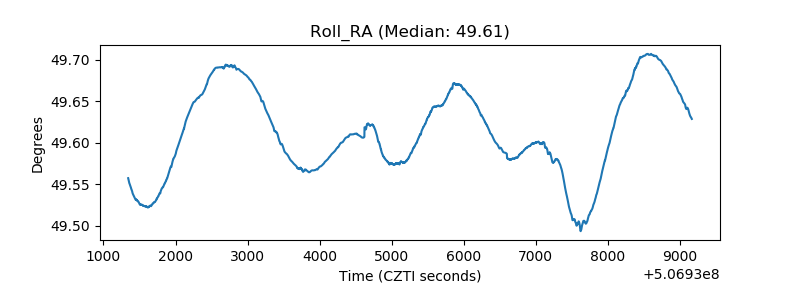 |
| Veto Counter | 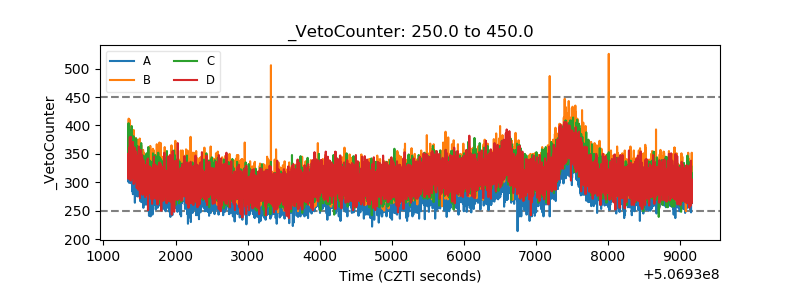 |