| Param | Original file | Final file |
|---|---|---|
| Filename | modeM0/AS1A14_030T02_9000006544_55861cztM0_level2.fits | modeM0/AS1A14_030T02_9000006544_55861cztM0_level2_quad_clean.evt |
| Size (bytes) | 542,056,320 | 111,476,160 |
| Size | 516.9 MB | 106.3 MB |
| Events in quadrant A | 3,965,488 | 718,987 |
| Events in quadrant B | 3,876,636 | 779,265 |
| Events in quadrant C | 4,179,553 | 692,004 |
| Events in quadrant D | 7,427,656 | 633,277 |
| Mode SS | |||
|---|---|---|---|
| Quadrant | BADHDUFLAG | Total packets | Discarded packets |
| A | 0 | 158 | 0 |
| B | 0 | 158 | 0 |
| C | 0 | 158 | 0 |
| D | 0 | 158 | 0 |
| Mode M0 | |||
|---|---|---|---|
| Quadrant | BADHDUFLAG | Total packets | Discarded packets |
| A | 0 | 17329 | 0 |
| B | 0 | 16918 | 0 |
| C | 0 | 18388 | 1 |
| D | 0 | 27796 | 0 |
| Quadrant | Total seconds | Saturated seconds | Saturation percentage |
|---|---|---|---|
| A | 7938 | 66 | 0.831444% |
| B | 7938 | 66 | 0.831444% |
| C | 7938 | 114 | 1.436130% |
| D | 7938 | 398 | 5.013857% |
Noise dominated data is calculated using 1-second bins in cleaned event files. If a bin has >2000 counts, and if more than 50% of those come from <1% of pixels, then it is considered to be noise-dominated and hence unusable.
| Quadrant | # 1 sec bins | Bins with >0 counts | Bins with >2000 counts | High rate bins dominated by noise | Noise dominated (total time) | Noise dominated (detector-on time) | Marked lightcurve |
|---|---|---|---|---|---|---|---|
| A | 7938 | 7938 | 54 | 54 | 0.68% | 0.68% | 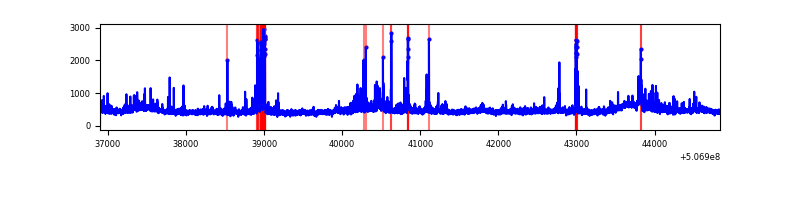 |
| B | 7938 | 7938 | 15 | 15 | 0.19% | 0.19% | 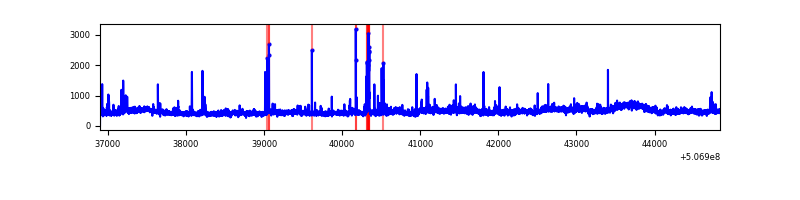 |
| C | 7938 | 7938 | 122 | 122 | 1.54% | 1.54% | 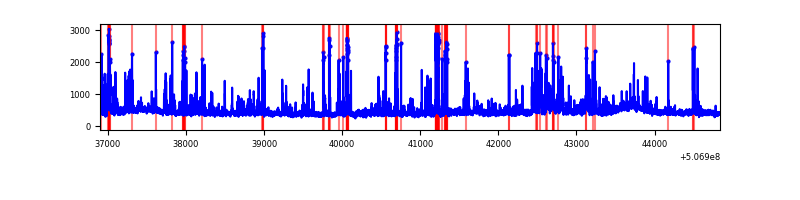 |
| D | 7938 | 7938 | 486 | 486 | 6.12% | 6.12% | 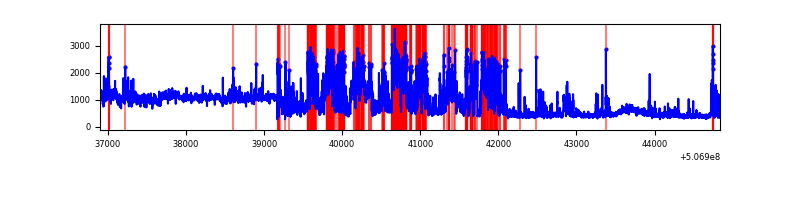 |
Top three noisy pixels from each quadrant. If the there are fewer than three noisy pixels in the level2.evt file, extra rows are filled as -1
| Pixel properties | Quadrant properties | ||||||
|---|---|---|---|---|---|---|---|
| Quadrant | DetID | PixID | Counts | Sigma | Mean | Median | Sigma |
| A | 7 | 64 | 254421 | 1257.89 | 818 | 798 | 201.6 |
| A | 0 | 8 | 200610 | 991.0 | 818 | 798 | 201.6 |
| A | 15 | 32 | 99328 | 488.68 | 818 | 798 | 201.6 |
| B | 0 | 197 | 203941 | 1154.94 | 814 | 782 | 175.9 |
| B | 7 | 0 | 145813 | 824.49 | 814 | 782 | 175.9 |
| B | 0 | 171 | 84080 | 473.54 | 814 | 782 | 175.9 |
| C | 12 | 250 | 437073 | 1987.73 | 797 | 789 | 219.5 |
| C | 12 | 252 | 235756 | 1070.52 | 797 | 789 | 219.5 |
| C | 14 | 96 | 125209 | 566.86 | 797 | 789 | 219.5 |
| D | 2 | 62 | 2743290 | 12378.37 | 783 | 747 | 221.6 |
| D | 11 | 129 | 1158819 | 5226.92 | 783 | 747 | 221.6 |
| D | 3 | 12 | 225464 | 1014.25 | 783 | 747 | 221.6 |
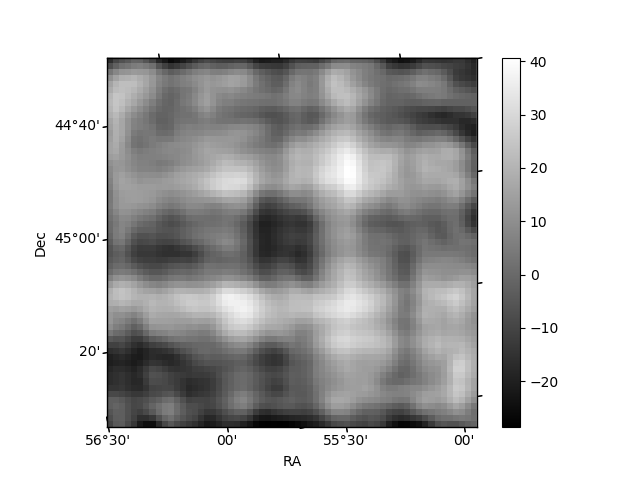
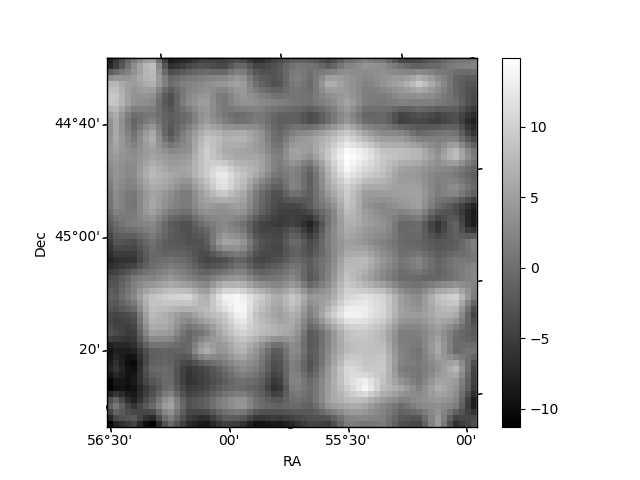
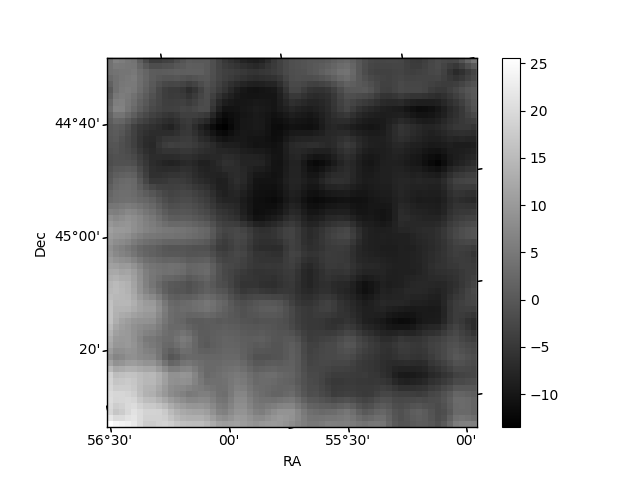
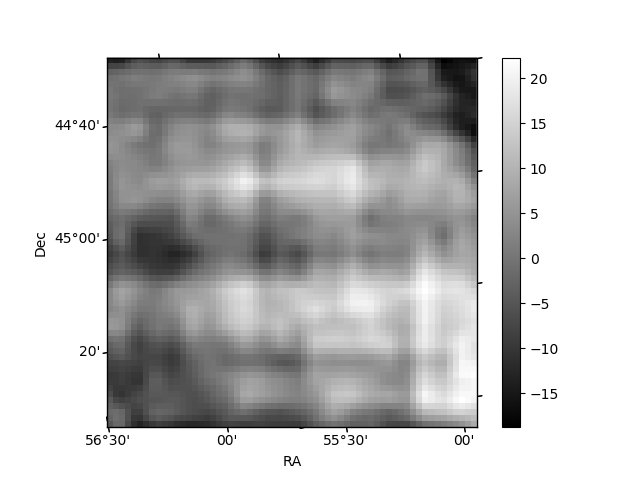
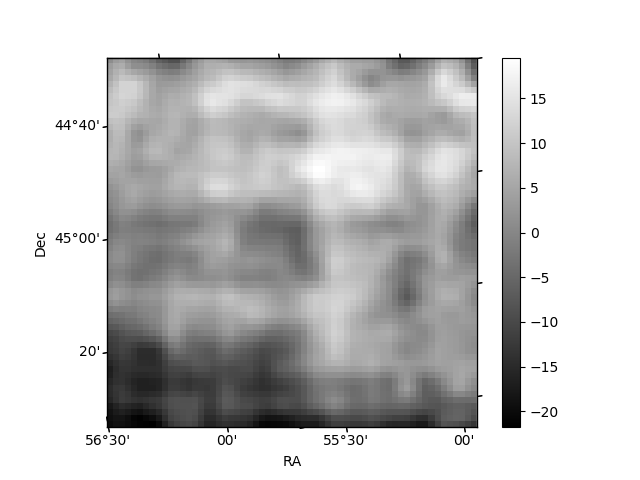
Histogram calculated using DETX and DETY for each event in the final _common_clean file
| Quadrant A | 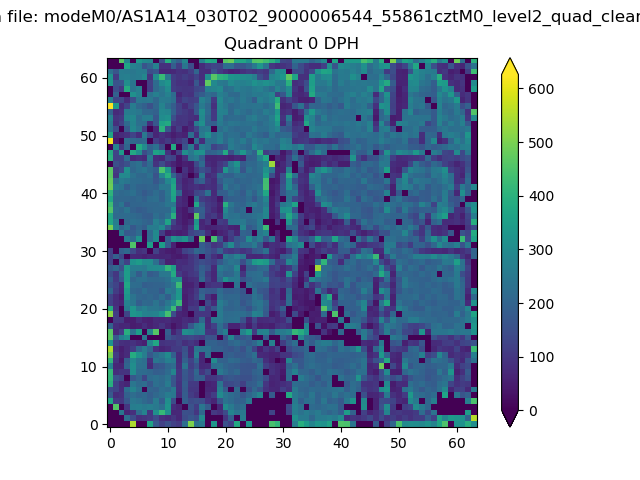 |
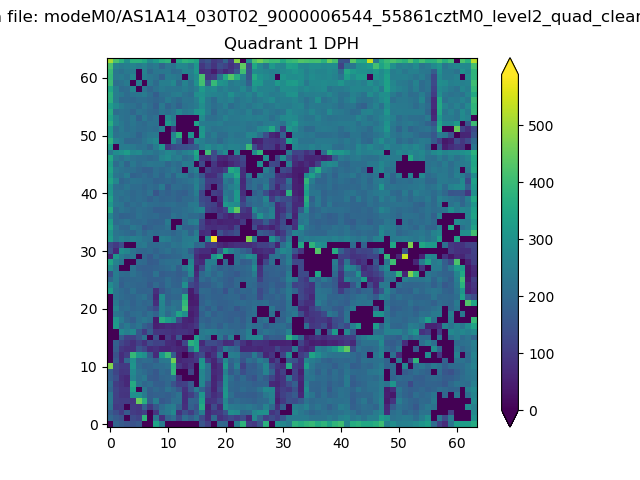 |
Quadrant B |
|---|---|---|---|
| Quadrant D | 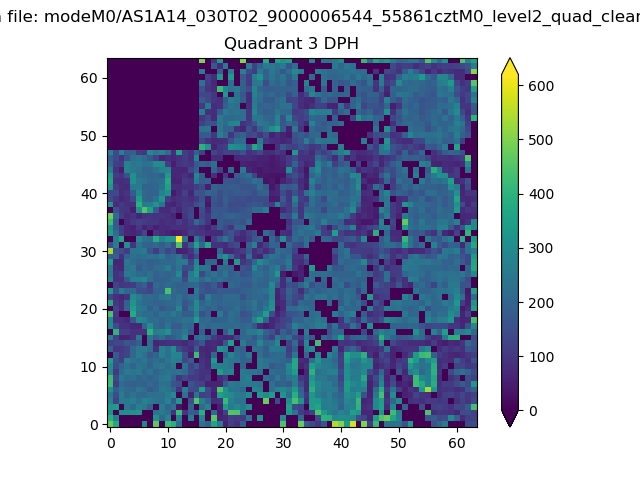 |
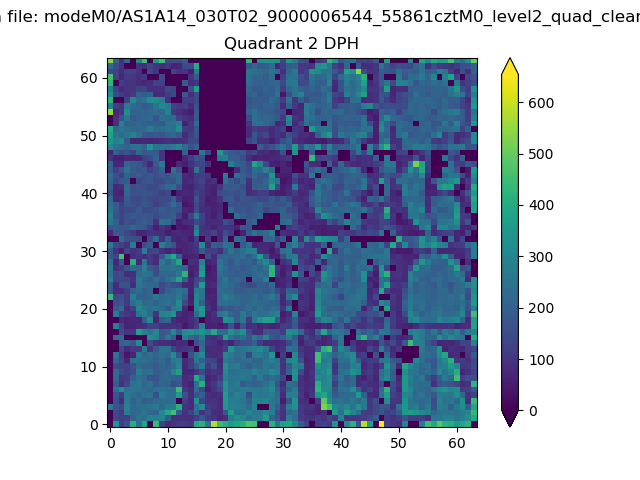 |
Quadrant C |
| Plot type | Count rate plots | Images |
|---|---|---|
| Comparison with Poisson distribution Blue bars denote a histogram of data divided into 1 sec bins. Red curve is a Poisson curve with rate = median count rate of data. |
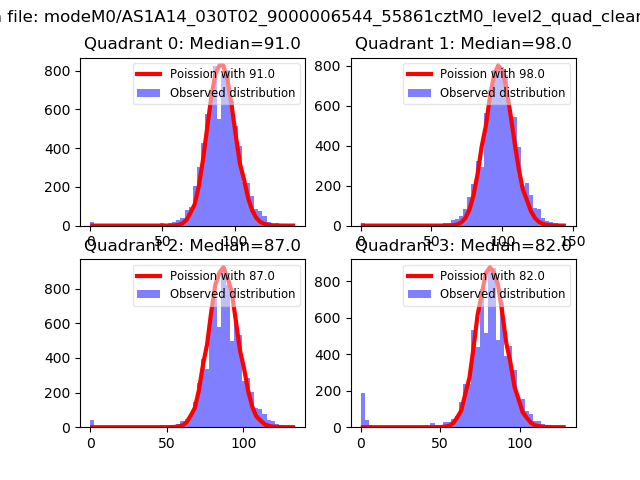 |
 |
| Quadrant-wise count rates Data is divided into 100 sec bins |
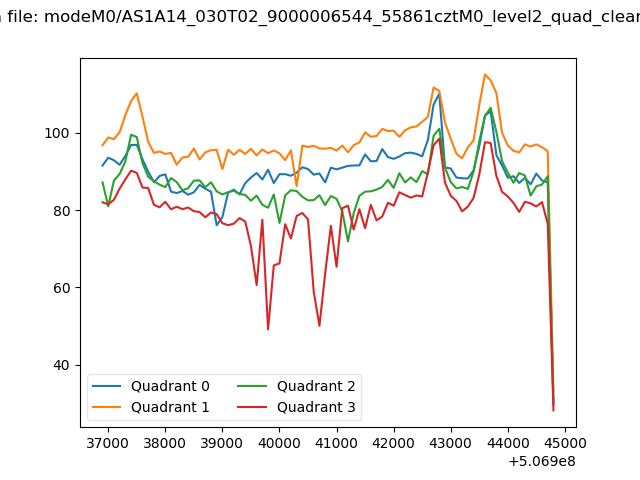 |
|
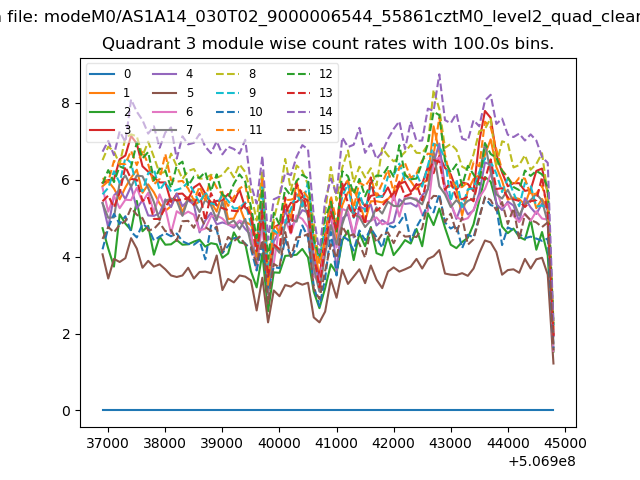
| Module-wise count rates for Quadrant A Data is divided into 100 sec bins |
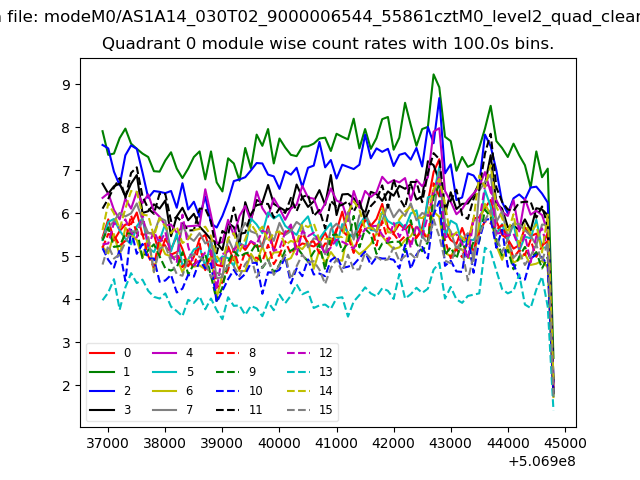 |
 |
| Module-wise count rates for Quadrant B Data is divided into 100 sec bins |
 |
 |
| Module-wise count rates for Quadrant C Data is divided into 100 sec bins |
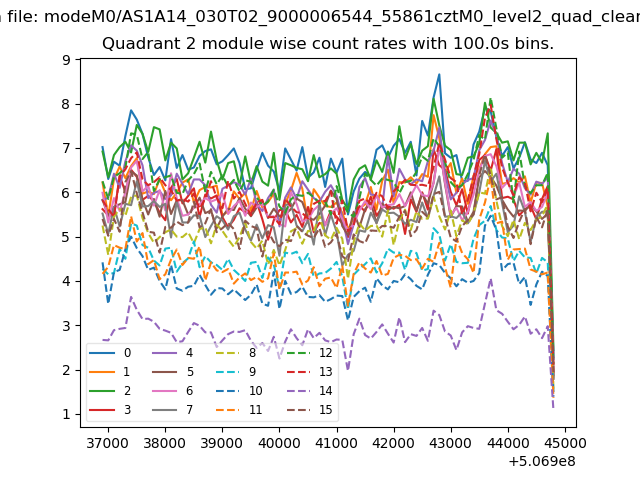 |
 |
| Module-wise count rates for Quadrant D Data is divided into 100 sec bins |
 |
 |
| Parameter | Plot |
|---|---|
| CZT HV Monitor | 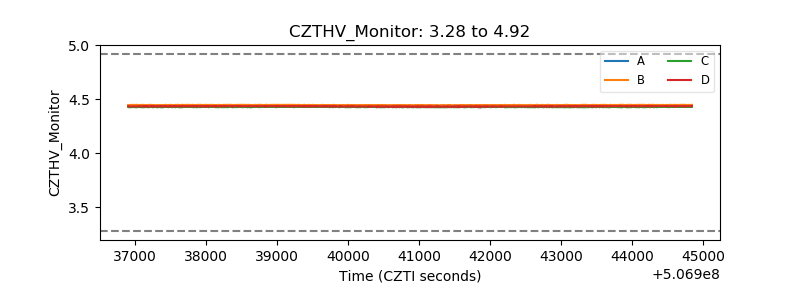 |
| D_VDD | 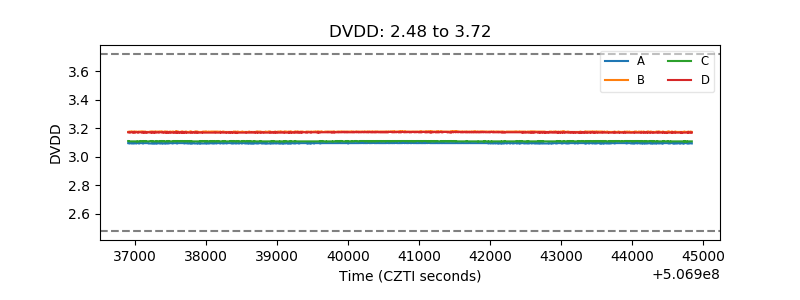 |
| Temperature 1 | 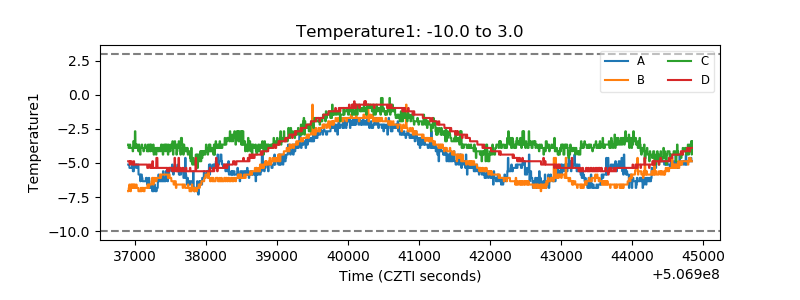 |
| Veto HV Monitor | 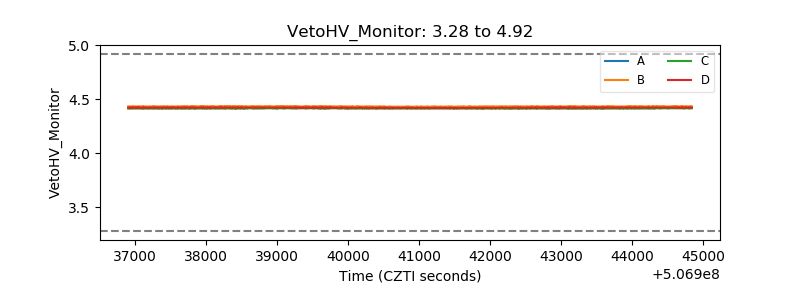 |
| Veto LLD | 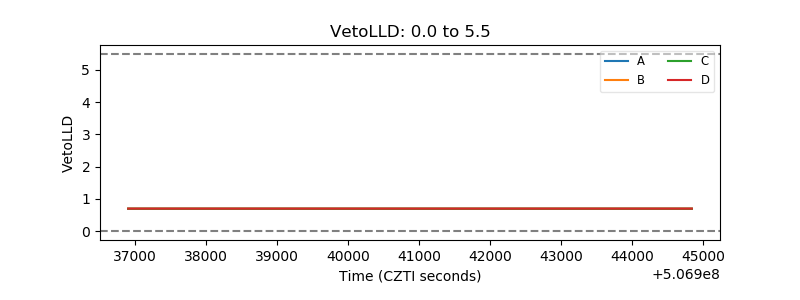 |
| Alpha Counter | 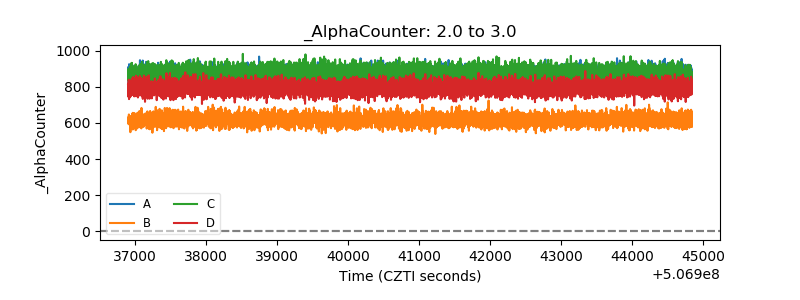 |
| _CPM_Rate | 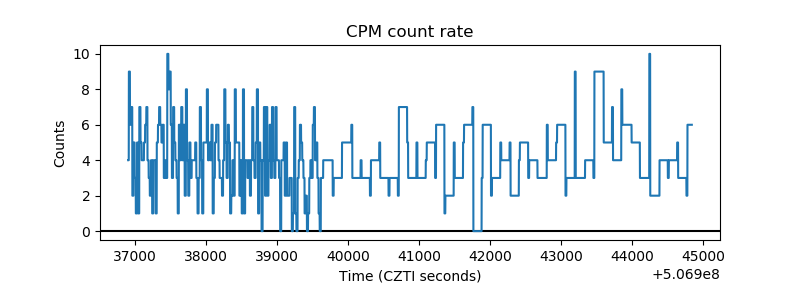 |
| CZT Counter | 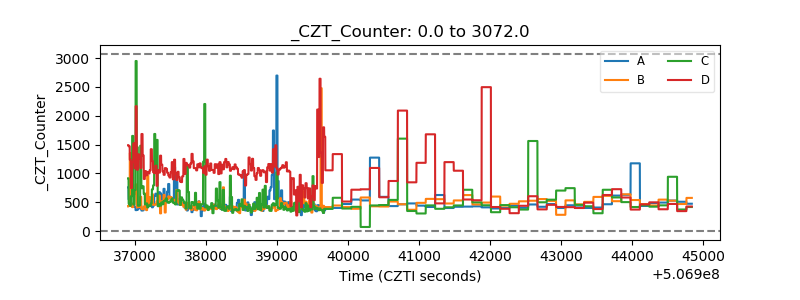 |
| +2.5 Volts monitor |  |
| +5 Volts monitor |  |
| _ROLL_ROT | 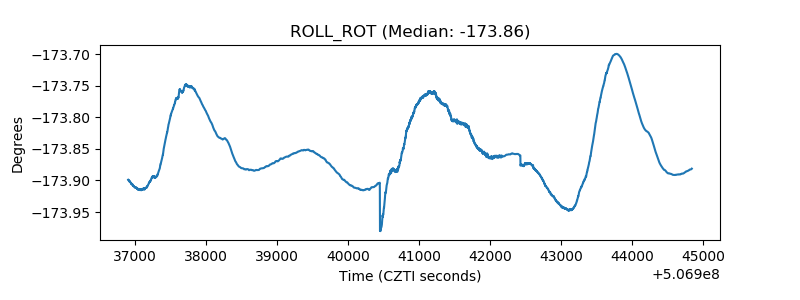 |
| _Roll_DEC | 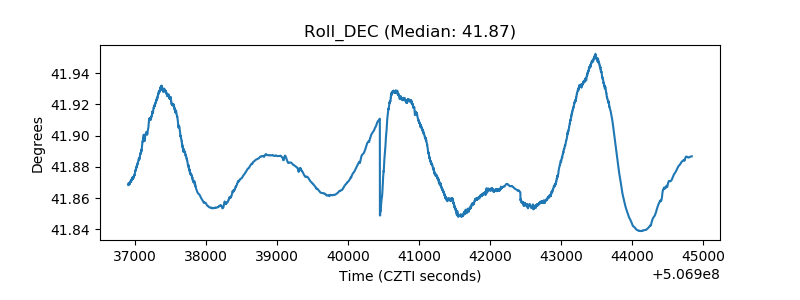 |
| _Roll_RA | 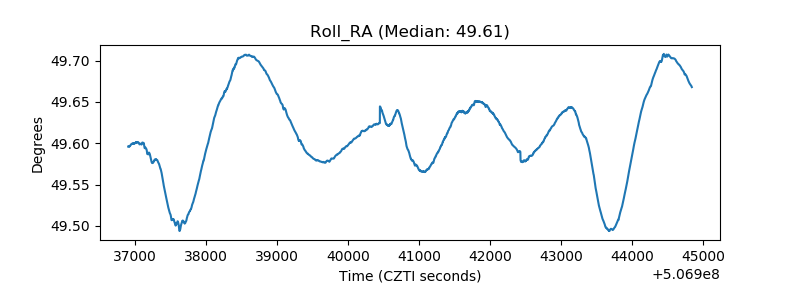 |
| Veto Counter | 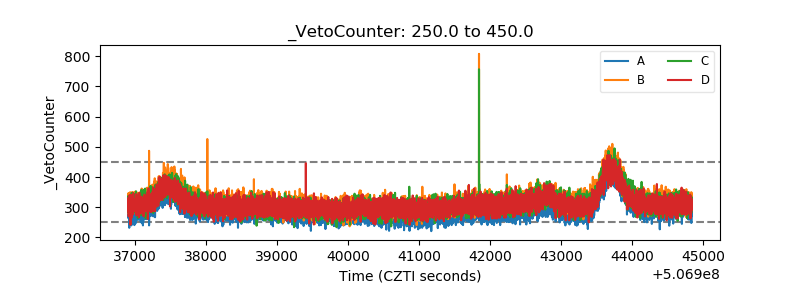 |