| Param | Original file | Final file |
|---|---|---|
| Filename | modeM0/AS1A14_030T02_9000006544_55862cztM0_level2.fits | modeM0/AS1A14_030T02_9000006544_55862cztM0_level2_quad_clean.evt |
| Size (bytes) | 1,306,460,160 | 243,319,680 |
| Size | 1.2 GB | 232.0 MB |
| Events in quadrant A | 11,614,087 | 1,604,284 |
| Events in quadrant B | 10,659,544 | 1,624,281 |
| Events in quadrant C | 14,429,144 | 1,391,533 |
| Events in quadrant D | 10,224,408 | 1,472,286 |
| Mode SS | |||
|---|---|---|---|
| Quadrant | BADHDUFLAG | Total packets | Discarded packets |
| A | 0 | 374 | 0 |
| B | 0 | 374 | 0 |
| C | 0 | 374 | 0 |
| D | 0 | 374 | 0 |
| Mode M9 | |||
|---|---|---|---|
| Quadrant | BADHDUFLAG | Total packets | Discarded packets |
| A | 0 | 12 | 0 |
| B | 0 | 12 | 0 |
| C | 0 | 12 | 0 |
| D | 0 | 12 | 0 |
| Mode M0 | |||
|---|---|---|---|
| Quadrant | BADHDUFLAG | Total packets | Discarded packets |
| A | 0 | 46653 | 3 |
| B | 0 | 45504 | 3 |
| C | 0 | 56730 | 4 |
| D | 0 | 44324 | 3 |
| Quadrant | Total seconds | Saturated seconds | Saturation percentage |
|---|---|---|---|
| A | 18500 | 935 | 5.054054% |
| B | 18500 | 1287 | 6.956757% |
| C | 18500 | 2588 | 13.989189% |
| D | 18500 | 746 | 4.032432% |
Noise dominated data is calculated using 1-second bins in cleaned event files. If a bin has >2000 counts, and if more than 50% of those come from <1% of pixels, then it is considered to be noise-dominated and hence unusable.
| Quadrant | # 1 sec bins | Bins with >0 counts | Bins with >2000 counts | High rate bins dominated by noise | Noise dominated (total time) | Noise dominated (detector-on time) | Marked lightcurve |
|---|---|---|---|---|---|---|---|
| A | 19675 | 18503 | 374 | 374 | 1.90% | 2.02% | 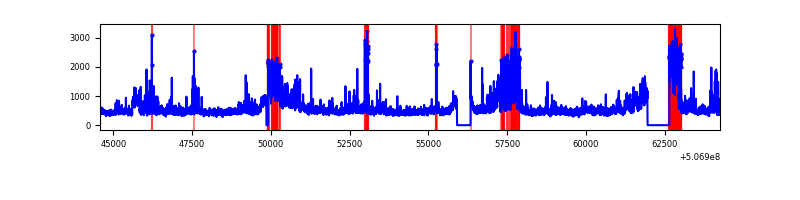 |
| B | 19675 | 18503 | 814 | 814 | 4.14% | 4.40% | 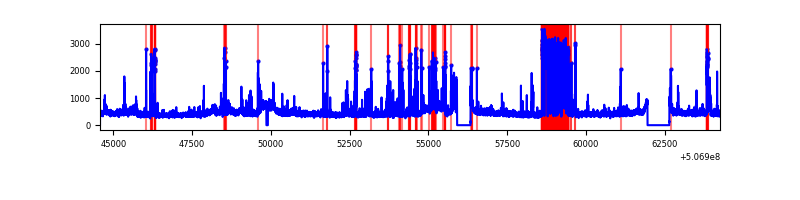 |
| C | 19675 | 18503 | 1882 | 1882 | 9.57% | 10.17% | 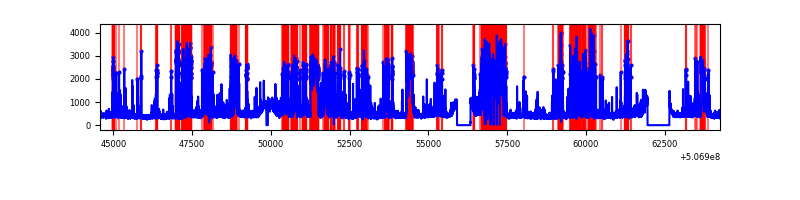 |
| D | 19675 | 18503 | 384 | 384 | 1.95% | 2.08% | 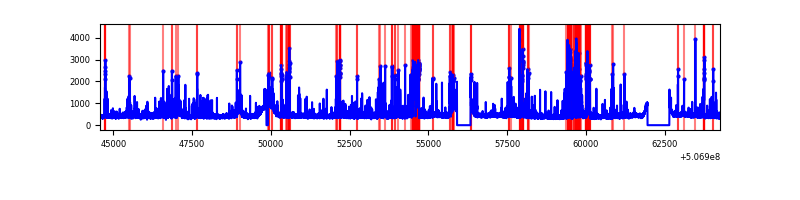 |
Top three noisy pixels from each quadrant. If the there are fewer than three noisy pixels in the level2.evt file, extra rows are filled as -1
| Pixel properties | Quadrant properties | ||||||
|---|---|---|---|---|---|---|---|
| Quadrant | DetID | PixID | Counts | Sigma | Mean | Median | Sigma |
| A | 12 | 115 | 1640031 | 3496.08 | 1901 | 1853 | 468.6 |
| A | 3 | 14 | 1070454 | 2280.53 | 1901 | 1853 | 468.6 |
| A | 7 | 64 | 683795 | 1455.35 | 1901 | 1853 | 468.6 |
| B | 5 | 236 | 2144022 | 5343.5 | 1865 | 1795 | 400.9 |
| B | 0 | 171 | 155924 | 384.45 | 1865 | 1795 | 400.9 |
| B | 5 | 32 | 145493 | 358.43 | 1865 | 1795 | 400.9 |
| C | 15 | 199 | 4558024 | 9539.24 | 1742 | 1727 | 477.6 |
| C | 12 | 254 | 828825 | 1731.65 | 1742 | 1727 | 477.6 |
| C | 13 | 3 | 624569 | 1304.01 | 1742 | 1727 | 477.6 |
| D | 11 | 129 | 1349806 | 2587.78 | 1866 | 1785 | 520.9 |
| D | 3 | 12 | 542960 | 1038.89 | 1866 | 1785 | 520.9 |
| D | 2 | 249 | 351968 | 672.24 | 1866 | 1785 | 520.9 |
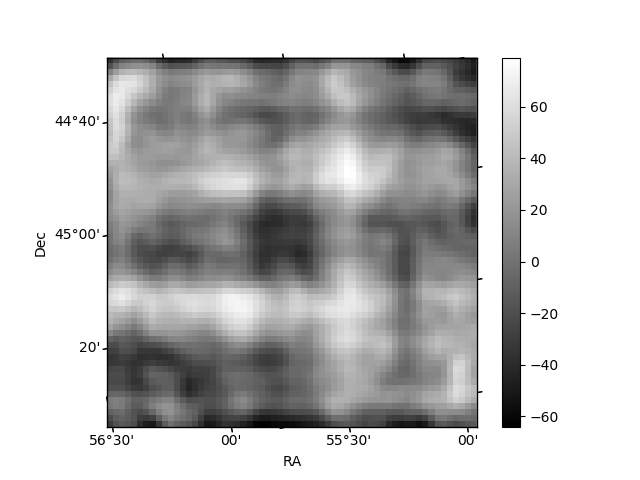
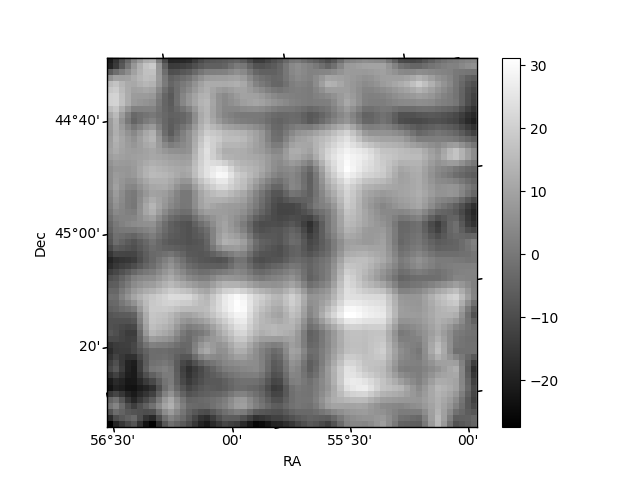
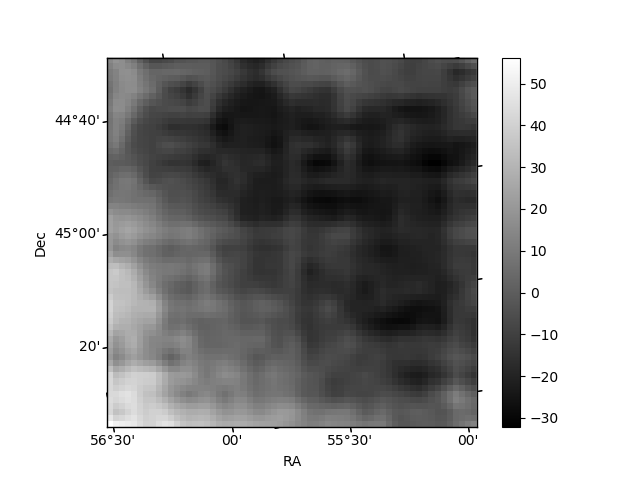
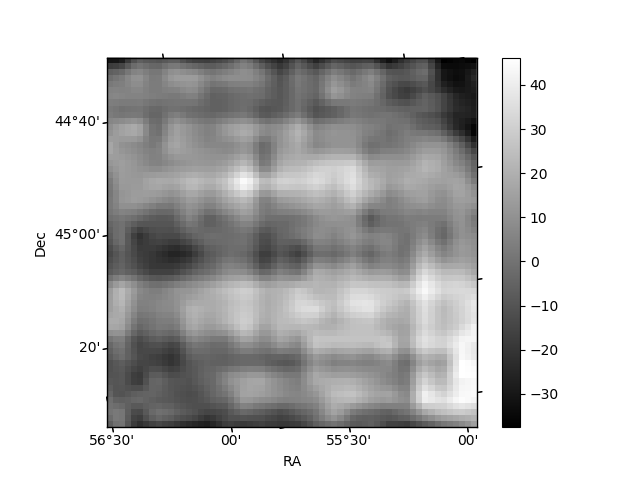
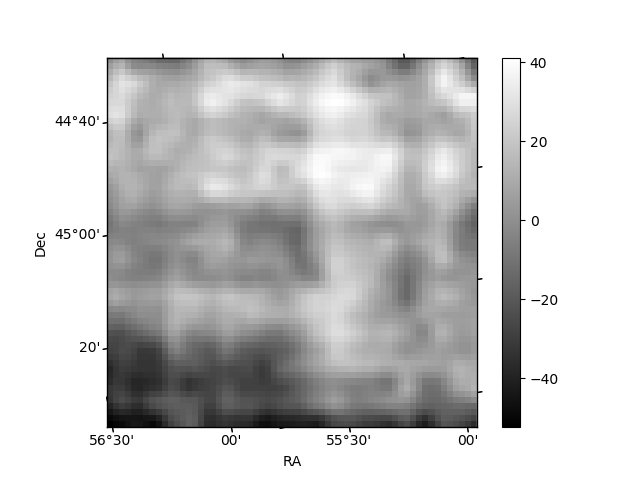
Histogram calculated using DETX and DETY for each event in the final _common_clean file
| Quadrant A | 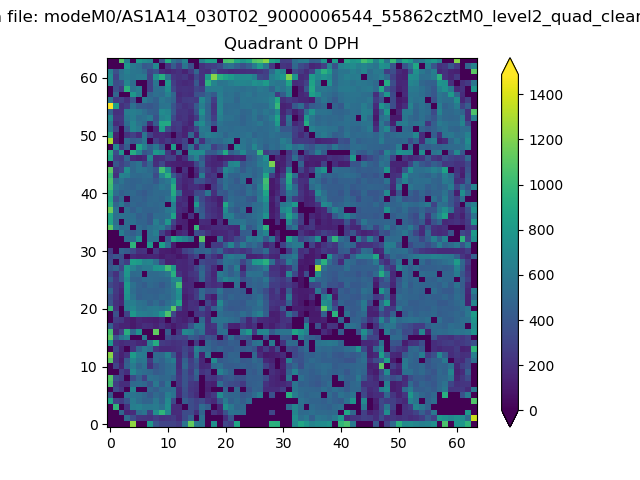 |
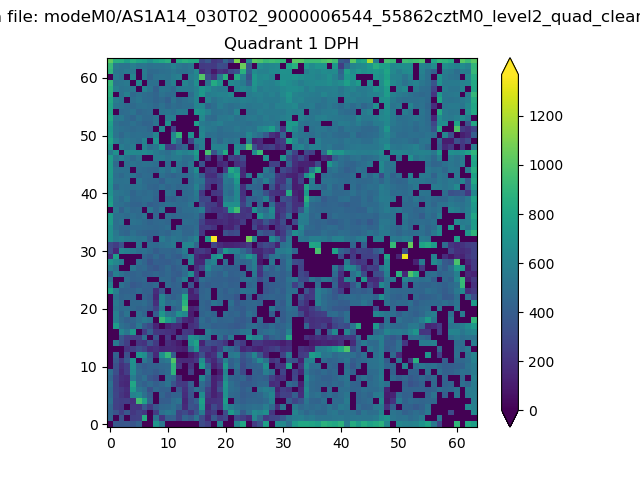 |
Quadrant B |
|---|---|---|---|
| Quadrant D | 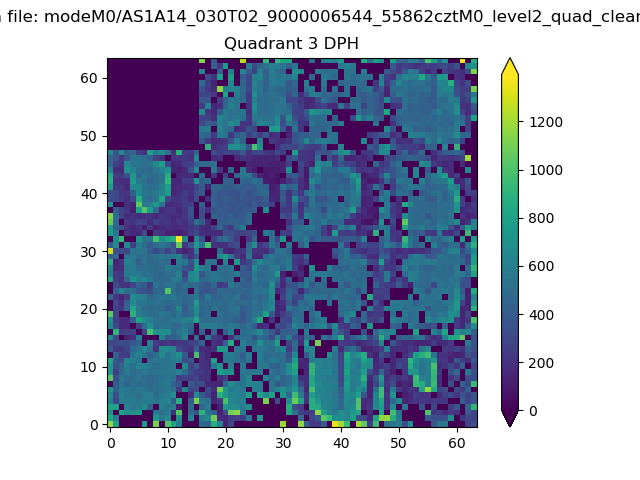 |
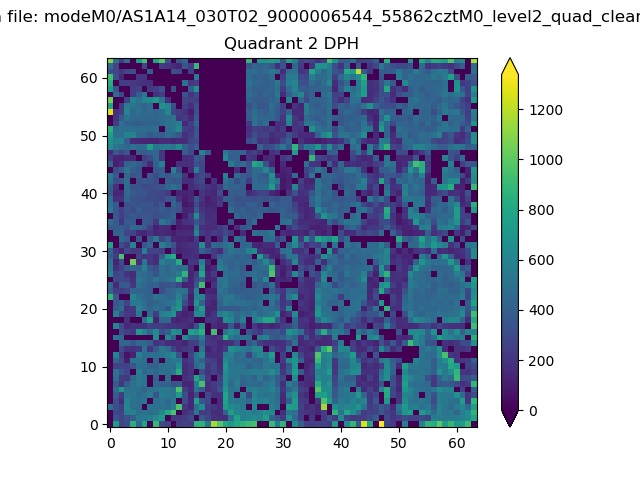 |
Quadrant C |
| Plot type | Count rate plots | Images |
|---|---|---|
| Comparison with Poisson distribution Blue bars denote a histogram of data divided into 1 sec bins. Red curve is a Poisson curve with rate = median count rate of data. |
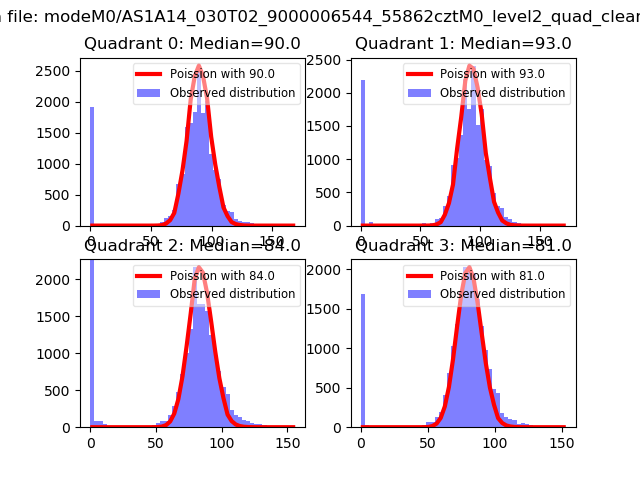 |
 |
| Quadrant-wise count rates Data is divided into 100 sec bins |
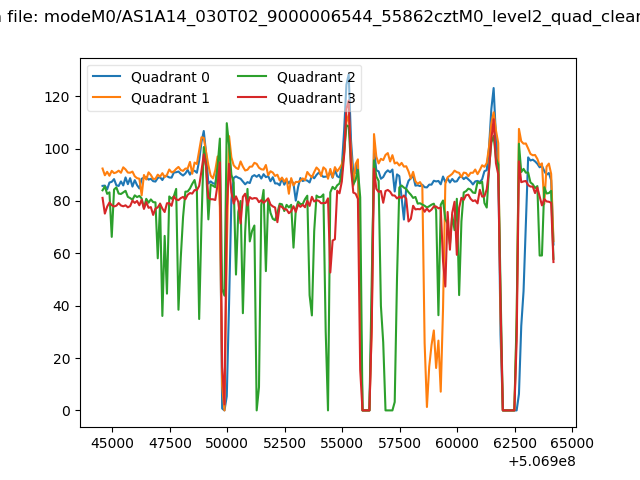 |
|
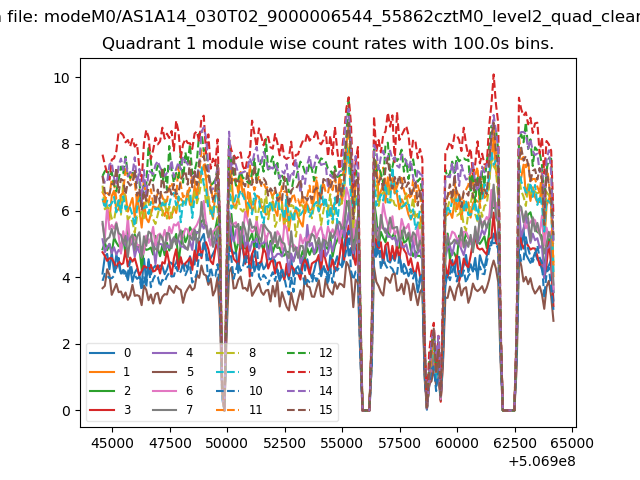
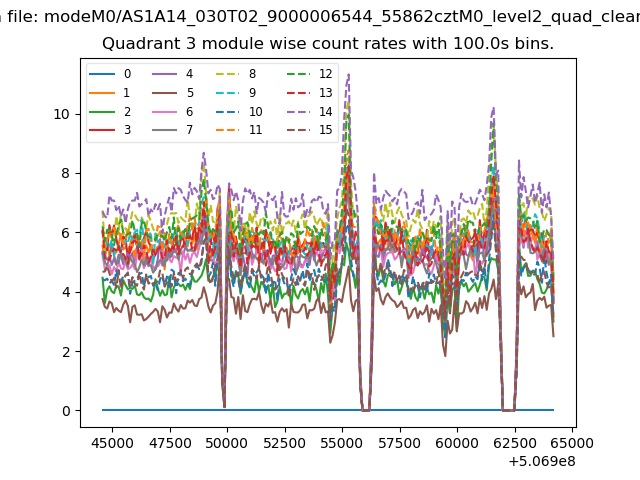
| Module-wise count rates for Quadrant A Data is divided into 100 sec bins |
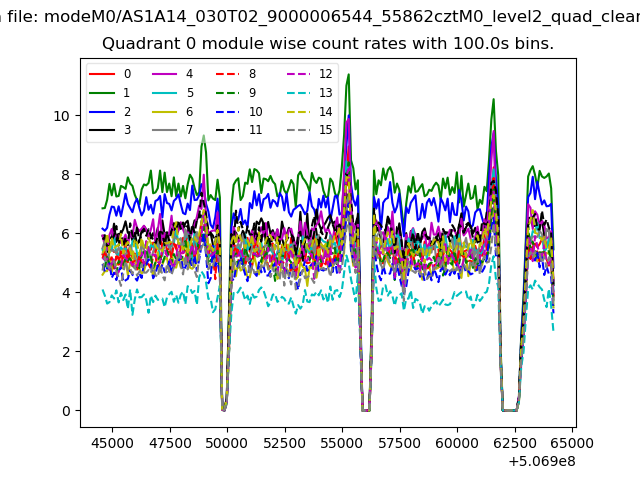 |
 |
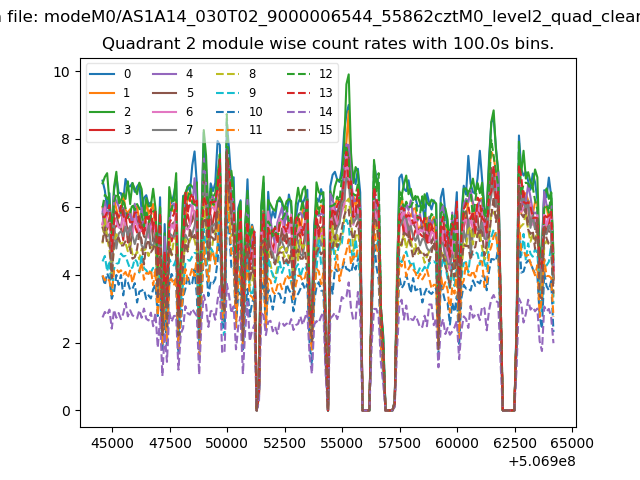
| Module-wise count rates for Quadrant B Data is divided into 100 sec bins |
 |
 |
| Module-wise count rates for Quadrant C Data is divided into 100 sec bins |
 |
 |
| Module-wise count rates for Quadrant D Data is divided into 100 sec bins |
 |
 |
| Parameter | Plot |
|---|---|
| CZT HV Monitor | 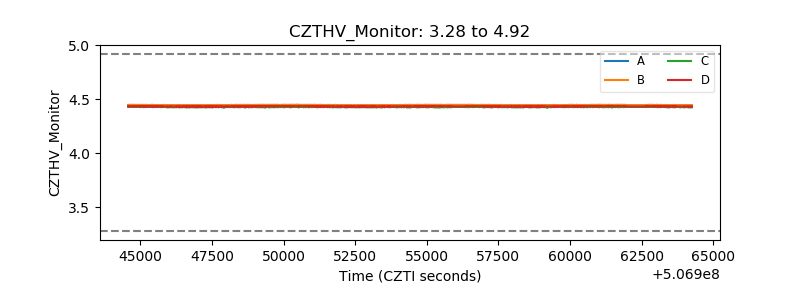 |
| D_VDD | 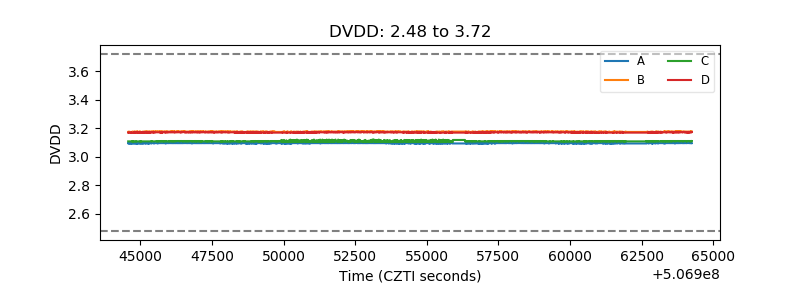 |
| Temperature 1 | 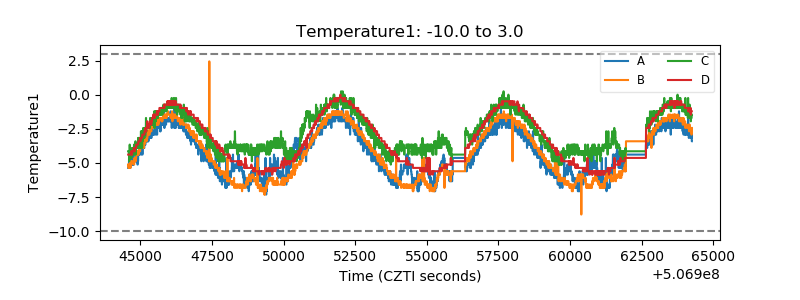 |
| Veto HV Monitor | 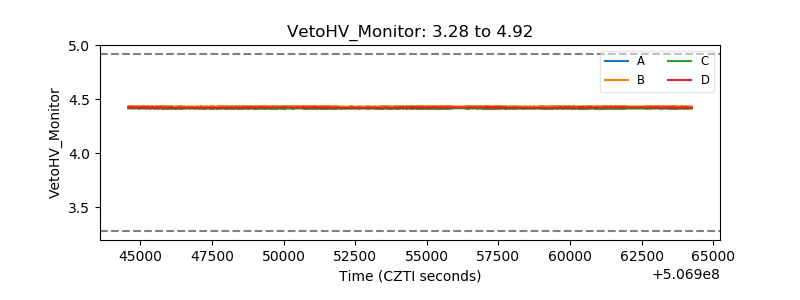 |
| Veto LLD | 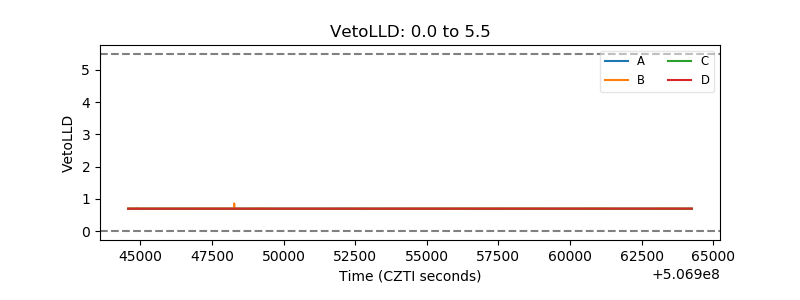 |
| Alpha Counter | 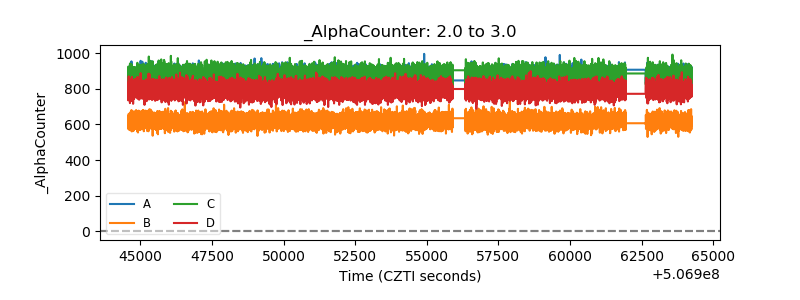 |
| _CPM_Rate | 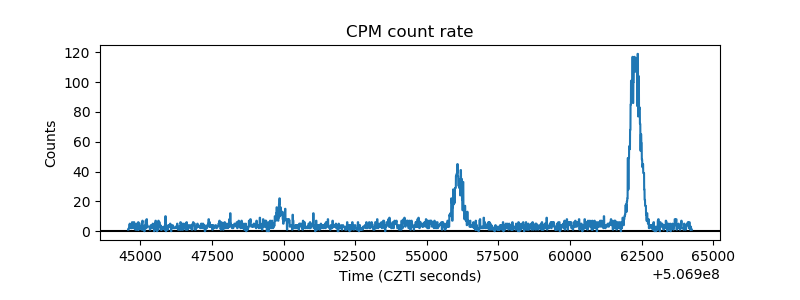 |
| CZT Counter | 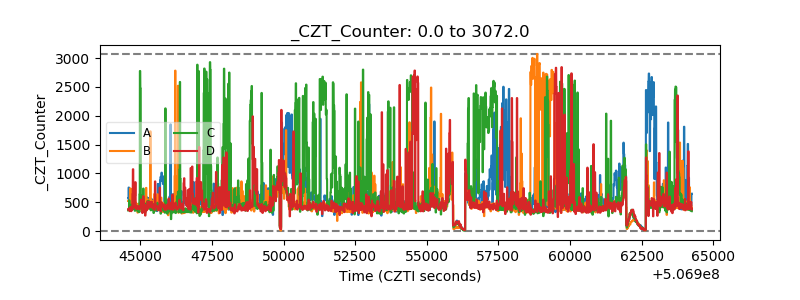 |
| +2.5 Volts monitor |  |
| +5 Volts monitor |  |
| _ROLL_ROT | 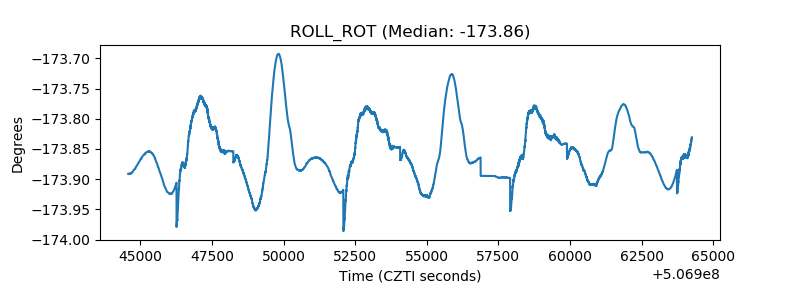 |
| _Roll_DEC | 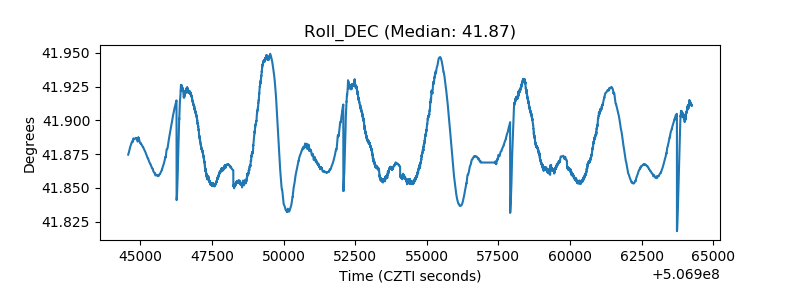 |
| _Roll_RA | 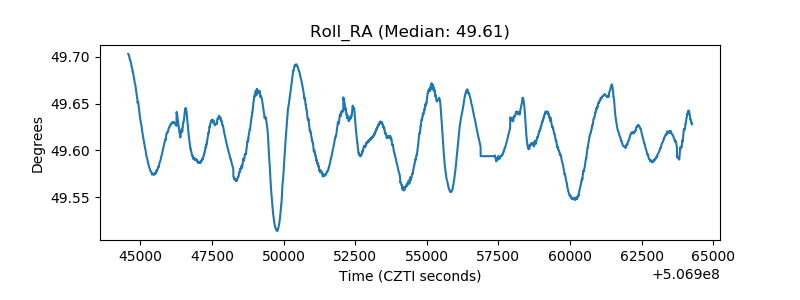 |
| Veto Counter | 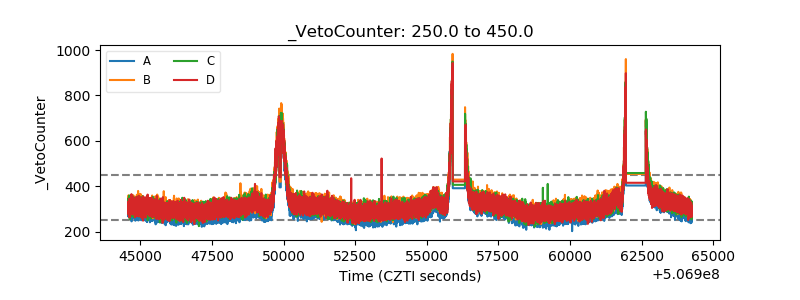 |