| Param | Original file | Final file |
|---|---|---|
| Filename | modeM0/AS1A14_030T02_9000006544_55863cztM0_level2.fits | modeM0/AS1A14_030T02_9000006544_55863cztM0_level2_quad_clean.evt |
| Size (bytes) | 464,486,400 | 85,276,800 |
| Size | 443.0 MB | 81.3 MB |
| Events in quadrant A | 5,931,308 | 492,793 |
| Events in quadrant B | 3,209,725 | 620,147 |
| Events in quadrant C | 4,808,052 | 502,360 |
| Events in quadrant D | 2,753,807 | 526,365 |
| Mode SS | |||
|---|---|---|---|
| Quadrant | BADHDUFLAG | Total packets | Discarded packets |
| A | 0 | 128 | 0 |
| B | 0 | 128 | 0 |
| C | 0 | 128 | 0 |
| D | 0 | 128 | 0 |
| Mode M9 | |||
|---|---|---|---|
| Quadrant | BADHDUFLAG | Total packets | Discarded packets |
| A | 0 | 9 | 0 |
| B | 0 | 9 | 0 |
| C | 0 | 9 | 0 |
| D | 0 | 9 | 0 |
| Mode M0 | |||
|---|---|---|---|
| Quadrant | BADHDUFLAG | Total packets | Discarded packets |
| A | 0 | 21965 | 1 |
| B | 0 | 14086 | 1 |
| C | 0 | 18982 | 1 |
| D | 0 | 13241 | 1 |
| Quadrant | Total seconds | Saturated seconds | Saturation percentage |
|---|---|---|---|
| A | 6309 | 1027 | 16.278333% |
| B | 6309 | 111 | 1.759391% |
| C | 6309 | 649 | 10.286892% |
| D | 6310 | 77 | 1.220285% |
Noise dominated data is calculated using 1-second bins in cleaned event files. If a bin has >2000 counts, and if more than 50% of those come from <1% of pixels, then it is considered to be noise-dominated and hence unusable.
| Quadrant | # 1 sec bins | Bins with >0 counts | Bins with >2000 counts | High rate bins dominated by noise | Noise dominated (total time) | Noise dominated (detector-on time) | Marked lightcurve |
|---|---|---|---|---|---|---|---|
| A | 7199 | 6310 | 910 | 910 | 12.64% | 14.42% | 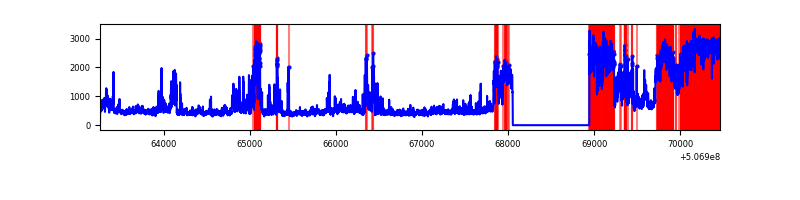 |
| B | 7199 | 6310 | 47 | 47 | 0.65% | 0.74% | 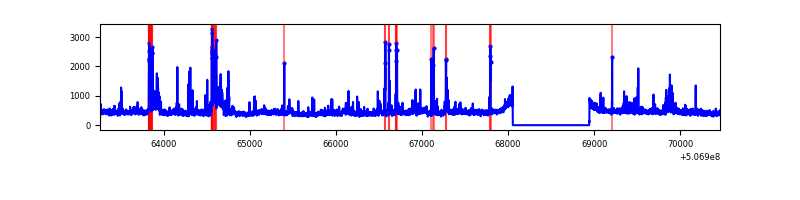 |
| C | 7199 | 6310 | 598 | 598 | 8.31% | 9.48% | 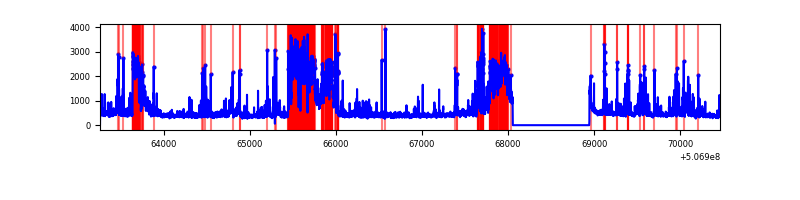 |
| D | 7200 | 6311 | 23 | 23 | 0.32% | 0.36% | 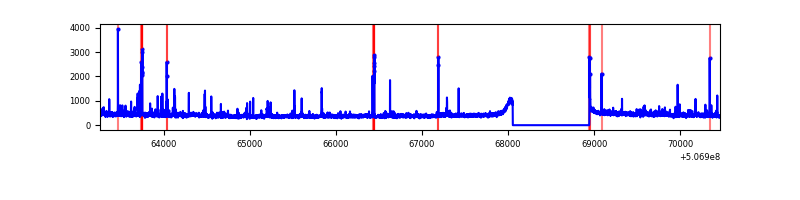 |
Top three noisy pixels from each quadrant. If the there are fewer than three noisy pixels in the level2.evt file, extra rows are filled as -1
| Pixel properties | Quadrant properties | ||||||
|---|---|---|---|---|---|---|---|
| Quadrant | DetID | PixID | Counts | Sigma | Mean | Median | Sigma |
| A | 12 | 115 | 2997648 | 20098.95 | 592 | 578 | 149.1 |
| A | 8 | 192 | 148701 | 993.34 | 592 | 578 | 149.1 |
| A | 7 | 64 | 138978 | 928.14 | 592 | 578 | 149.1 |
| B | 5 | 172 | 243837 | 1784.99 | 633 | 610 | 136.3 |
| B | 5 | 236 | 178430 | 1304.98 | 633 | 610 | 136.3 |
| B | 7 | 252 | 85916 | 626.04 | 633 | 610 | 136.3 |
| C | 15 | 199 | 1446146 | 8739.86 | 599 | 593 | 165.4 |
| C | 15 | 147 | 450239 | 2718.57 | 599 | 593 | 165.4 |
| C | 6 | 223 | 176989 | 1066.5 | 599 | 593 | 165.4 |
| D | 11 | 129 | 79252 | 442.17 | 629 | 601 | 177.9 |
| D | 2 | 153 | 56887 | 316.44 | 629 | 601 | 177.9 |
| D | 5 | 173 | 46495 | 258.01 | 629 | 601 | 177.9 |
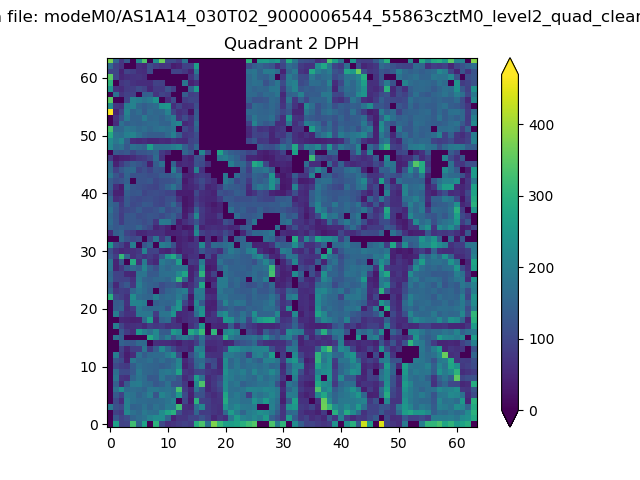
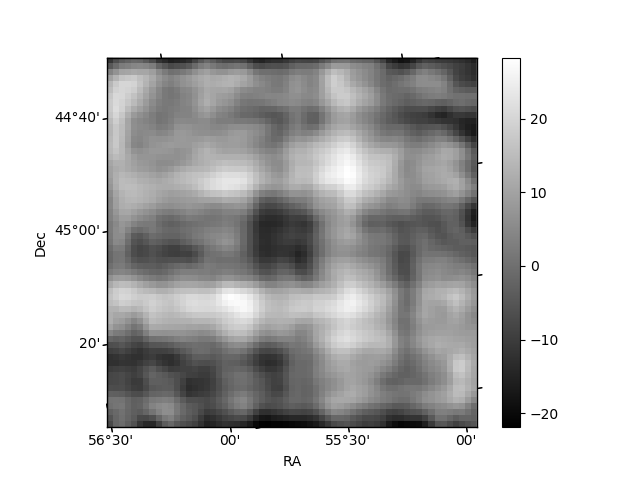
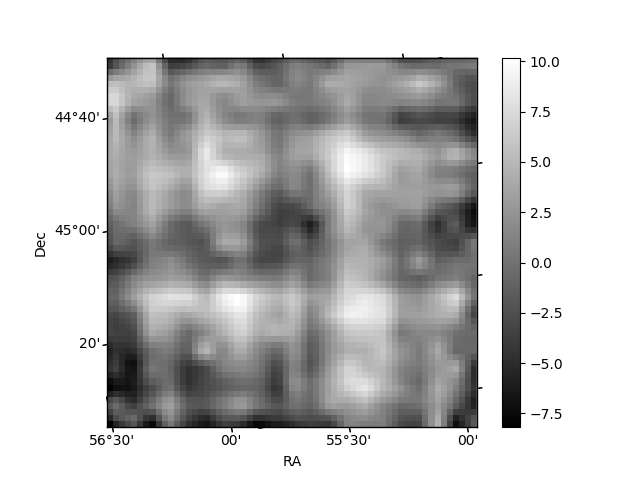
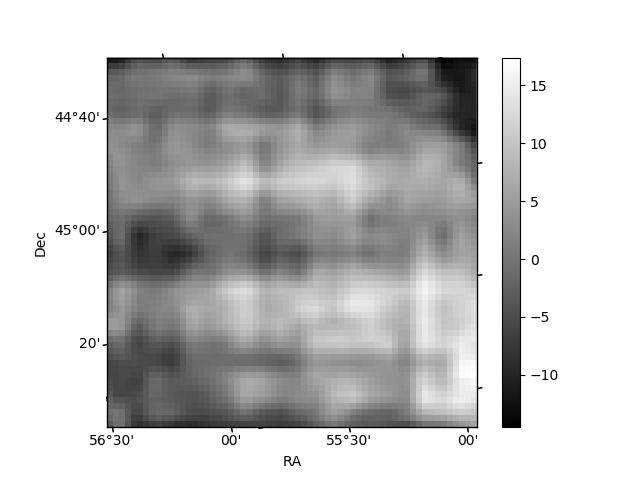
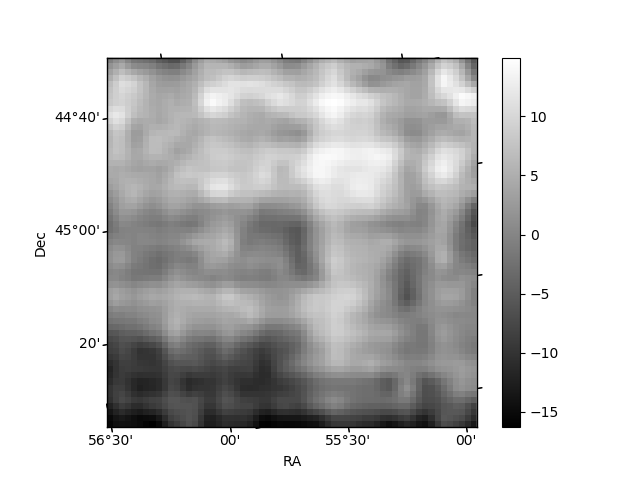
Histogram calculated using DETX and DETY for each event in the final _common_clean file
| Quadrant A | 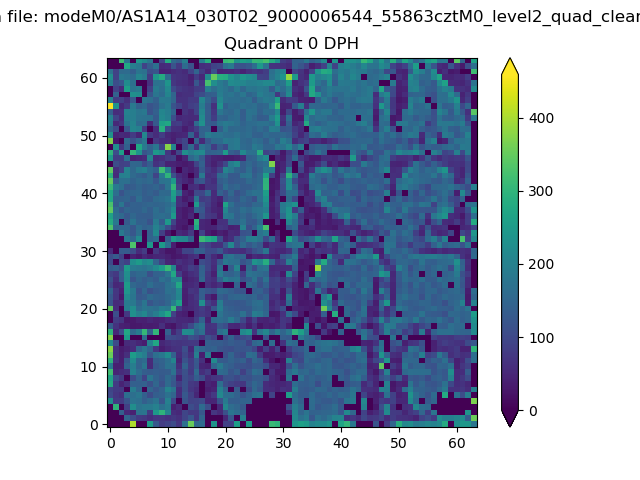 |
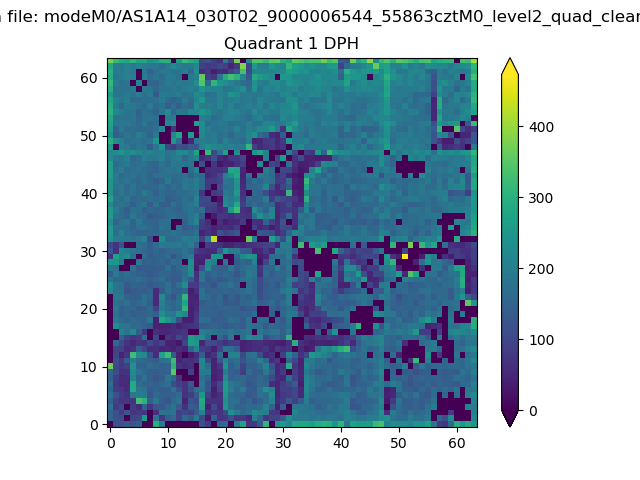 |
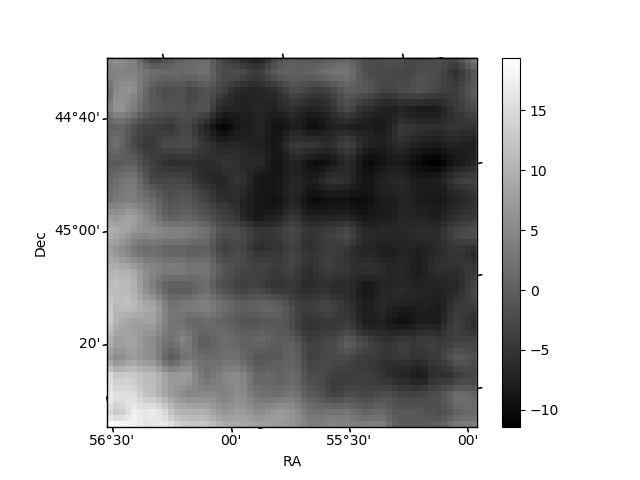
Quadrant B |
|---|---|---|---|
| Quadrant D | 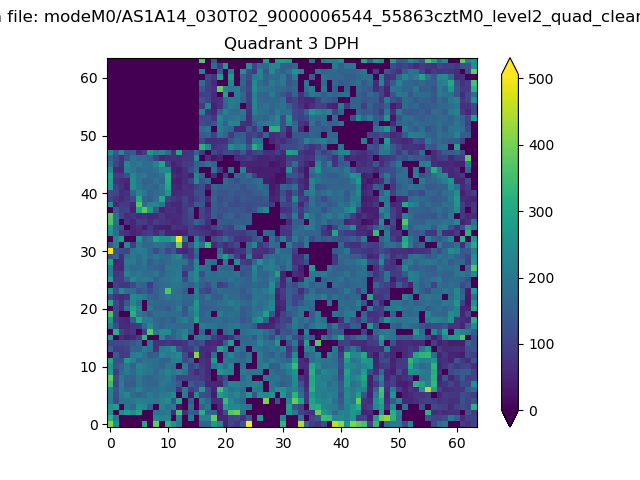 |
 |
Quadrant C |
| Plot type | Count rate plots | Images |
|---|---|---|
| Comparison with Poisson distribution Blue bars denote a histogram of data divided into 1 sec bins. Red curve is a Poisson curve with rate = median count rate of data. |
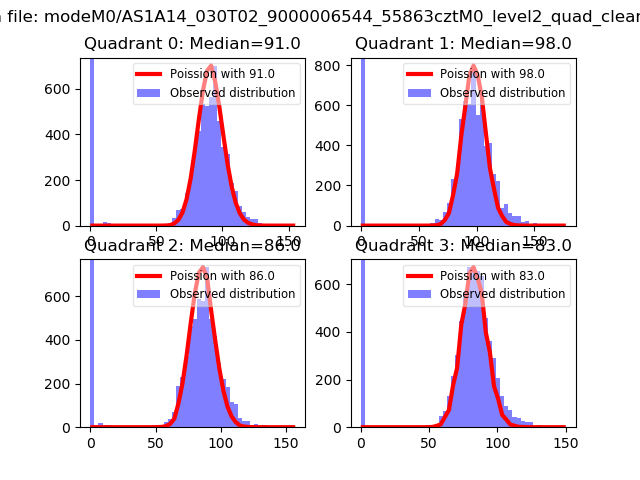 |
 |
| Quadrant-wise count rates Data is divided into 100 sec bins |
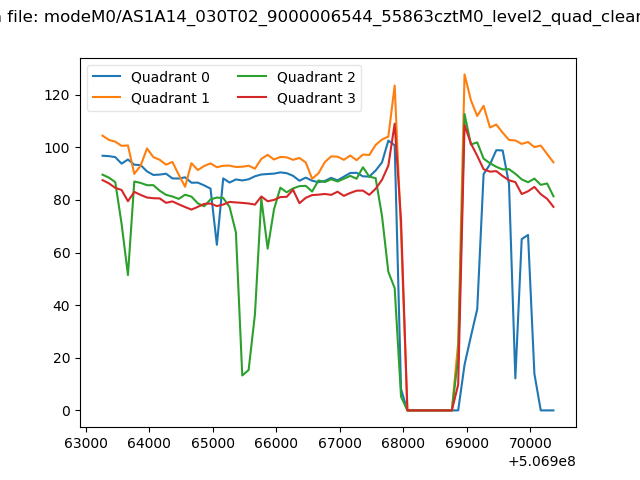 |
|
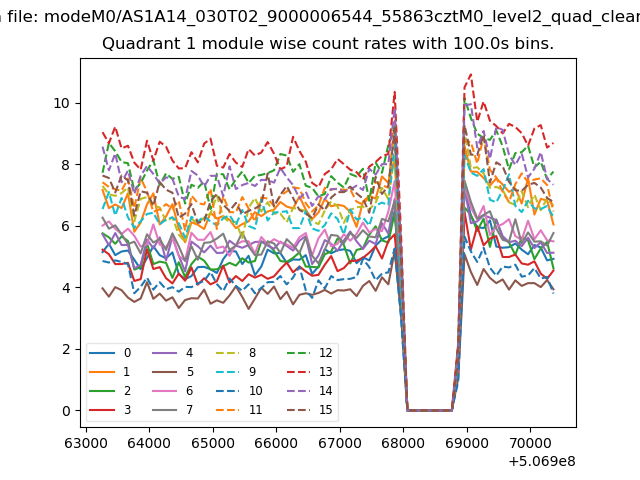
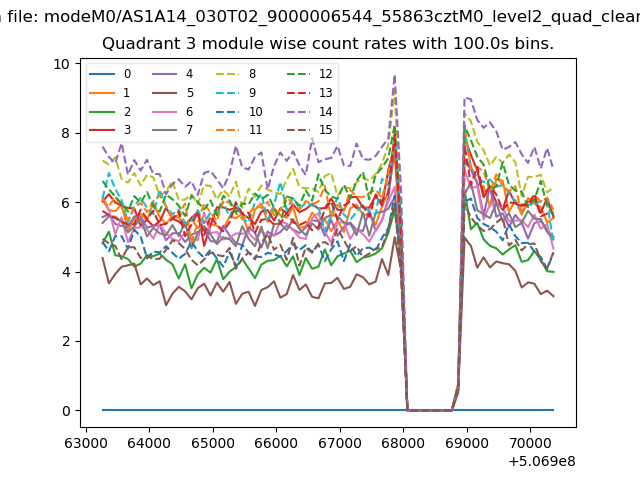
| Module-wise count rates for Quadrant A Data is divided into 100 sec bins |
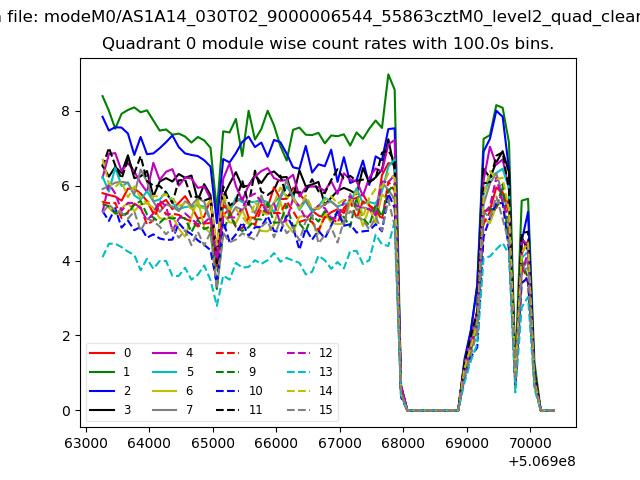 |
 |
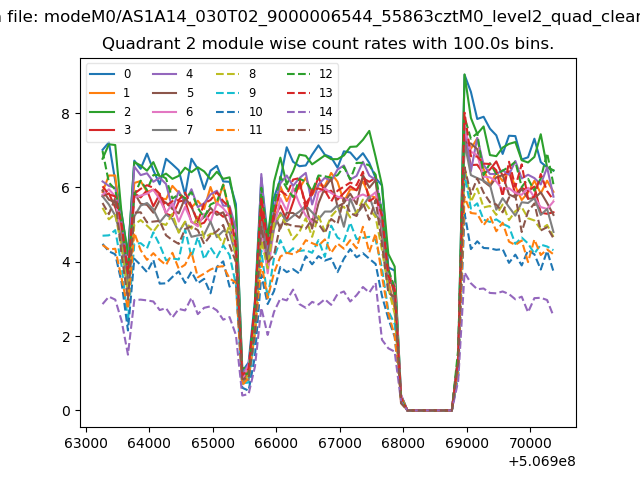
| Module-wise count rates for Quadrant B Data is divided into 100 sec bins |
 |
 |
| Module-wise count rates for Quadrant C Data is divided into 100 sec bins |
 |
 |
| Module-wise count rates for Quadrant D Data is divided into 100 sec bins |
 |
 |
| Parameter | Plot |
|---|---|
| CZT HV Monitor | 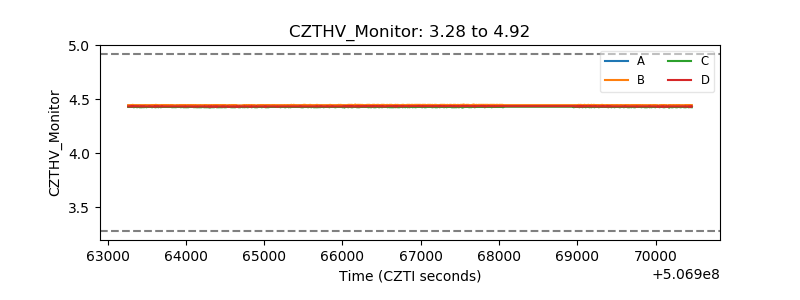 |
| D_VDD | 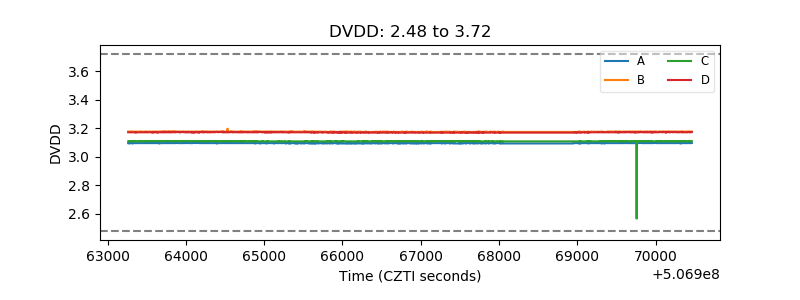 |
| Temperature 1 | 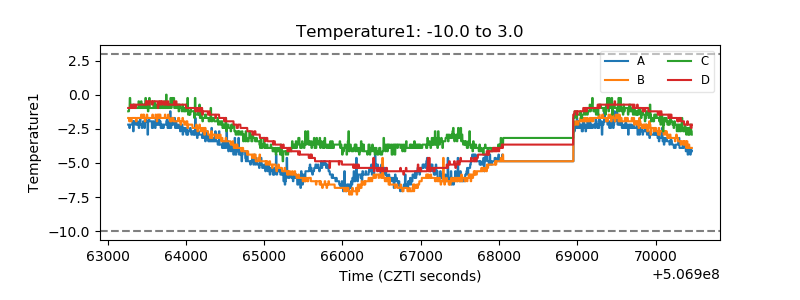 |
| Veto HV Monitor | 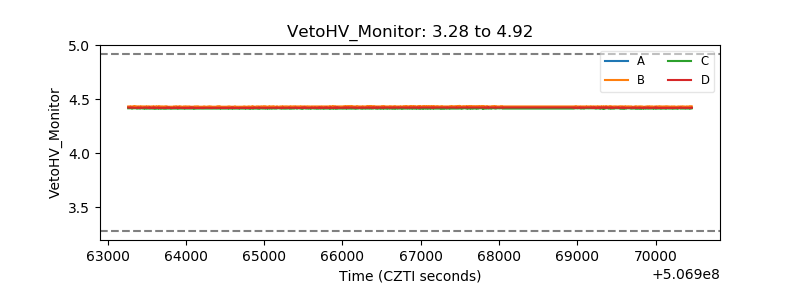 |
| Veto LLD | 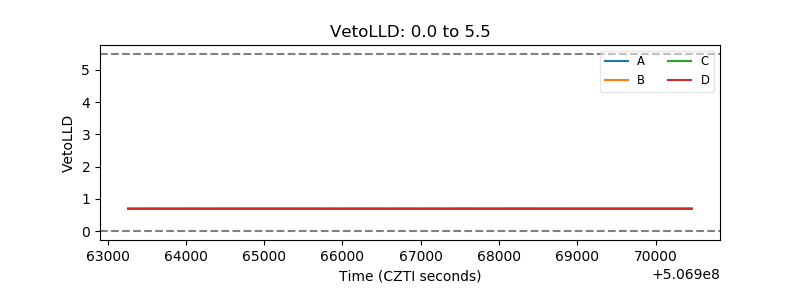 |
| Alpha Counter | 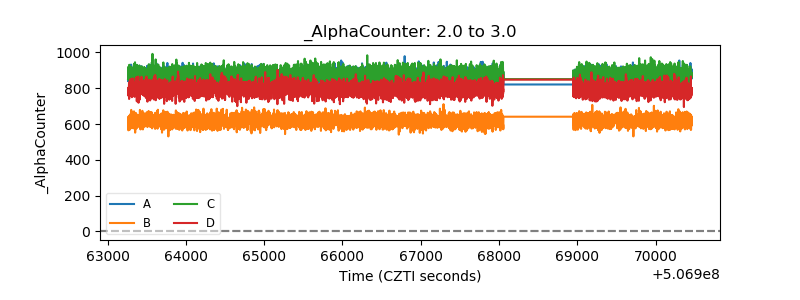 |
| _CPM_Rate | 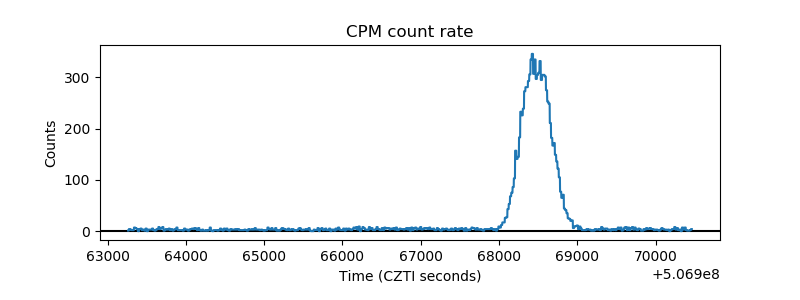 |
| CZT Counter | 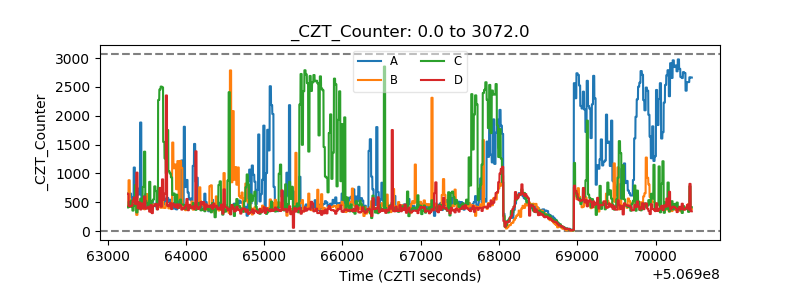 |
| +2.5 Volts monitor |  |
| +5 Volts monitor |  |
| _ROLL_ROT | 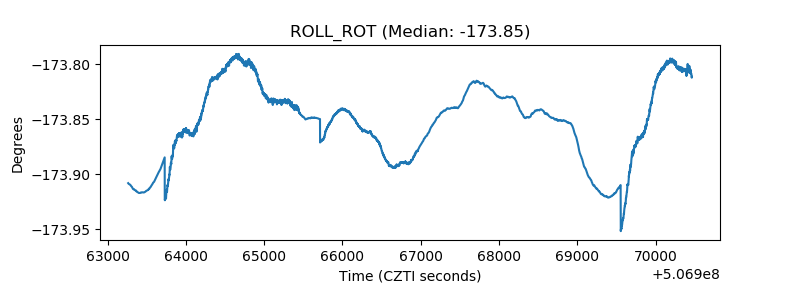 |
| _Roll_DEC | 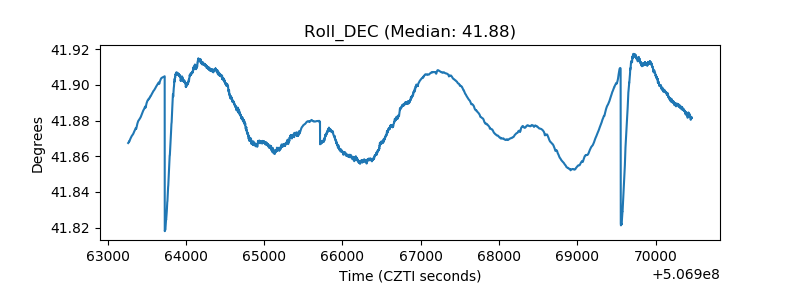 |
| _Roll_RA | 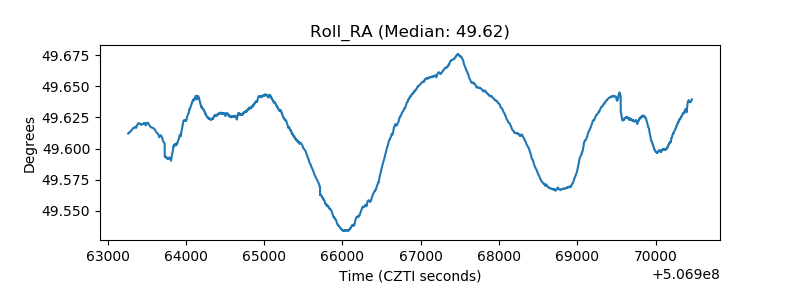 |
| Veto Counter | 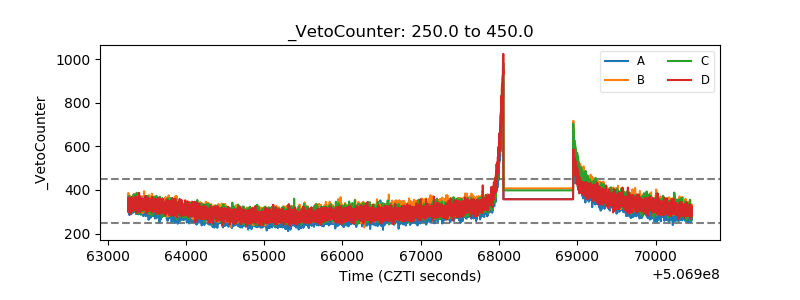 |