| Param | Original file | Final file |
|---|---|---|
| Filename | modeM0/AS1A14_030T02_9000006544_55865cztM0_level2.fits | modeM0/AS1A14_030T02_9000006544_55865cztM0_level2_quad_clean.evt |
| Size (bytes) | 547,024,320 | 91,356,480 |
| Size | 521.7 MB | 87.1 MB |
| Events in quadrant A | 8,502,626 | 478,831 |
| Events in quadrant B | 3,381,918 | 678,857 |
| Events in quadrant C | 3,900,797 | 586,291 |
| Events in quadrant D | 3,944,864 | 556,520 |
| Mode SS | |||
|---|---|---|---|
| Quadrant | BADHDUFLAG | Total packets | Discarded packets |
| A | 0 | 136 | 0 |
| B | 0 | 136 | 0 |
| C | 0 | 136 | 0 |
| D | 0 | 136 | 0 |
| Mode M9 | |||
|---|---|---|---|
| Quadrant | BADHDUFLAG | Total packets | Discarded packets |
| A | 0 | 14 | 0 |
| B | 0 | 14 | 0 |
| C | 0 | 15 | 0 |
| D | 0 | 15 | 0 |
| Mode M0 | |||
|---|---|---|---|
| Quadrant | BADHDUFLAG | Total packets | Discarded packets |
| A | 0 | 29890 | 2 |
| B | 0 | 14810 | 2 |
| C | 0 | 16575 | 2 |
| D | 0 | 16731 | 2 |
| Quadrant | Total seconds | Saturated seconds | Saturation percentage |
|---|---|---|---|
| A | 6680 | 1759 | 26.332335% |
| B | 6680 | 67 | 1.002994% |
| C | 6680 | 229 | 3.428144% |
| D | 6680 | 269 | 4.026946% |
Noise dominated data is calculated using 1-second bins in cleaned event files. If a bin has >2000 counts, and if more than 50% of those come from <1% of pixels, then it is considered to be noise-dominated and hence unusable.
| Quadrant | # 1 sec bins | Bins with >0 counts | Bins with >2000 counts | High rate bins dominated by noise | Noise dominated (total time) | Noise dominated (detector-on time) | Marked lightcurve |
|---|---|---|---|---|---|---|---|
| A | 7740 | 6681 | 1747 | 1747 | 22.57% | 26.15% | 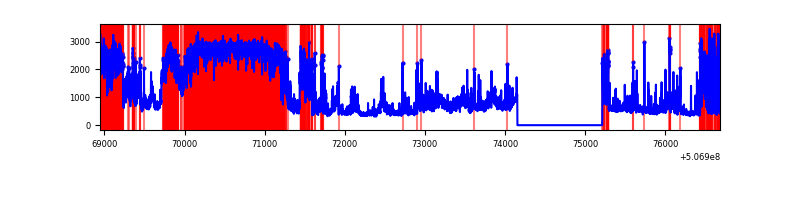 |
| B | 7740 | 6681 | 31 | 31 | 0.40% | 0.46% | 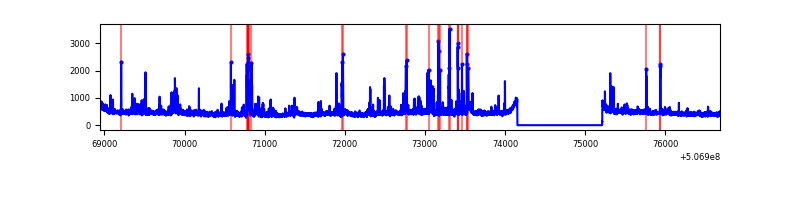 |
| C | 7740 | 6681 | 186 | 186 | 2.40% | 2.78% | 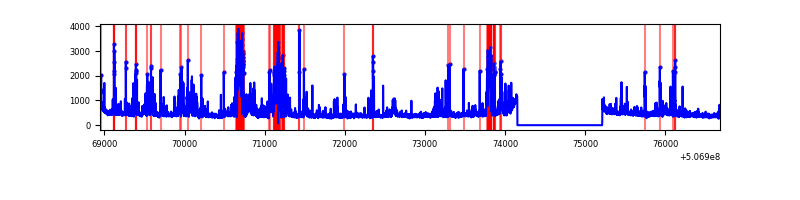 |
| D | 7740 | 6681 | 224 | 224 | 2.89% | 3.35% | 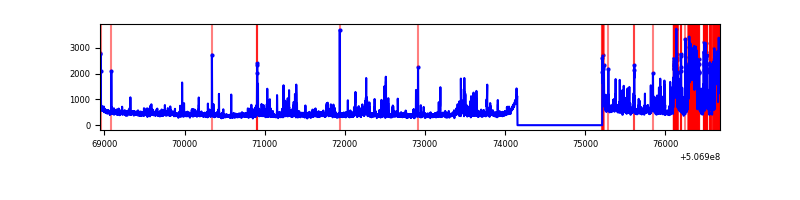 |
Top three noisy pixels from each quadrant. If the there are fewer than three noisy pixels in the level2.evt file, extra rows are filled as -1
| Pixel properties | Quadrant properties | ||||||
|---|---|---|---|---|---|---|---|
| Quadrant | DetID | PixID | Counts | Sigma | Mean | Median | Sigma |
| A | 12 | 115 | 5056986 | 33471.02 | 608 | 593 | 151.1 |
| A | 4 | 249 | 398900 | 2636.61 | 608 | 593 | 151.1 |
| A | 7 | 64 | 162551 | 1072.09 | 608 | 593 | 151.1 |
| B | 4 | 169 | 181210 | 1220.3 | 683 | 655 | 148.0 |
| B | 4 | 21 | 168049 | 1131.35 | 683 | 655 | 148.0 |
| B | 0 | 197 | 79345 | 531.83 | 683 | 655 | 148.0 |
| C | 15 | 199 | 413213 | 2248.07 | 666 | 660 | 183.5 |
| C | 12 | 254 | 205591 | 1116.7 | 666 | 660 | 183.5 |
| C | 6 | 223 | 197652 | 1073.44 | 666 | 660 | 183.5 |
| D | 11 | 129 | 877478 | 4672.36 | 665 | 636 | 187.7 |
| D | 2 | 62 | 99413 | 526.35 | 665 | 636 | 187.7 |
| D | 4 | 160 | 90528 | 479.0 | 665 | 636 | 187.7 |
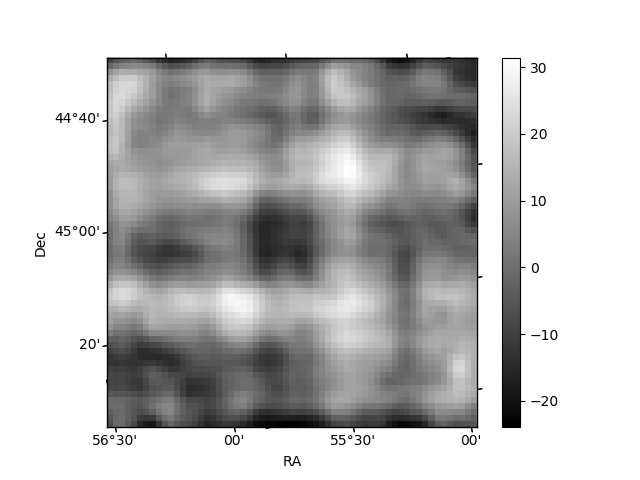
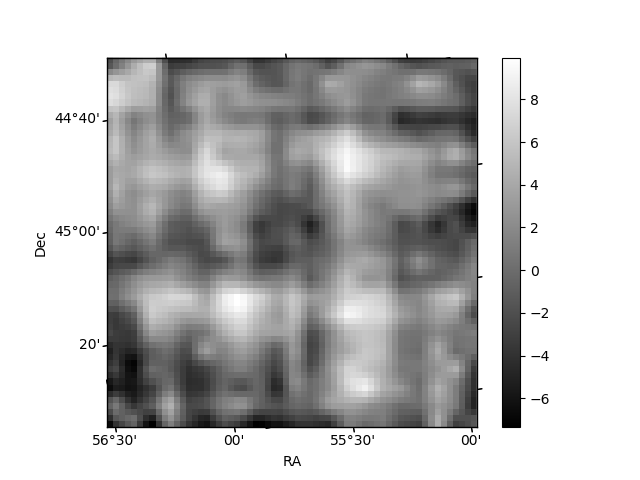
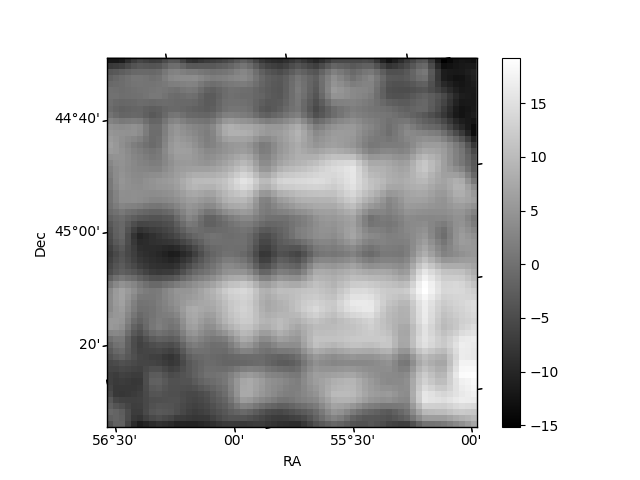
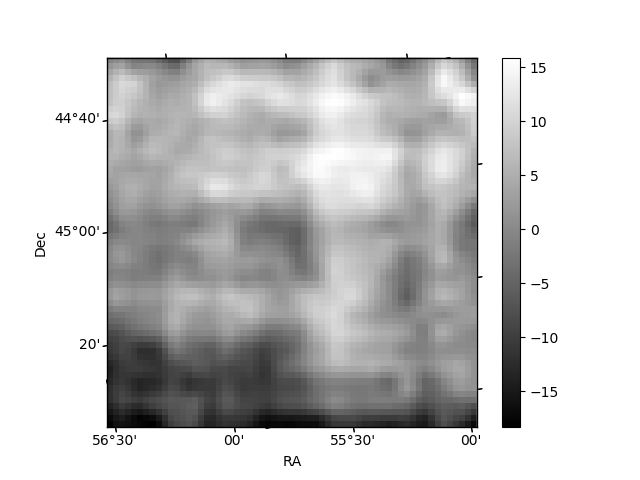
Histogram calculated using DETX and DETY for each event in the final _common_clean file
| Quadrant A | 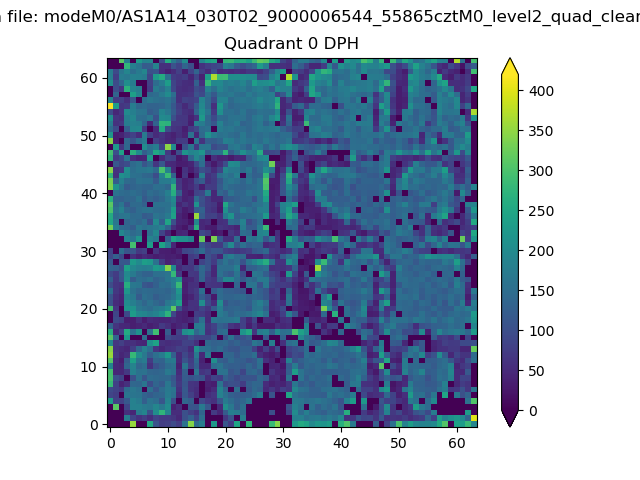 |
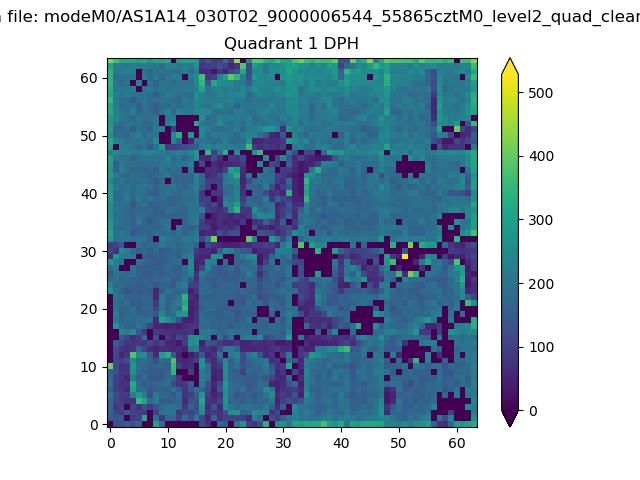 |
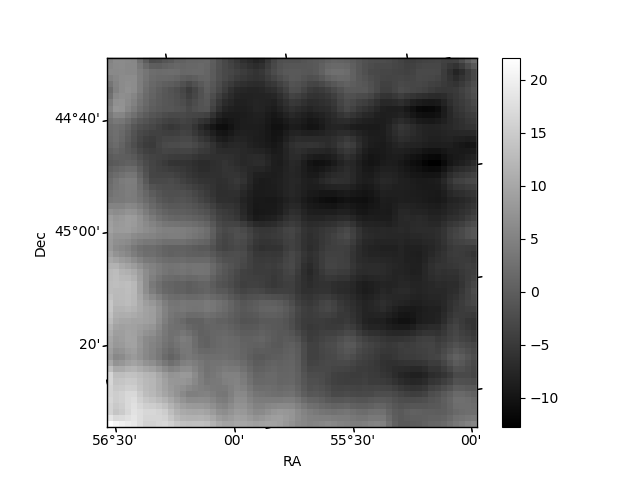
Quadrant B |
|---|---|---|---|
| Quadrant D | 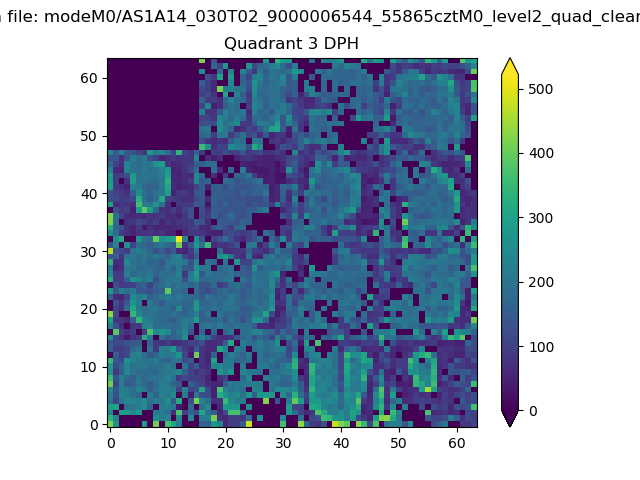 |
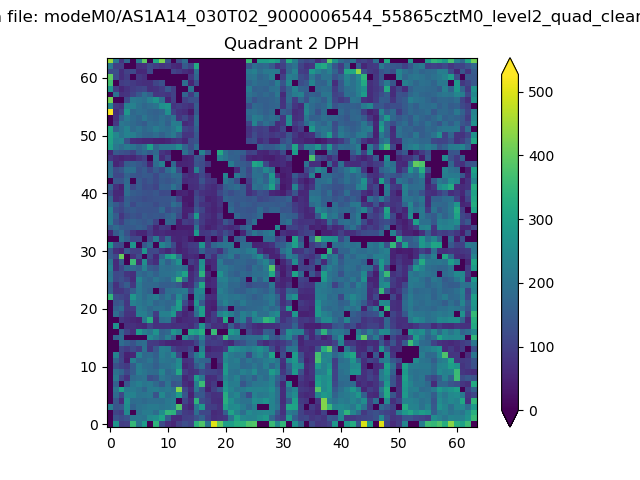 |
Quadrant C |
| Plot type | Count rate plots | Images |
|---|---|---|
| Comparison with Poisson distribution Blue bars denote a histogram of data divided into 1 sec bins. Red curve is a Poisson curve with rate = median count rate of data. |
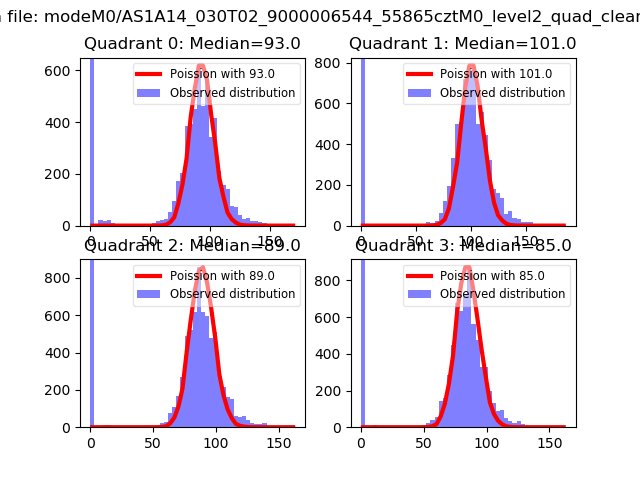 |
 |
| Quadrant-wise count rates Data is divided into 100 sec bins |
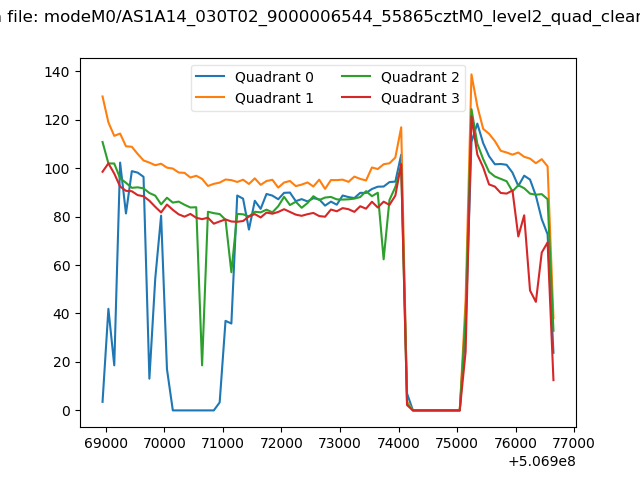 |
|
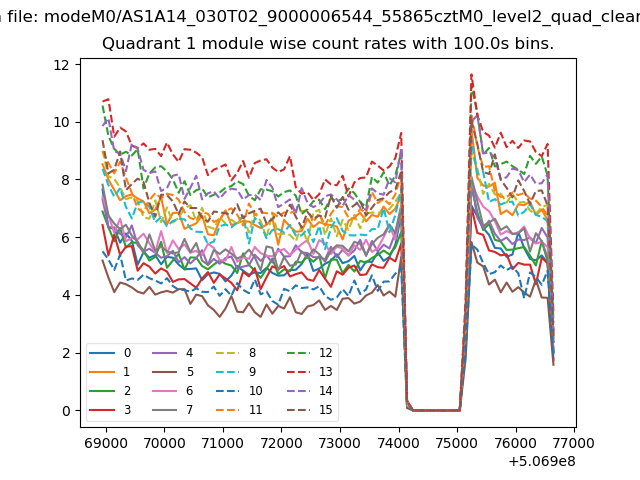
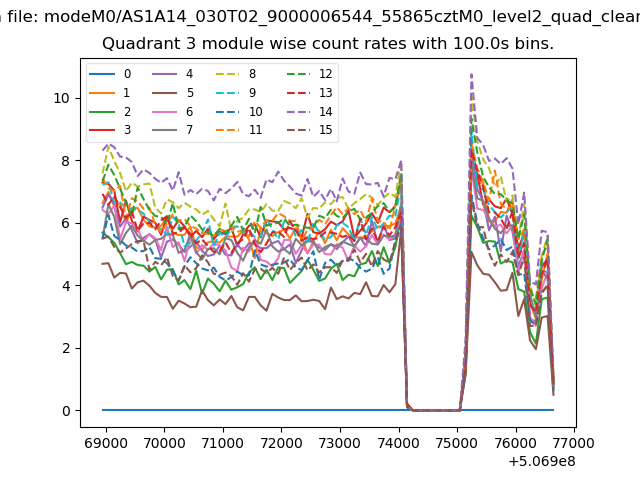
| Module-wise count rates for Quadrant A Data is divided into 100 sec bins |
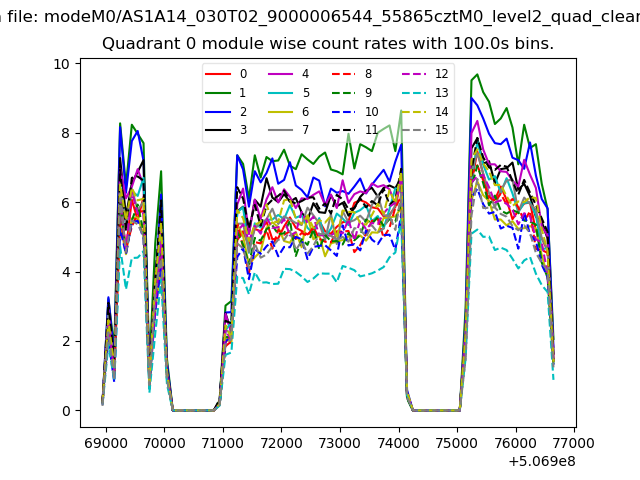 |
 |
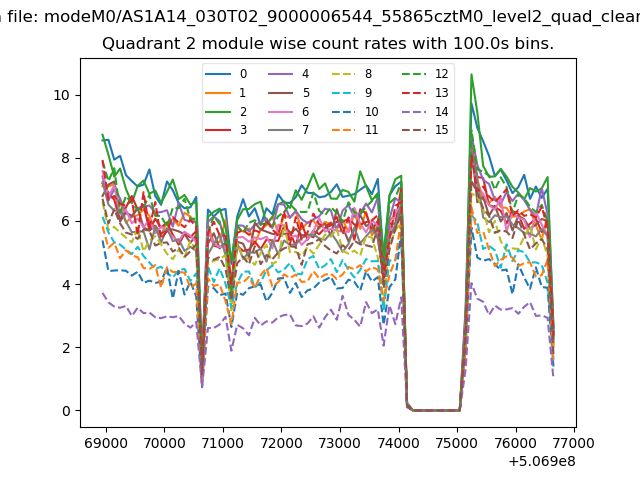
| Module-wise count rates for Quadrant B Data is divided into 100 sec bins |
 |
 |
| Module-wise count rates for Quadrant C Data is divided into 100 sec bins |
 |
 |
| Module-wise count rates for Quadrant D Data is divided into 100 sec bins |
 |
 |
| Parameter | Plot |
|---|---|
| CZT HV Monitor | 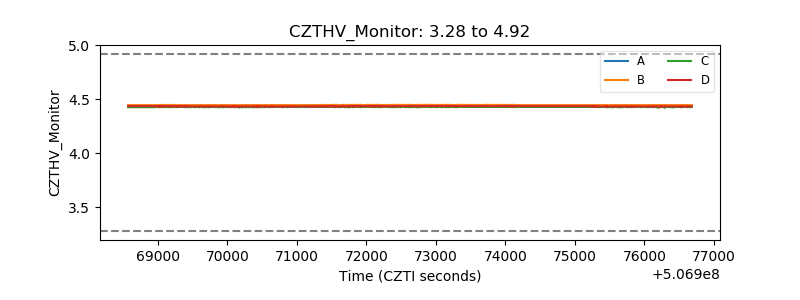 |
| D_VDD | 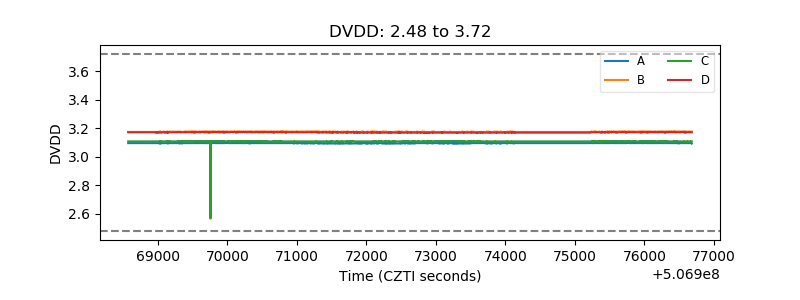 |
| Temperature 1 | 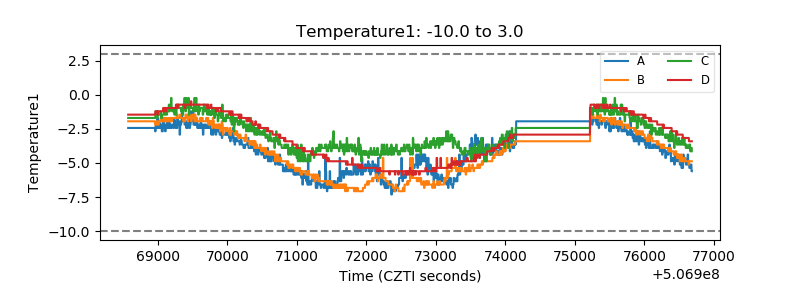 |
| Veto HV Monitor | 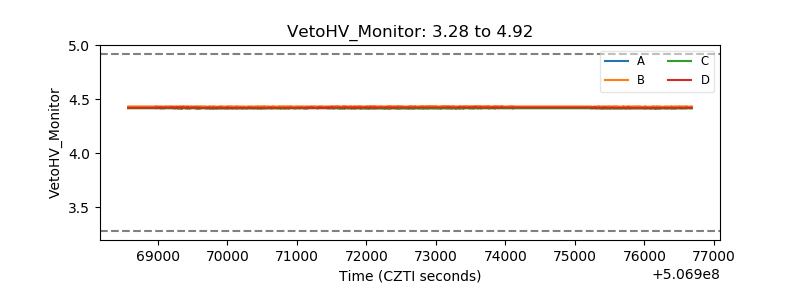 |
| Veto LLD | 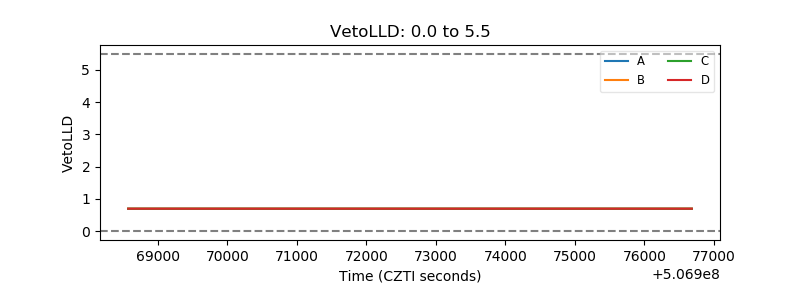 |
| Alpha Counter | 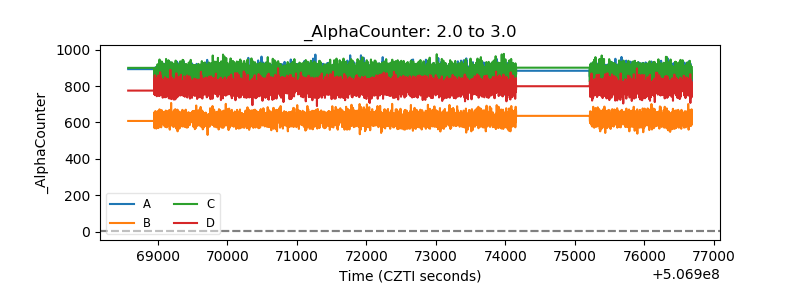 |
| _CPM_Rate | 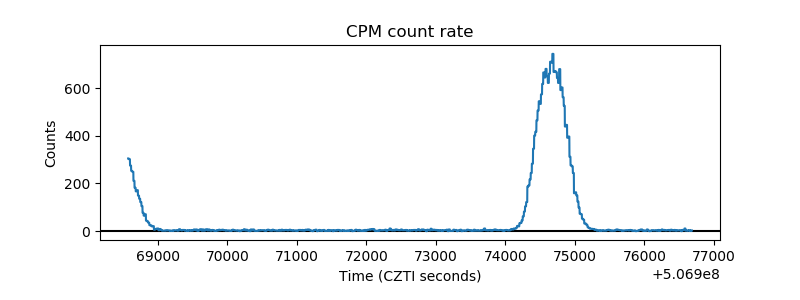 |
| CZT Counter | 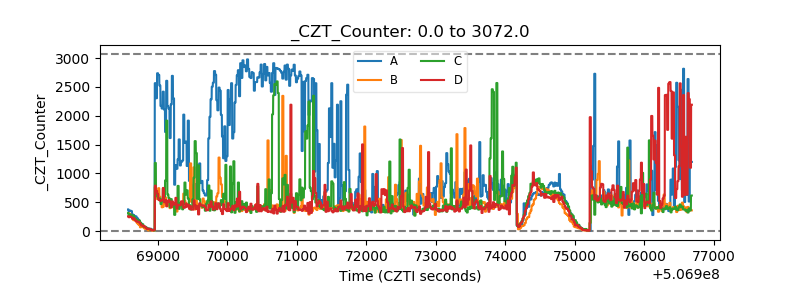 |
| +2.5 Volts monitor |  |
| +5 Volts monitor |  |
| _ROLL_ROT | 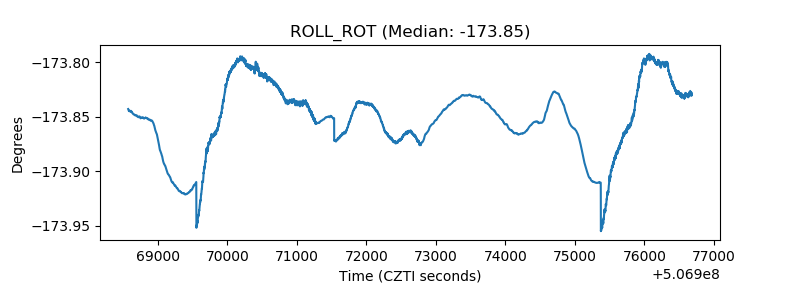 |
| _Roll_DEC | 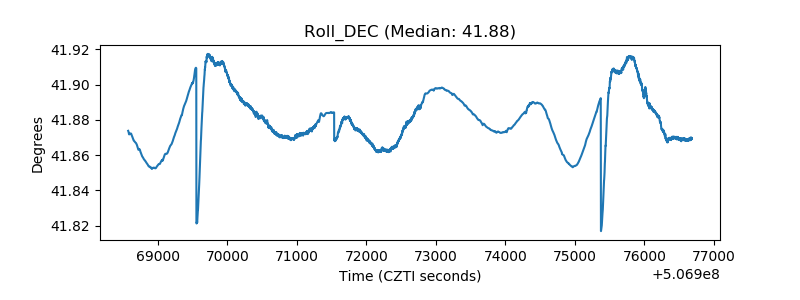 |
| _Roll_RA | 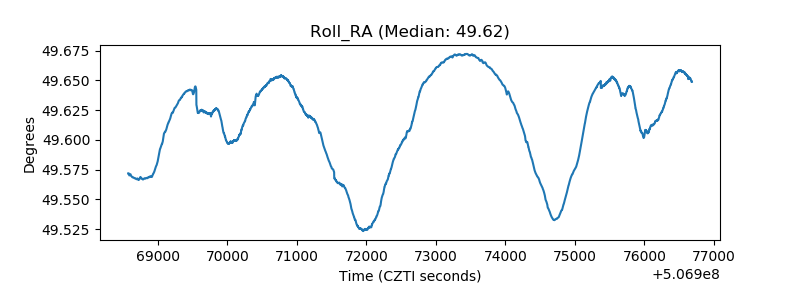 |
| Veto Counter | 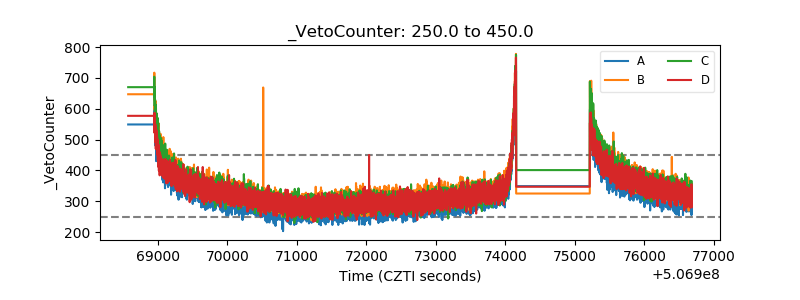 |