| Param | Original file | Final file |
|---|---|---|
| Filename | modeM0/AS1A14_030T02_9000006544_55868cztM0_level2.fits | modeM0/AS1A14_030T02_9000006544_55868cztM0_level2_quad_clean.evt |
| Size (bytes) | 500,209,920 | 82,817,280 |
| Size | 477.0 MB | 79.0 MB |
| Events in quadrant A | 6,343,572 | 432,153 |
| Events in quadrant B | 2,828,021 | 621,621 |
| Events in quadrant C | 4,780,607 | 506,760 |
| Events in quadrant D | 4,072,018 | 505,143 |
| Mode SS | |||
|---|---|---|---|
| Quadrant | BADHDUFLAG | Total packets | Discarded packets |
| A | 0 | 128 | 0 |
| B | 0 | 128 | 0 |
| C | 0 | 128 | 0 |
| D | 0 | 128 | 0 |
| Mode M9 | |||
|---|---|---|---|
| Quadrant | BADHDUFLAG | Total packets | Discarded packets |
| A | 0 | 20 | 0 |
| B | 0 | 20 | 0 |
| C | 0 | 21 | 0 |
| D | 0 | 21 | 0 |
| Mode M0 | |||
|---|---|---|---|
| Quadrant | BADHDUFLAG | Total packets | Discarded packets |
| A | 0 | 23163 | 8 |
| B | 0 | 13340 | 2 |
| C | 0 | 18698 | 2 |
| D | 0 | 16594 | 2 |
| Quadrant | Total seconds | Saturated seconds | Saturation percentage |
|---|---|---|---|
| A | 6334 | 939 | 14.824755% |
| B | 6334 | 33 | 0.520998% |
| C | 6334 | 583 | 9.204294% |
| D | 6334 | 101 | 1.594569% |
Noise dominated data is calculated using 1-second bins in cleaned event files. If a bin has >2000 counts, and if more than 50% of those come from <1% of pixels, then it is considered to be noise-dominated and hence unusable.
| Quadrant | # 1 sec bins | Bins with >0 counts | Bins with >2000 counts | High rate bins dominated by noise | Noise dominated (total time) | Noise dominated (detector-on time) | Marked lightcurve |
|---|---|---|---|---|---|---|---|
| A | 7798 | 6518 | 951 | 951 | 12.20% | 14.59% | 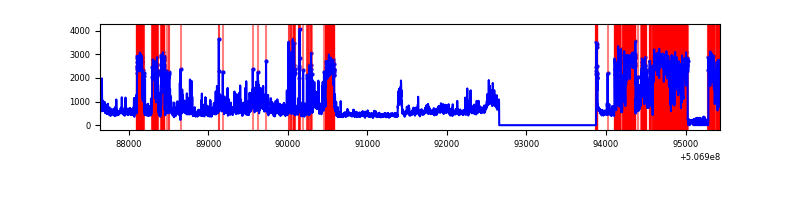 |
| B | 7798 | 6579 | 8 | 8 | 0.10% | 0.12% | 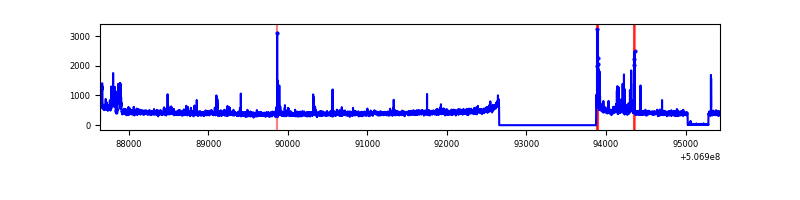 |
| C | 7798 | 6578 | 447 | 447 | 5.73% | 6.80% | 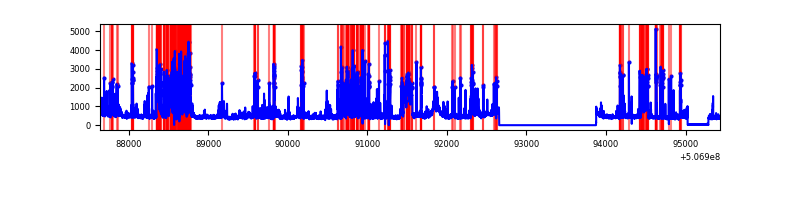 |
| D | 7798 | 6579 | 94 | 94 | 1.21% | 1.43% | 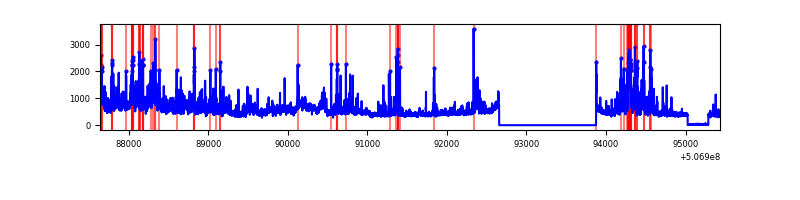 |
Top three noisy pixels from each quadrant. If the there are fewer than three noisy pixels in the level2.evt file, extra rows are filled as -1
| Pixel properties | Quadrant properties | ||||||
|---|---|---|---|---|---|---|---|
| Quadrant | DetID | PixID | Counts | Sigma | Mean | Median | Sigma |
| A | 12 | 115 | 3405870 | 22278.29 | 618 | 603 | 152.9 |
| A | 8 | 249 | 168639 | 1099.34 | 618 | 603 | 152.9 |
| A | 7 | 64 | 121994 | 794.18 | 618 | 603 | 152.9 |
| B | 5 | 236 | 78155 | 556.65 | 655 | 633 | 139.3 |
| B | 5 | 172 | 74714 | 531.94 | 655 | 633 | 139.3 |
| B | 0 | 199 | 28689 | 201.46 | 655 | 633 | 139.3 |
| C | 15 | 199 | 934730 | 5455.26 | 618 | 611 | 171.2 |
| C | 13 | 3 | 758068 | 4423.56 | 618 | 611 | 171.2 |
| C | 12 | 254 | 370291 | 2158.93 | 618 | 611 | 171.2 |
| D | 2 | 62 | 510641 | 2826.16 | 635 | 607 | 180.5 |
| D | 11 | 129 | 477030 | 2639.91 | 635 | 607 | 180.5 |
| D | 4 | 160 | 223056 | 1232.61 | 635 | 607 | 180.5 |
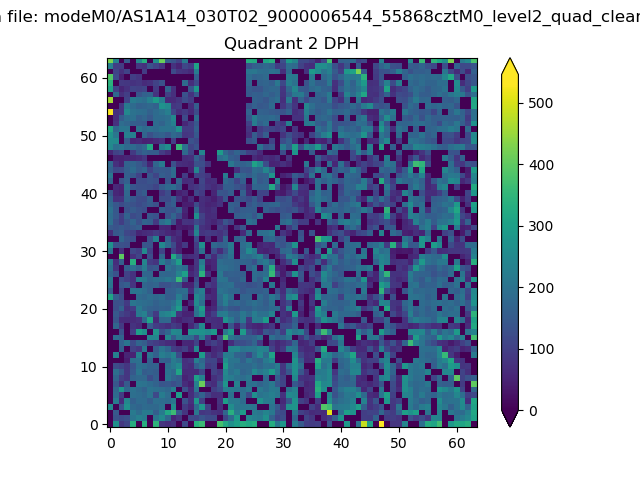
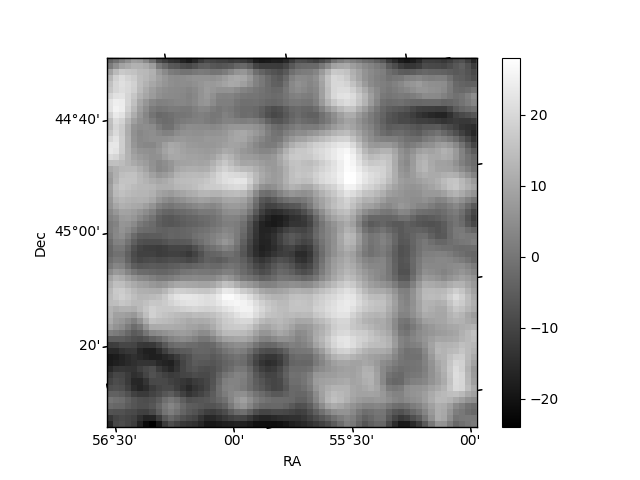
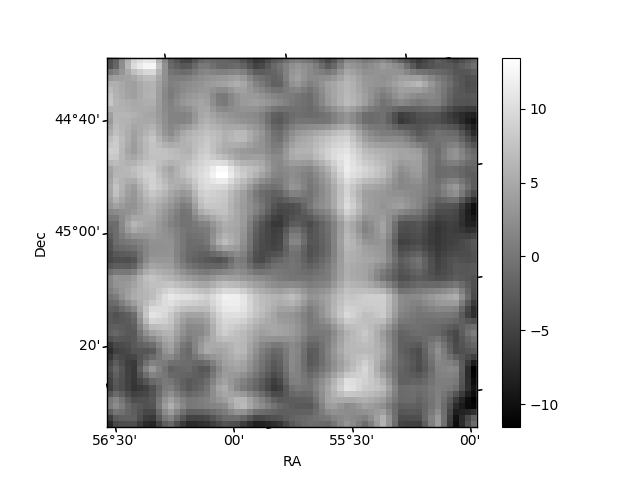
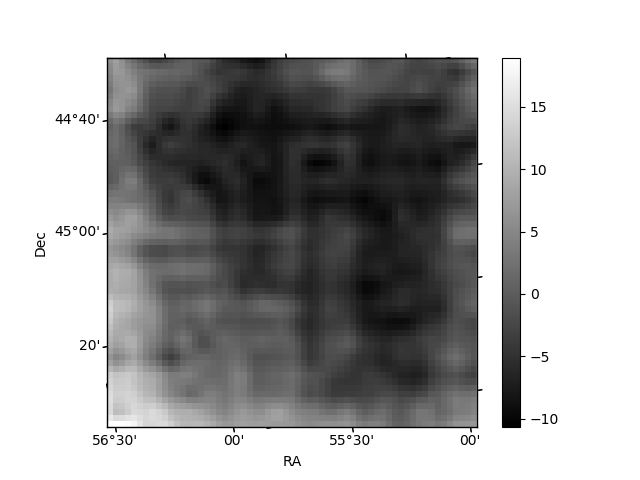
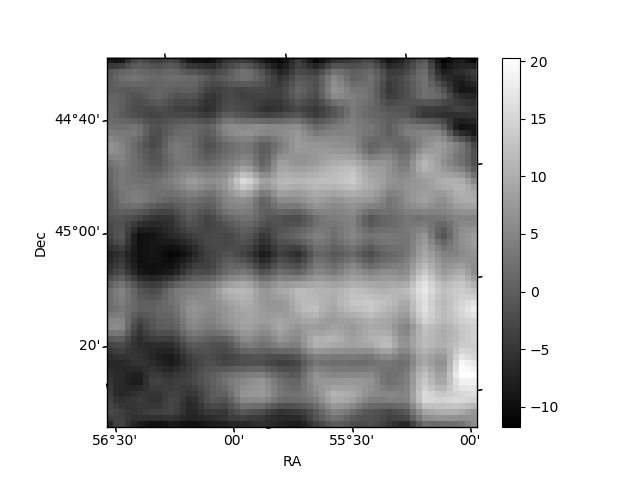
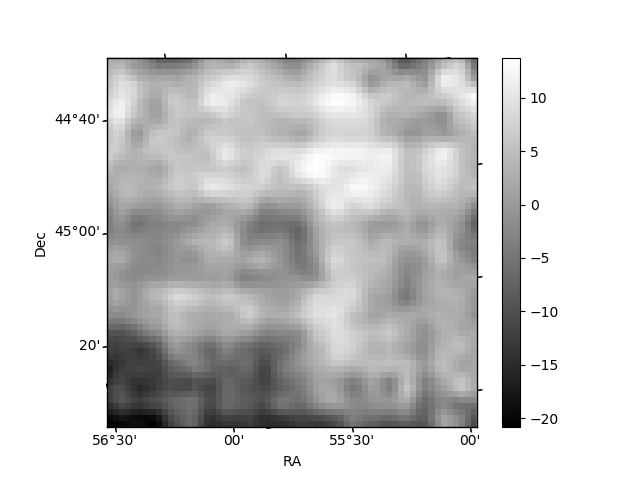
Histogram calculated using DETX and DETY for each event in the final _common_clean file
| Quadrant A | 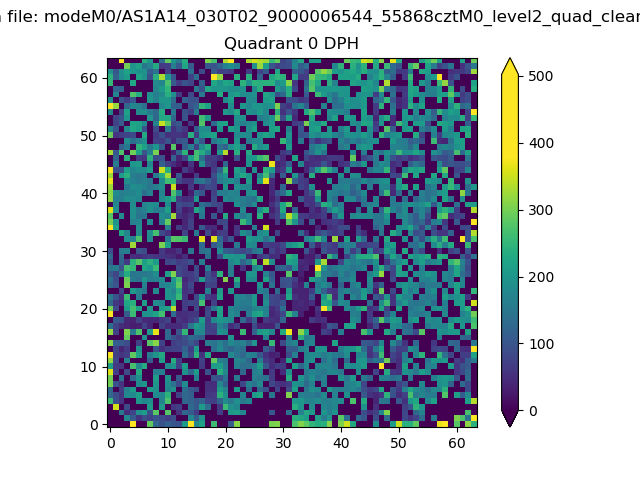 |
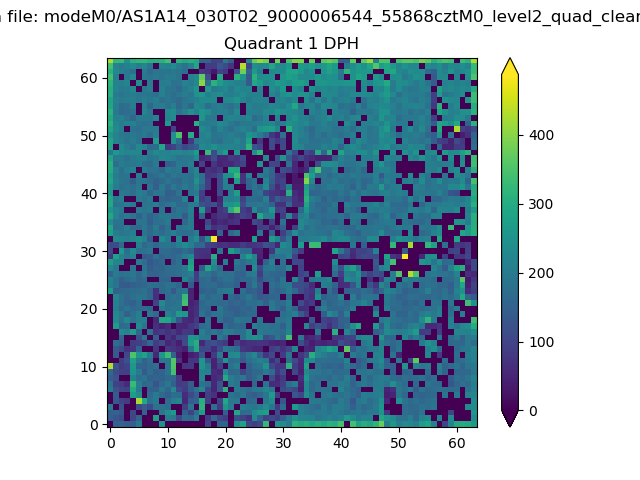 |
Quadrant B |
|---|---|---|---|
| Quadrant D | 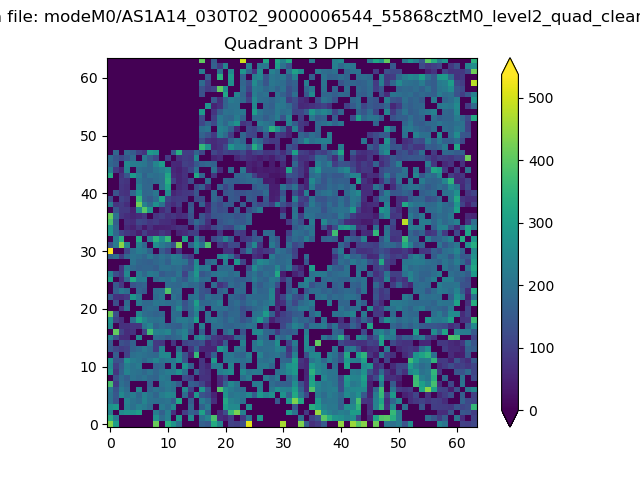 |
 |
Quadrant C |
| Plot type | Count rate plots | Images |
|---|---|---|
| Comparison with Poisson distribution Blue bars denote a histogram of data divided into 1 sec bins. Red curve is a Poisson curve with rate = median count rate of data. |
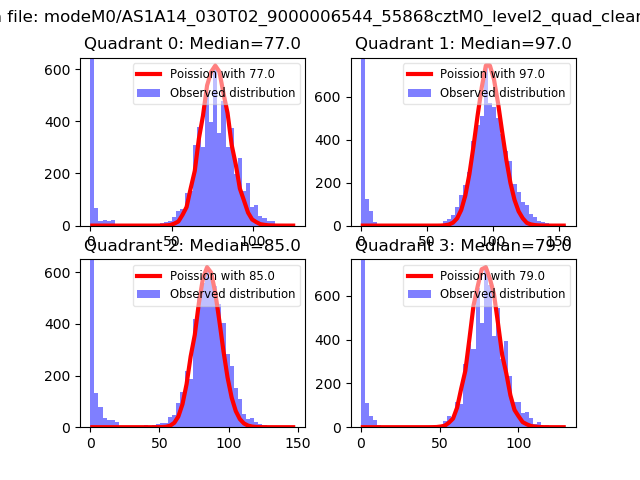 |
 |
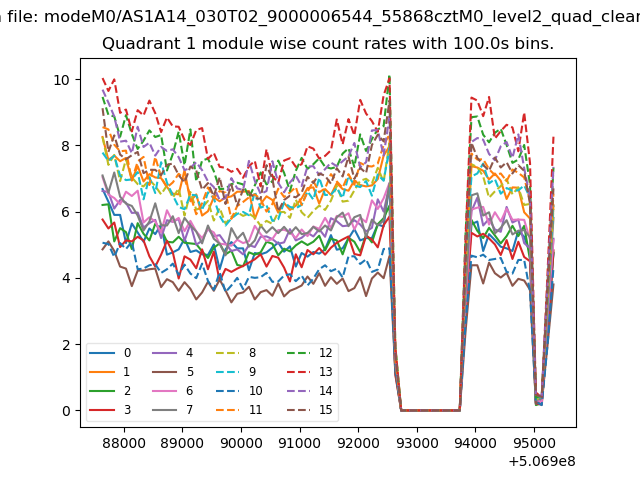
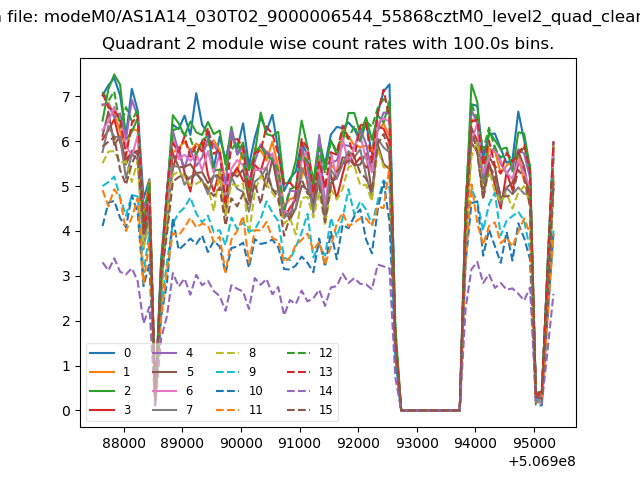
| Quadrant-wise count rates Data is divided into 100 sec bins |
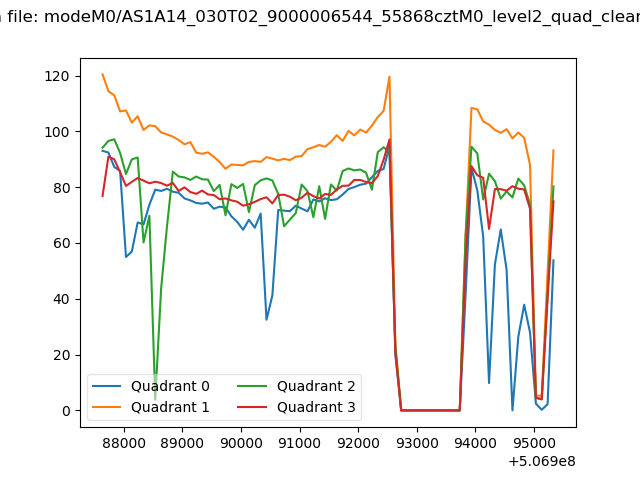 |
|
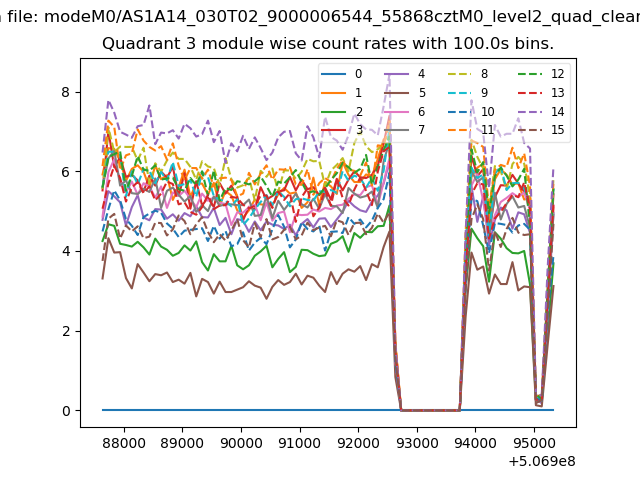
| Module-wise count rates for Quadrant A Data is divided into 100 sec bins |
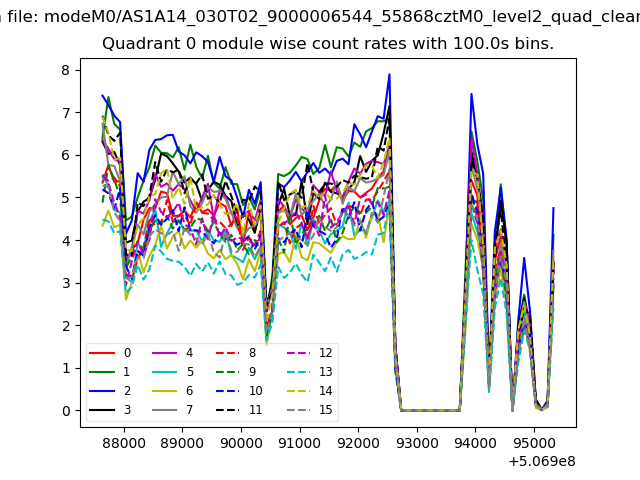 |
 |
| Module-wise count rates for Quadrant B Data is divided into 100 sec bins |
 |
 |
| Module-wise count rates for Quadrant C Data is divided into 100 sec bins |
 |
 |
| Module-wise count rates for Quadrant D Data is divided into 100 sec bins |
 |
 |
| Parameter | Plot |
|---|---|
| CZT HV Monitor | 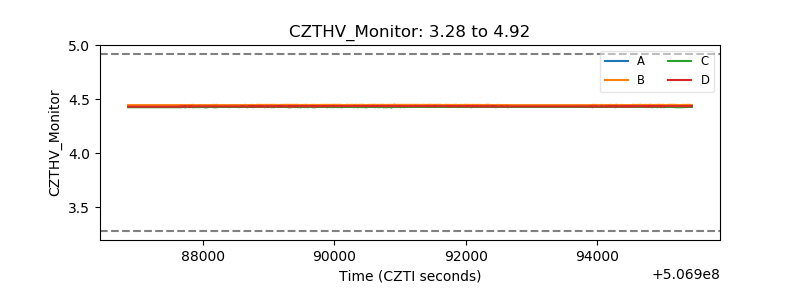 |
| D_VDD | 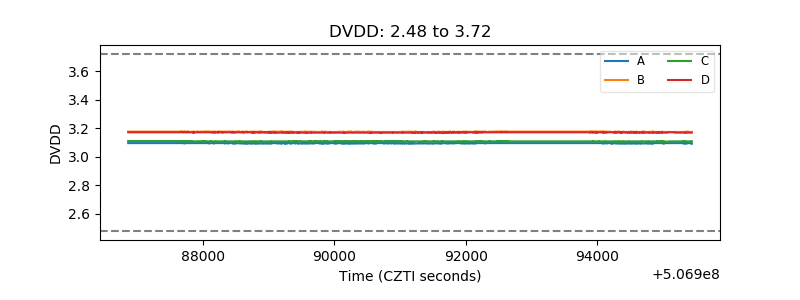 |
| Temperature 1 | 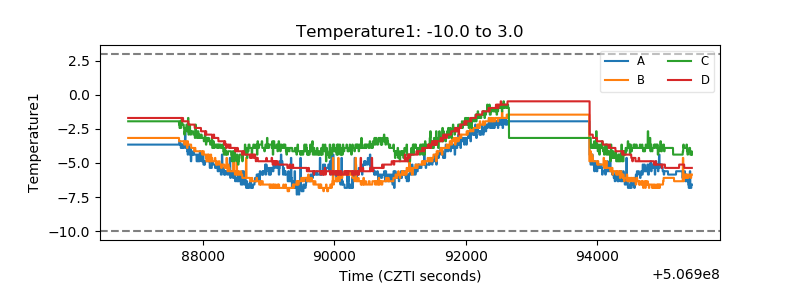 |
| Veto HV Monitor | 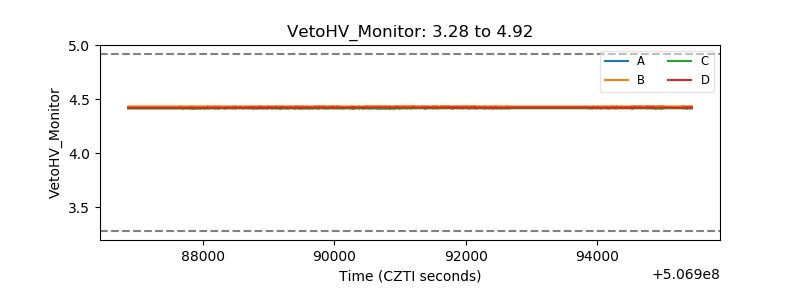 |
| Veto LLD | 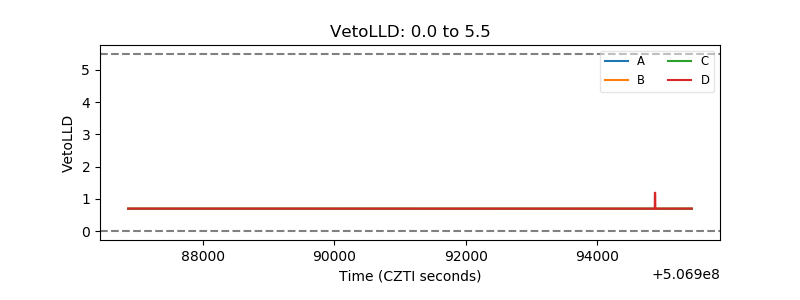 |
| Alpha Counter | 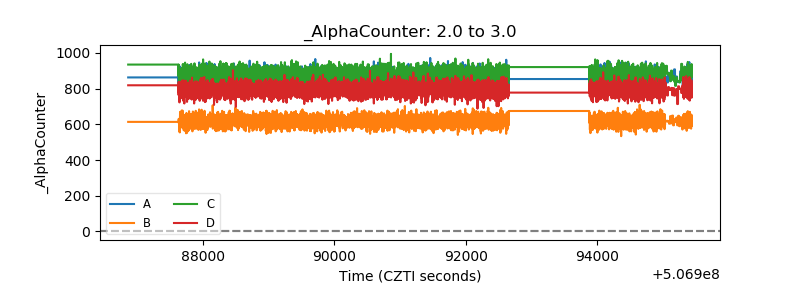 |
| _CPM_Rate | 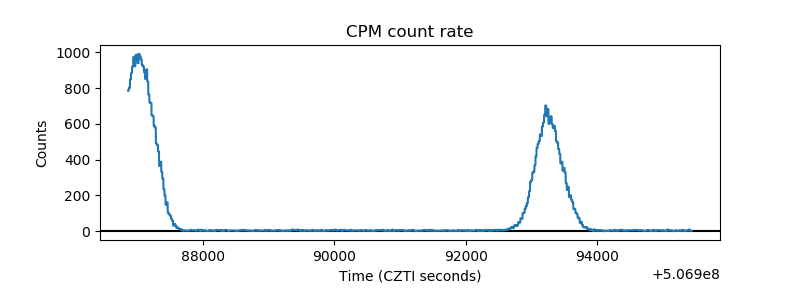 |
| CZT Counter | 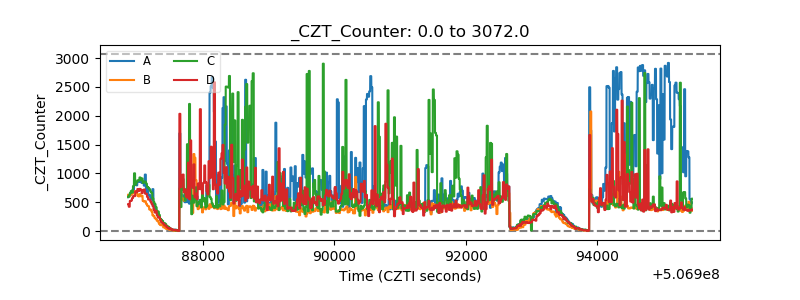 |
| +2.5 Volts monitor |  |
| +5 Volts monitor |  |
| _ROLL_ROT | 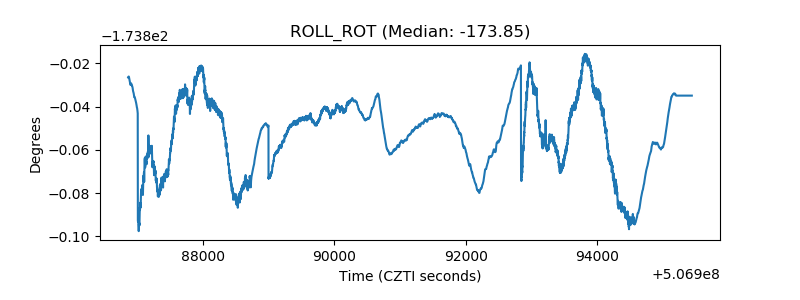 |
| _Roll_DEC | 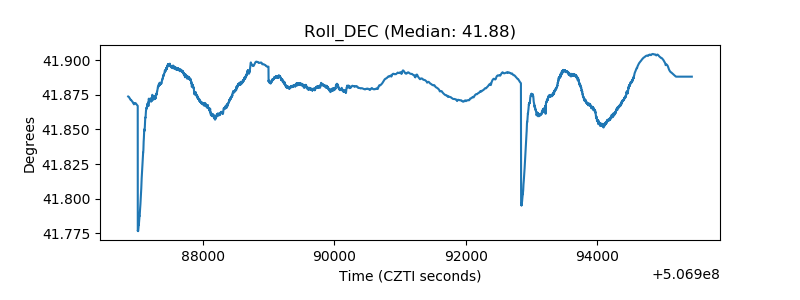 |
| _Roll_RA | 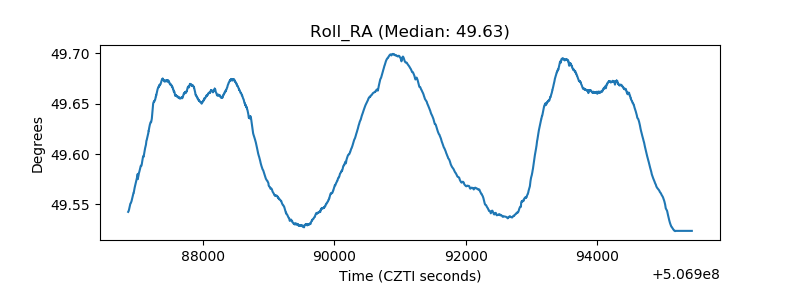 |
| Veto Counter | 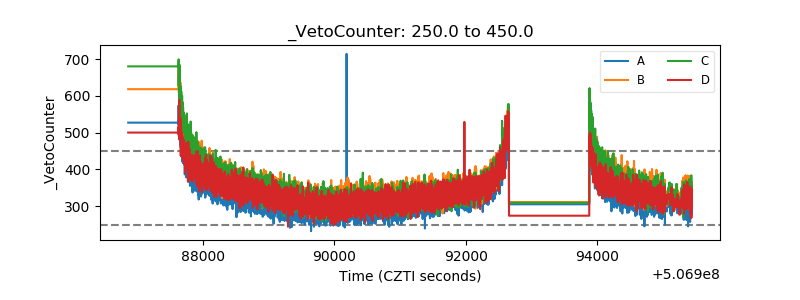 |