| Param | Original file | Final file |
|---|---|---|
| Filename | modeM0/AS1A14_030T02_9000006544_55869cztM0_level2.fits | modeM0/AS1A14_030T02_9000006544_55869cztM0_level2_quad_clean.evt |
| Size (bytes) | 567,406,080 | 80,605,440 |
| Size | 541.1 MB | 76.9 MB |
| Events in quadrant A | 8,619,505 | 395,402 |
| Events in quadrant B | 2,924,383 | 608,680 |
| Events in quadrant C | 4,958,728 | 498,119 |
| Events in quadrant D | 3,991,620 | 480,811 |
| Mode SS | |||
|---|---|---|---|
| Quadrant | BADHDUFLAG | Total packets | Discarded packets |
| A | 0 | 134 | 0 |
| B | 0 | 134 | 0 |
| C | 0 | 134 | 0 |
| D | 0 | 134 | 0 |
| Mode M9 | |||
|---|---|---|---|
| Quadrant | BADHDUFLAG | Total packets | Discarded packets |
| A | 0 | 18 | 0 |
| B | 0 | 18 | 0 |
| C | 0 | 19 | 0 |
| D | 0 | 19 | 0 |
| Mode M0 | |||
|---|---|---|---|
| Quadrant | BADHDUFLAG | Total packets | Discarded packets |
| A | 0 | 30175 | 2 |
| B | 0 | 13864 | 2 |
| C | 0 | 19548 | 2 |
| D | 0 | 16948 | 2 |
| Quadrant | Total seconds | Saturated seconds | Saturation percentage |
|---|---|---|---|
| A | 6558 | 1727 | 26.334248% |
| B | 6558 | 59 | 0.899665% |
| C | 6558 | 658 | 10.033547% |
| D | 6558 | 296 | 4.513571% |
Noise dominated data is calculated using 1-second bins in cleaned event files. If a bin has >2000 counts, and if more than 50% of those come from <1% of pixels, then it is considered to be noise-dominated and hence unusable.
| Quadrant | # 1 sec bins | Bins with >0 counts | Bins with >2000 counts | High rate bins dominated by noise | Noise dominated (total time) | Noise dominated (detector-on time) | Marked lightcurve |
|---|---|---|---|---|---|---|---|
| A | 7892 | 6742 | 1803 | 1803 | 22.85% | 26.74% | 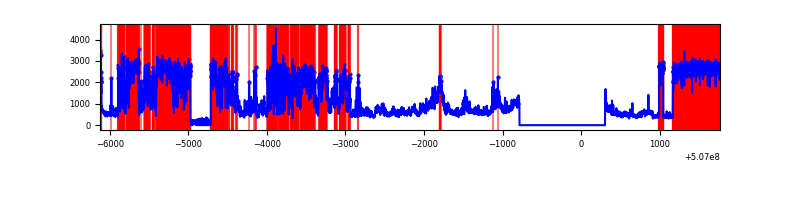 |
| B | 7892 | 6803 | 20 | 20 | 0.25% | 0.29% | 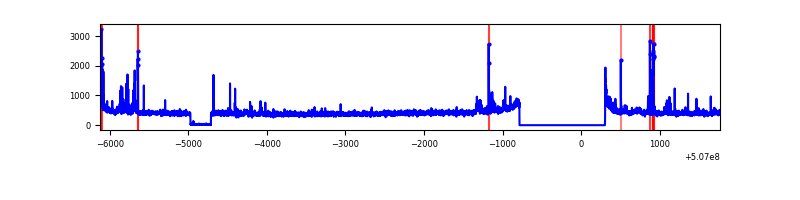 |
| C | 7892 | 6803 | 532 | 532 | 6.74% | 7.82% | 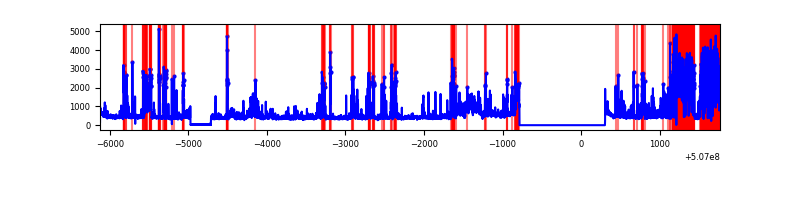 |
| D | 7892 | 6803 | 231 | 231 | 2.93% | 3.40% | 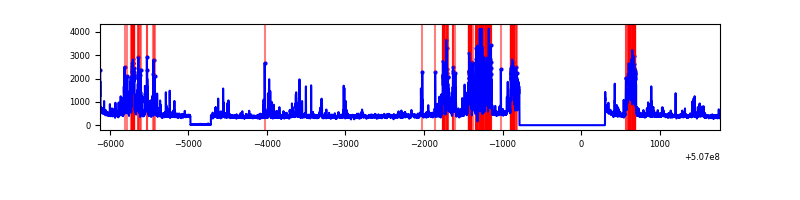 |
Top three noisy pixels from each quadrant. If the there are fewer than three noisy pixels in the level2.evt file, extra rows are filled as -1
| Pixel properties | Quadrant properties | ||||||
|---|---|---|---|---|---|---|---|
| Quadrant | DetID | PixID | Counts | Sigma | Mean | Median | Sigma |
| A | 12 | 115 | 5719658 | 38141.24 | 607 | 593 | 149.9 |
| A | 7 | 64 | 137535 | 913.29 | 607 | 593 | 149.9 |
| A | 4 | 249 | 98829 | 655.15 | 607 | 593 | 149.9 |
| B | 5 | 172 | 81121 | 558.32 | 671 | 647 | 144.1 |
| B | 7 | 252 | 61296 | 420.78 | 671 | 647 | 144.1 |
| B | 5 | 185 | 38994 | 266.05 | 671 | 647 | 144.1 |
| C | 15 | 199 | 1288185 | 7552.61 | 625 | 619 | 170.5 |
| C | 13 | 3 | 533918 | 3128.22 | 625 | 619 | 170.5 |
| C | 6 | 223 | 190967 | 1116.54 | 625 | 619 | 170.5 |
| D | 15 | 125 | 679831 | 3722.03 | 642 | 612 | 182.5 |
| D | 11 | 129 | 447412 | 2448.41 | 642 | 612 | 182.5 |
| D | 2 | 153 | 80574 | 438.18 | 642 | 612 | 182.5 |
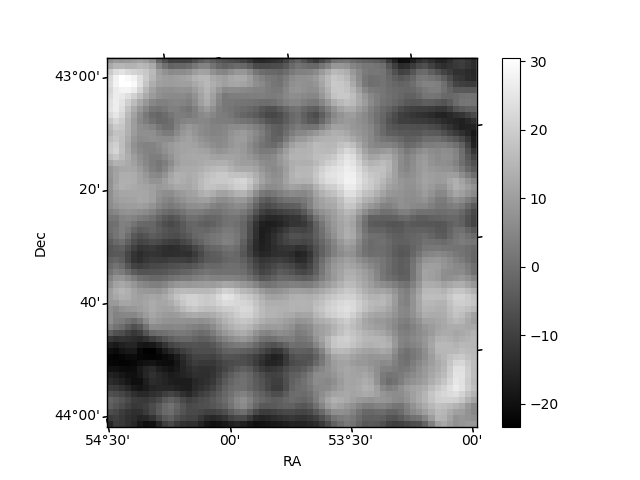
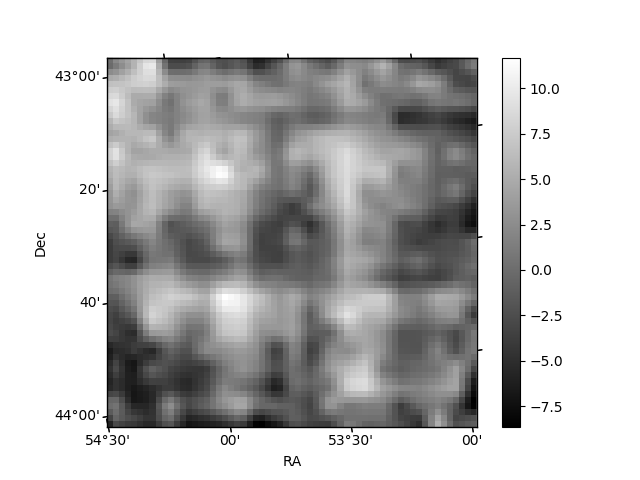
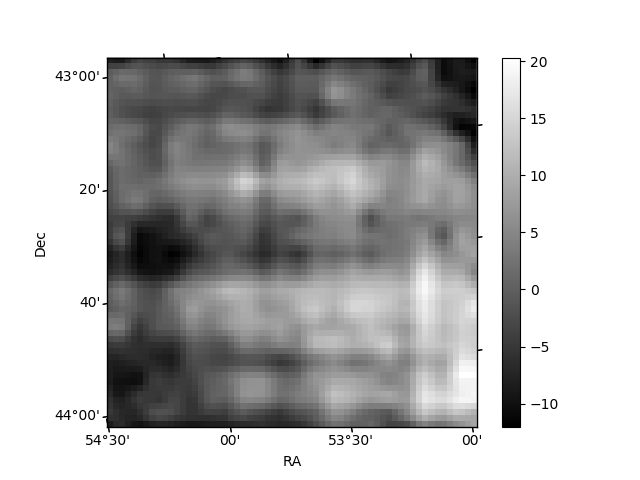
Histogram calculated using DETX and DETY for each event in the final _common_clean file
| Quadrant A | 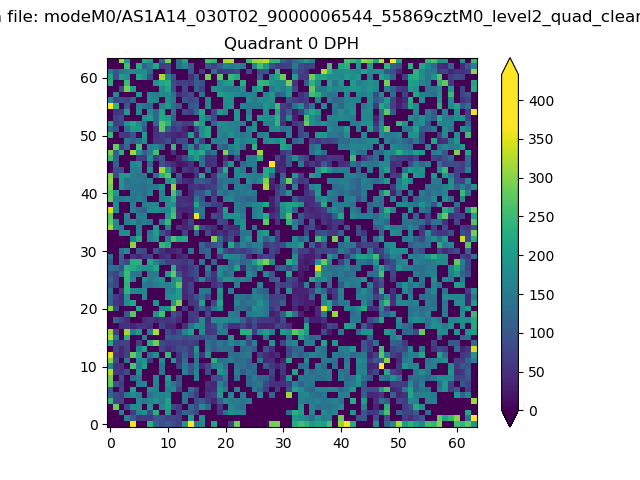 |
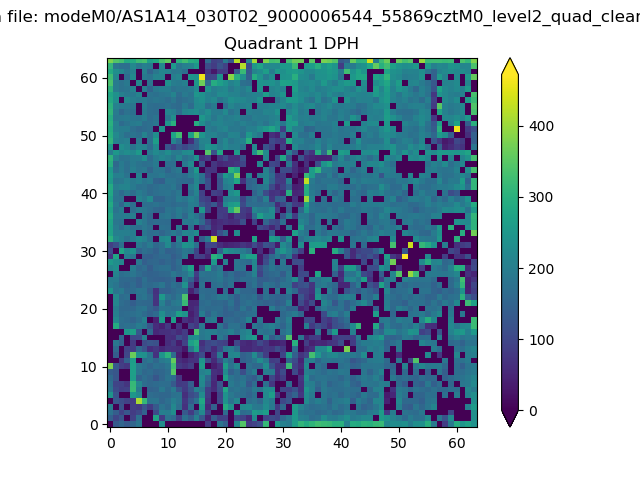 |
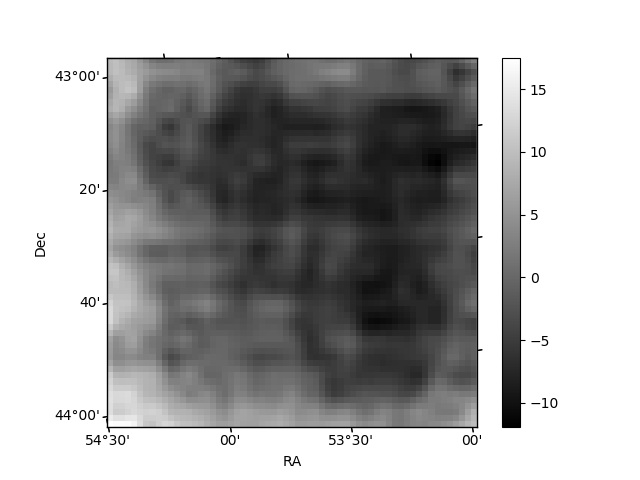
Quadrant B |
|---|---|---|---|
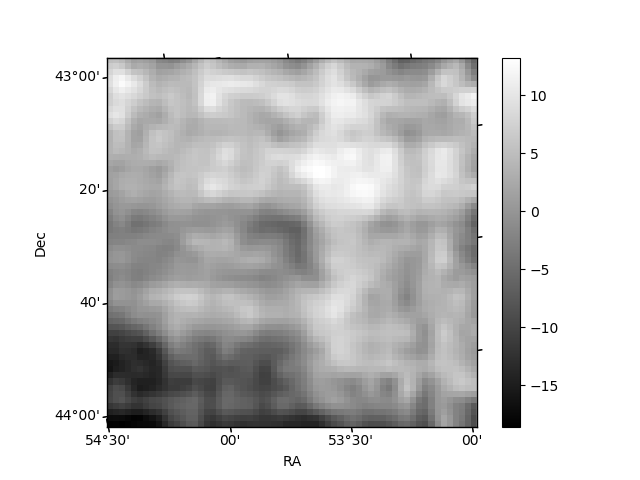
| Quadrant D | 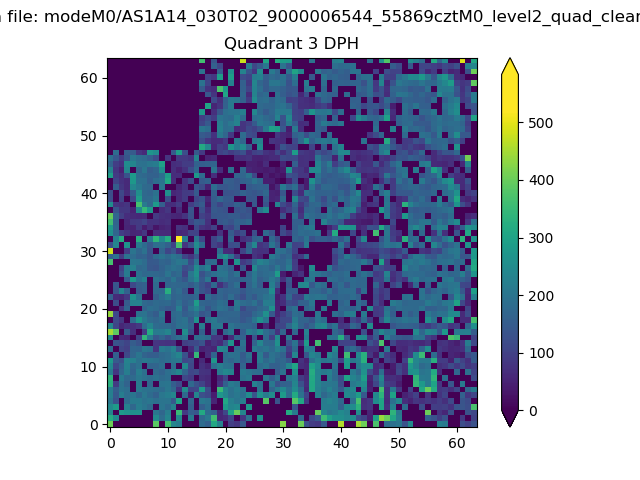 |
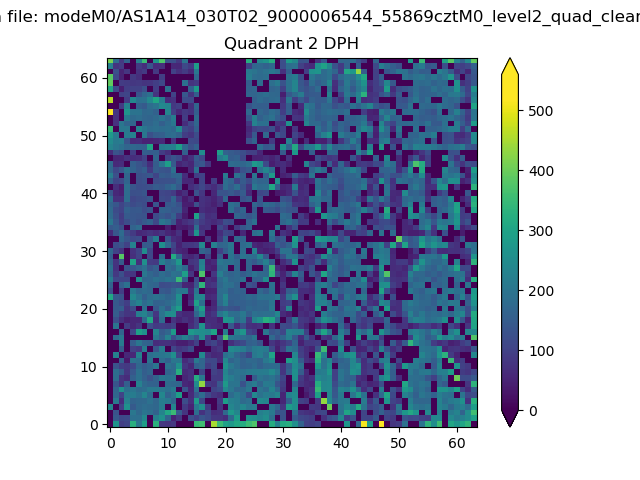 |
Quadrant C |
| Plot type | Count rate plots | Images |
|---|---|---|
| Comparison with Poisson distribution Blue bars denote a histogram of data divided into 1 sec bins. Red curve is a Poisson curve with rate = median count rate of data. |
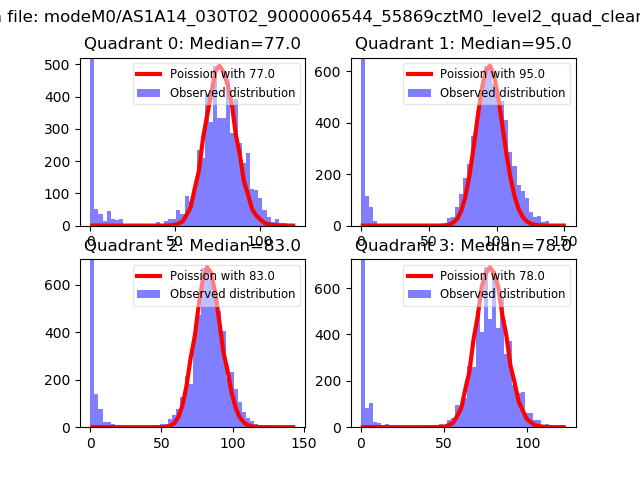 |
 |
| Quadrant-wise count rates Data is divided into 100 sec bins |
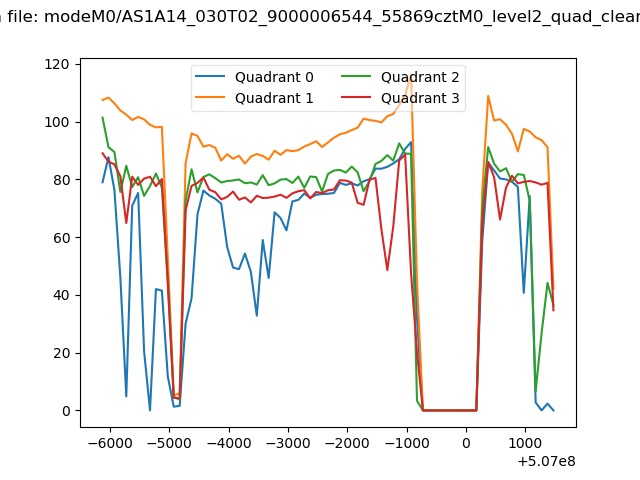 |
|
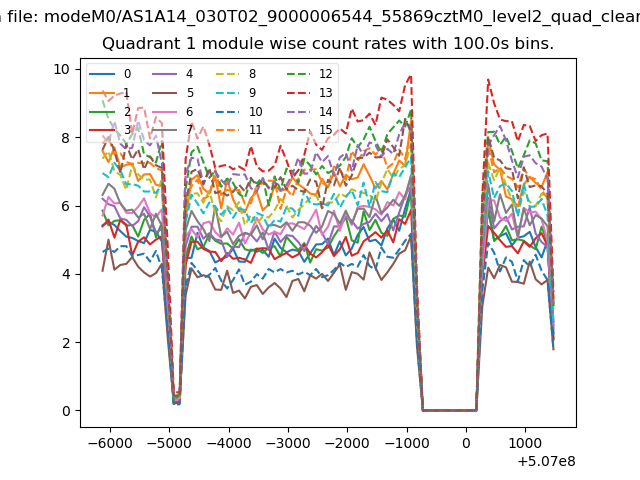
| Module-wise count rates for Quadrant A Data is divided into 100 sec bins |
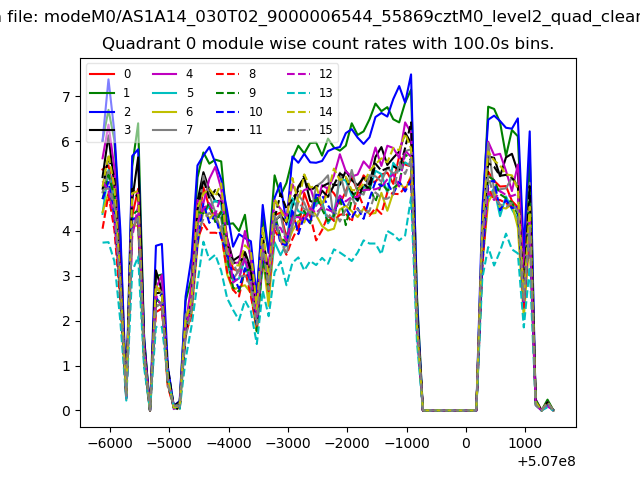 |
 |
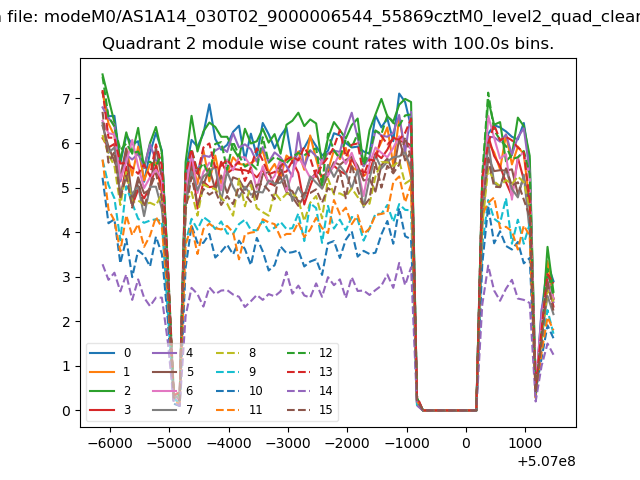
| Module-wise count rates for Quadrant B Data is divided into 100 sec bins |
 |
 |
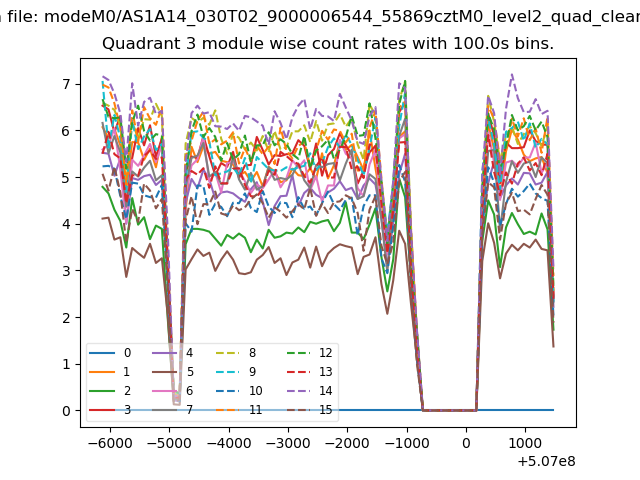
| Module-wise count rates for Quadrant C Data is divided into 100 sec bins |
 |
 |
| Module-wise count rates for Quadrant D Data is divided into 100 sec bins |
 |
 |
| Parameter | Plot |
|---|---|
| CZT HV Monitor | 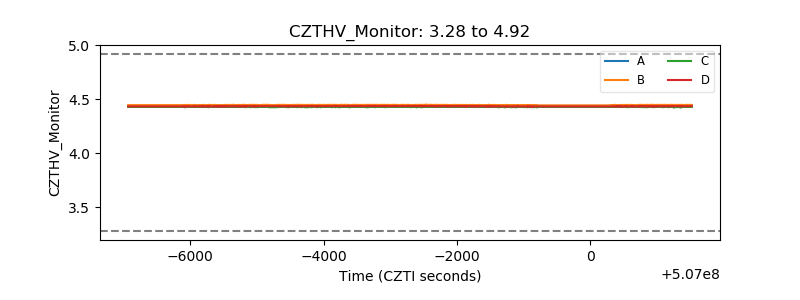 |
| D_VDD | 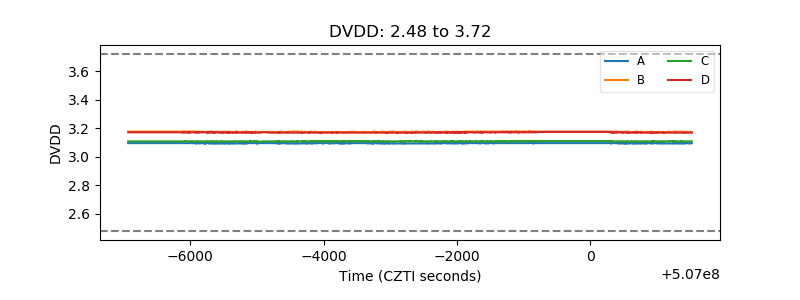 |
| Temperature 1 | 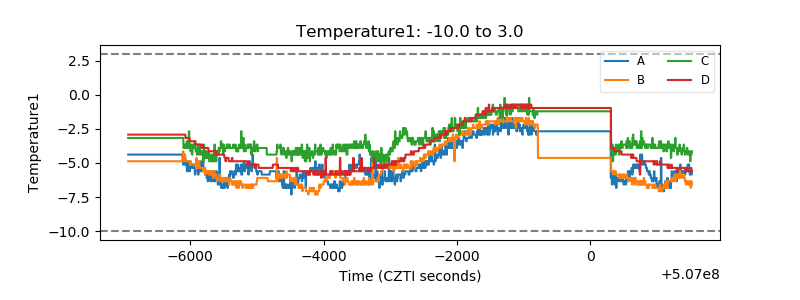 |
| Veto HV Monitor |  |
| Veto LLD | 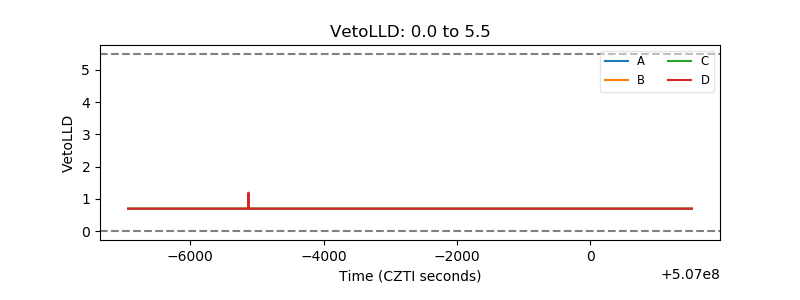 |
| Alpha Counter | 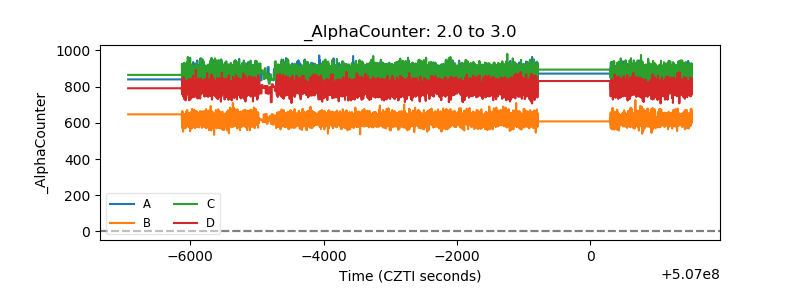 |
| _CPM_Rate | 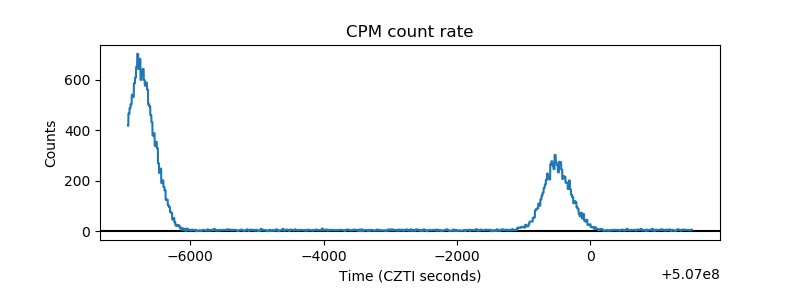 |
| CZT Counter | 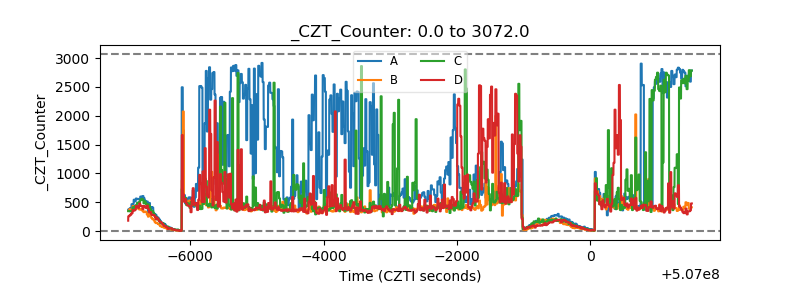 |
| +2.5 Volts monitor |  |
| +5 Volts monitor |  |
| _ROLL_ROT | 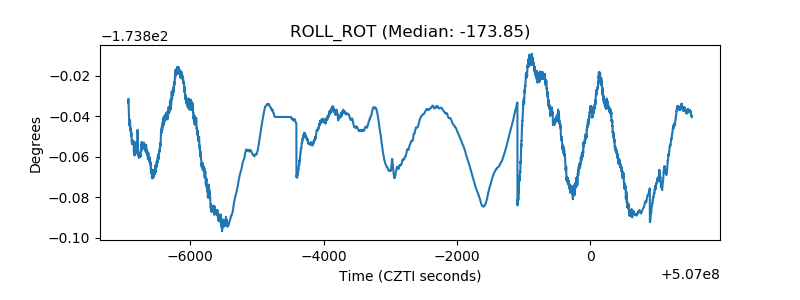 |
| _Roll_DEC | 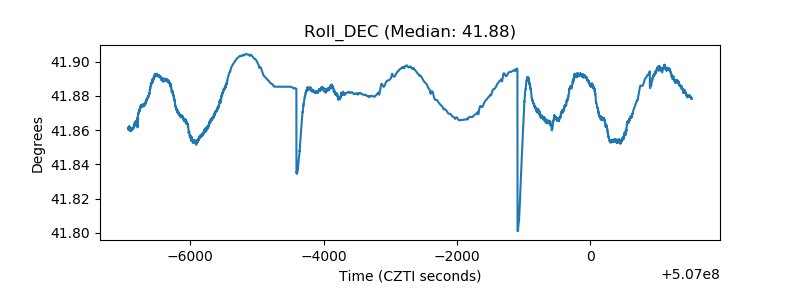 |
| _Roll_RA | 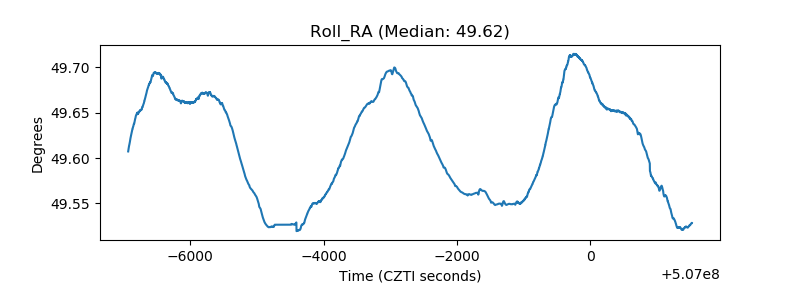 |
| Veto Counter | 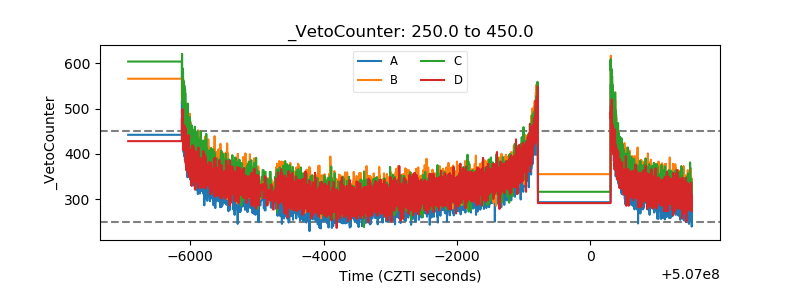 |