| Param | Original file | Final file |
|---|---|---|
| Filename | modeM0/AS1A14_030T02_9000006544_55870cztM0_level2.fits | modeM0/AS1A14_030T02_9000006544_55870cztM0_level2_quad_clean.evt |
| Size (bytes) | 806,074,560 | 87,145,920 |
| Size | 768.7 MB | 83.1 MB |
| Events in quadrant A | 13,312,944 | 342,552 |
| Events in quadrant B | 3,375,960 | 714,519 |
| Events in quadrant C | 6,152,985 | 548,405 |
| Events in quadrant D | 6,437,611 | 530,653 |
| Mode SS | |||
|---|---|---|---|
| Quadrant | BADHDUFLAG | Total packets | Discarded packets |
| A | 0 | 150 | 0 |
| B | 0 | 150 | 0 |
| C | 0 | 150 | 0 |
| D | 0 | 150 | 0 |
| Mode M9 | |||
|---|---|---|---|
| Quadrant | BADHDUFLAG | Total packets | Discarded packets |
| A | 0 | 18 | 0 |
| B | 0 | 18 | 0 |
| C | 0 | 18 | 0 |
| D | 0 | 18 | 0 |
| Mode M0 | |||
|---|---|---|---|
| Quadrant | BADHDUFLAG | Total packets | Discarded packets |
| A | 0 | 44536 | 2 |
| B | 0 | 15670 | 2 |
| C | 0 | 23557 | 2 |
| D | 0 | 24525 | 2 |
| Quadrant | Total seconds | Saturated seconds | Saturation percentage |
|---|---|---|---|
| A | 7208 | 3848 | 53.385128% |
| B | 7208 | 126 | 1.748058% |
| C | 7208 | 1148 | 15.926748% |
| D | 7208 | 939 | 13.027192% |
Noise dominated data is calculated using 1-second bins in cleaned event files. If a bin has >2000 counts, and if more than 50% of those come from <1% of pixels, then it is considered to be noise-dominated and hence unusable.
| Quadrant | # 1 sec bins | Bins with >0 counts | Bins with >2000 counts | High rate bins dominated by noise | Noise dominated (total time) | Noise dominated (detector-on time) | Marked lightcurve |
|---|---|---|---|---|---|---|---|
| A | 9068 | 7210 | 3840 | 3840 | 42.35% | 53.26% | 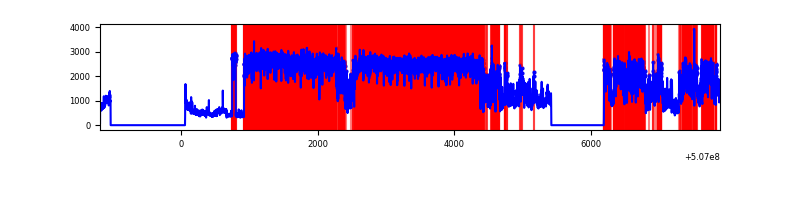 |
| B | 9068 | 7210 | 21 | 21 | 0.23% | 0.29% | 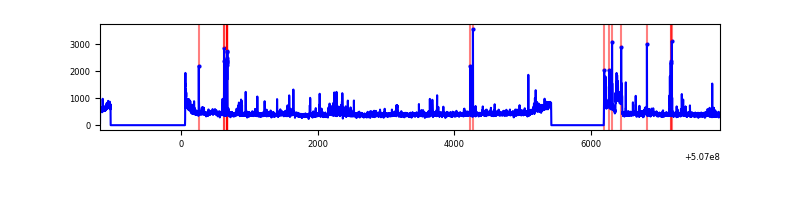 |
| C | 9068 | 7210 | 820 | 820 | 9.04% | 11.37% | 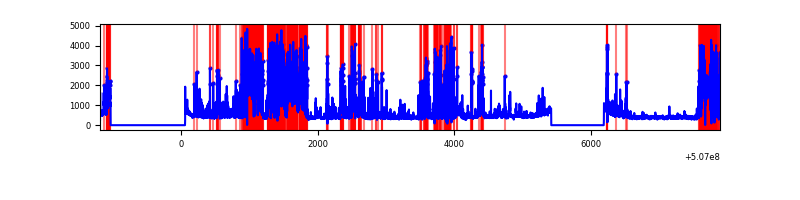 |
| D | 9068 | 7210 | 908 | 908 | 10.01% | 12.59% | 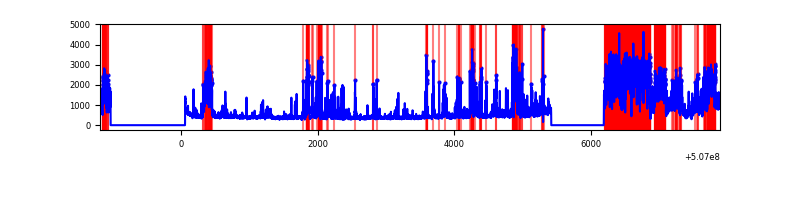 |
Top three noisy pixels from each quadrant. If the there are fewer than three noisy pixels in the level2.evt file, extra rows are filled as -1
| Pixel properties | Quadrant properties | ||||||
|---|---|---|---|---|---|---|---|
| Quadrant | DetID | PixID | Counts | Sigma | Mean | Median | Sigma |
| A | 12 | 115 | 10296310 | 68065.58 | 615 | 598 | 151.3 |
| A | 7 | 64 | 336373 | 2219.83 | 615 | 598 | 151.3 |
| A | 12 | 194 | 81922 | 537.64 | 615 | 598 | 151.3 |
| B | 5 | 172 | 163304 | 1014.19 | 746 | 717 | 160.3 |
| B | 7 | 252 | 148279 | 920.47 | 746 | 717 | 160.3 |
| B | 0 | 199 | 28490 | 173.24 | 746 | 717 | 160.3 |
| C | 15 | 199 | 2650253 | 14463.54 | 670 | 662 | 183.2 |
| C | 13 | 3 | 208121 | 1132.47 | 670 | 662 | 183.2 |
| C | 12 | 252 | 195923 | 1065.89 | 670 | 662 | 183.2 |
| D | 2 | 62 | 2314451 | 11893.69 | 684 | 652 | 194.5 |
| D | 15 | 125 | 517735 | 2657.98 | 684 | 652 | 194.5 |
| D | 2 | 249 | 232045 | 1189.44 | 684 | 652 | 194.5 |
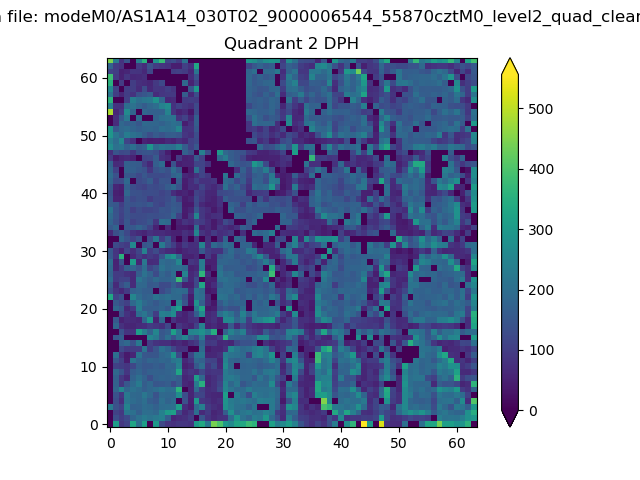
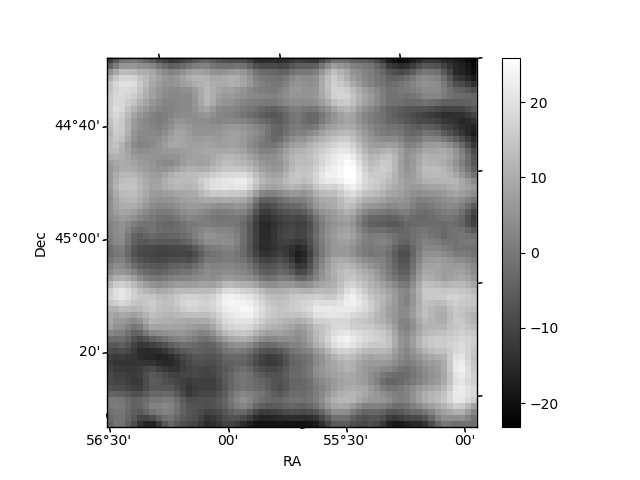
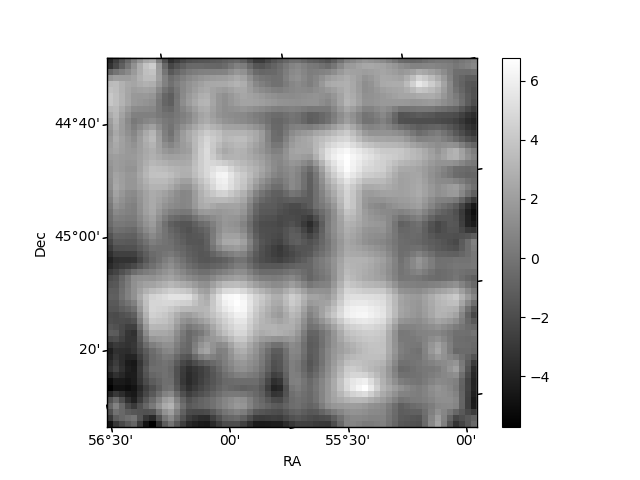
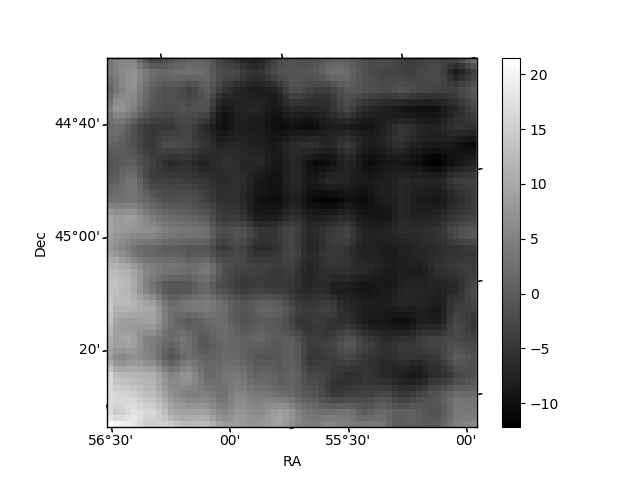
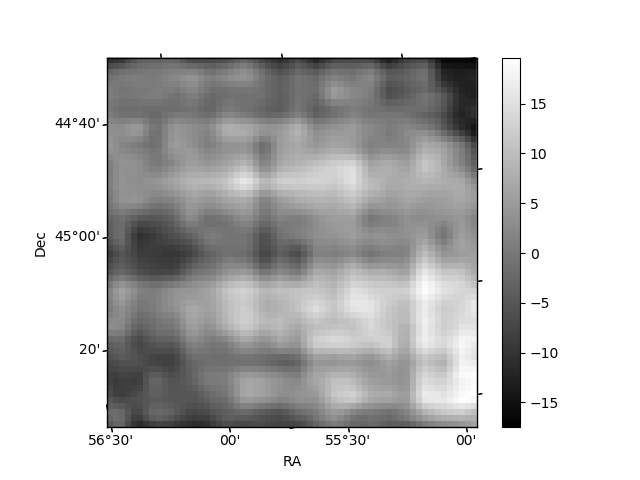
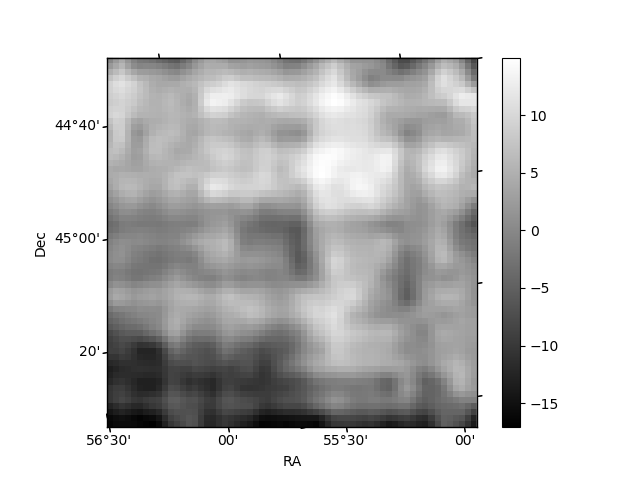
Histogram calculated using DETX and DETY for each event in the final _common_clean file
| Quadrant A | 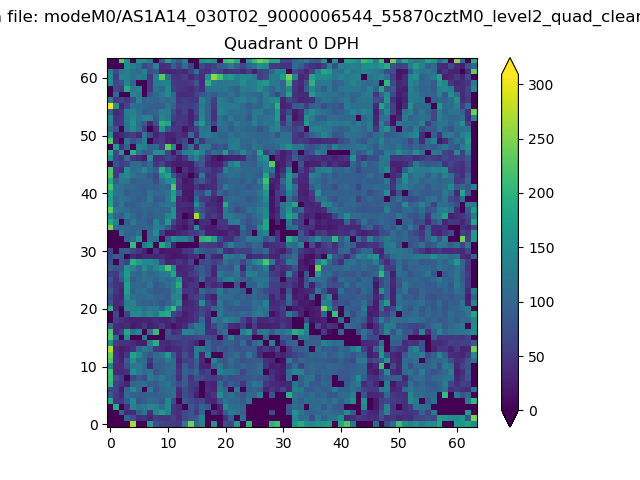 |
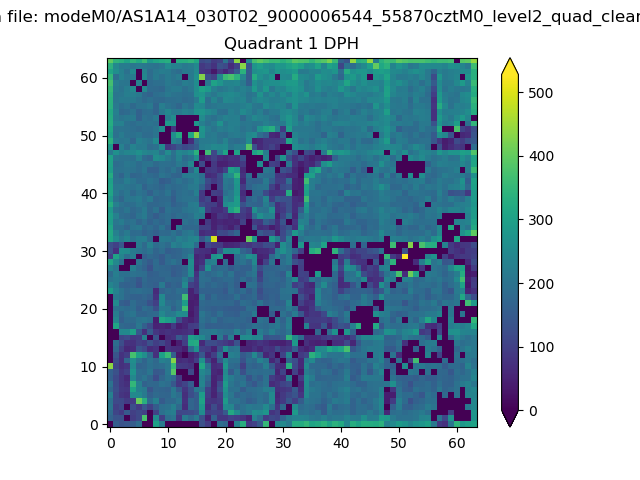 |
Quadrant B |
|---|---|---|---|
| Quadrant D | 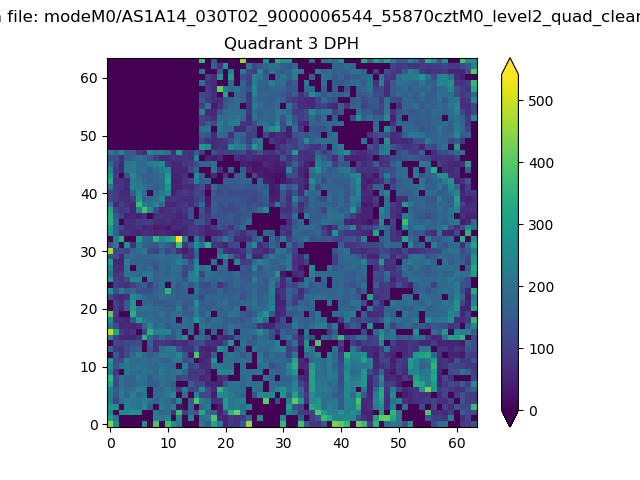 |
 |
Quadrant C |
| Plot type | Count rate plots | Images |
|---|---|---|
| Comparison with Poisson distribution Blue bars denote a histogram of data divided into 1 sec bins. Red curve is a Poisson curve with rate = median count rate of data. |
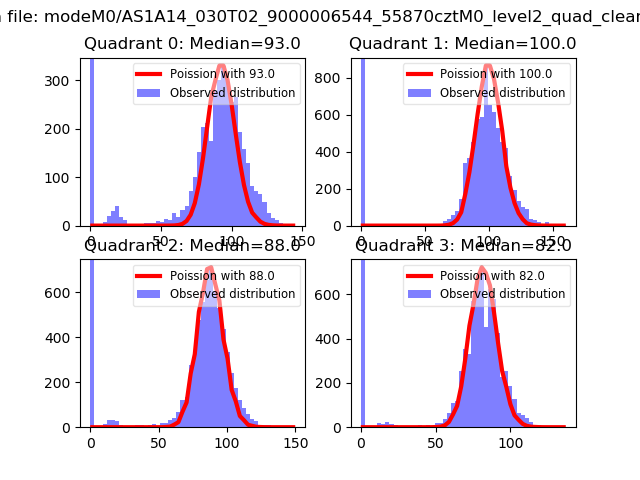 |
 |
| Quadrant-wise count rates Data is divided into 100 sec bins |
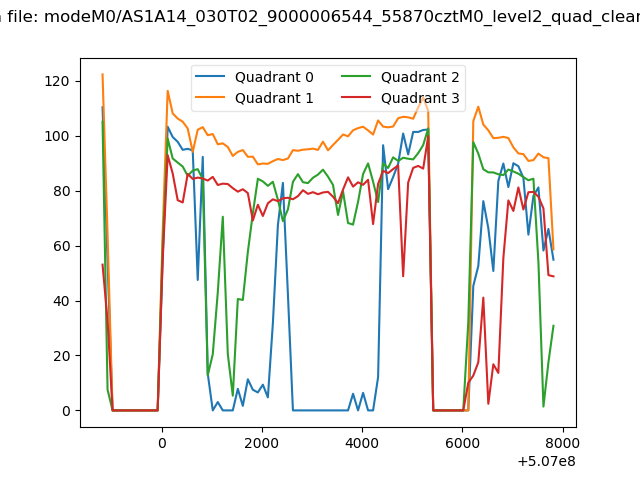 |
|
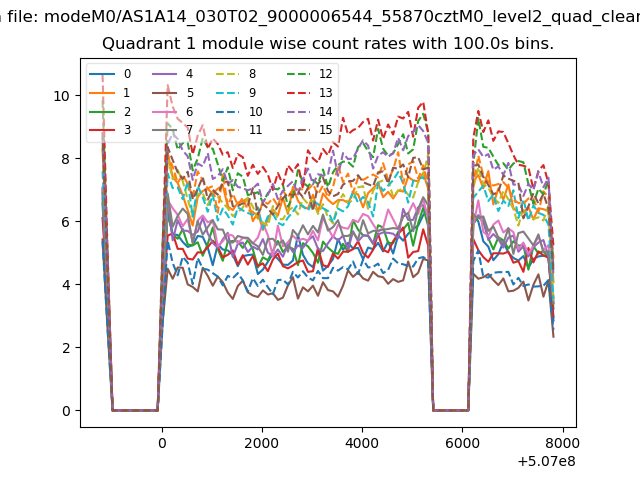
| Module-wise count rates for Quadrant A Data is divided into 100 sec bins |
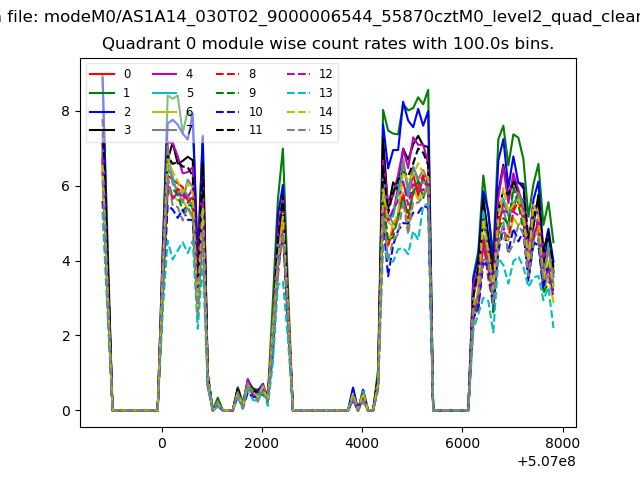 |
 |
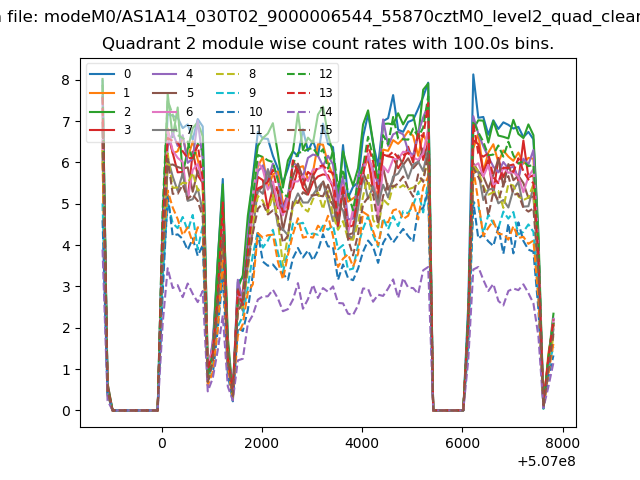
| Module-wise count rates for Quadrant B Data is divided into 100 sec bins |
 |
 |
| Module-wise count rates for Quadrant C Data is divided into 100 sec bins |
 |
 |
| Module-wise count rates for Quadrant D Data is divided into 100 sec bins |
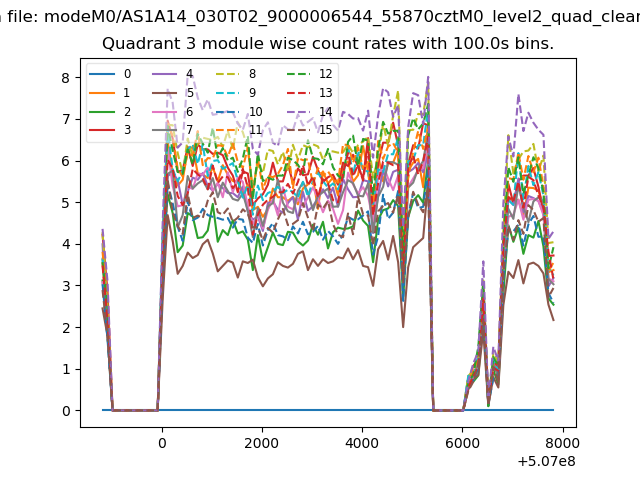 |
 |
| Parameter | Plot |
|---|---|
| CZT HV Monitor | 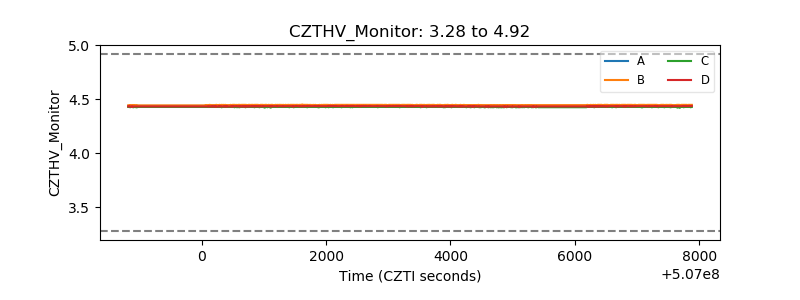 |
| D_VDD | 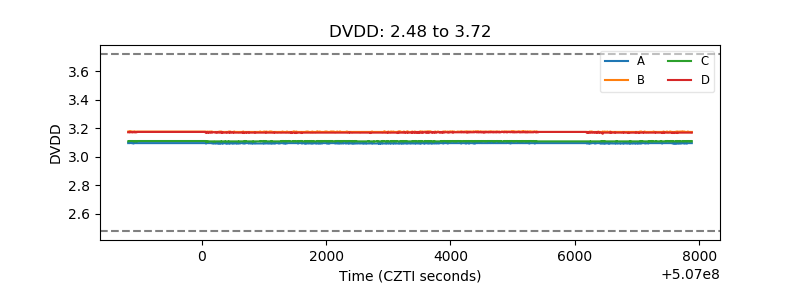 |
| Temperature 1 | 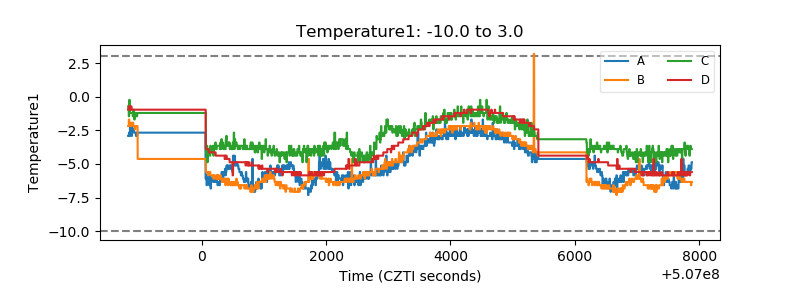 |
| Veto HV Monitor | 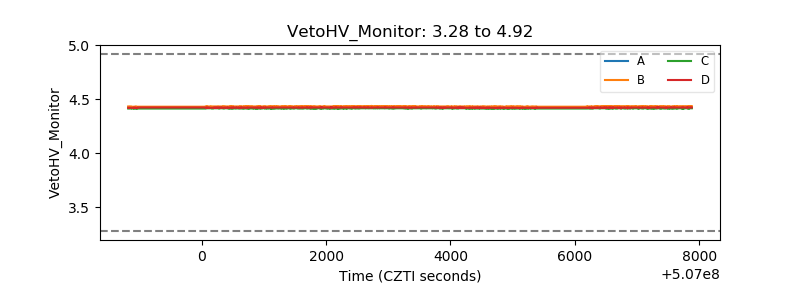 |
| Veto LLD | 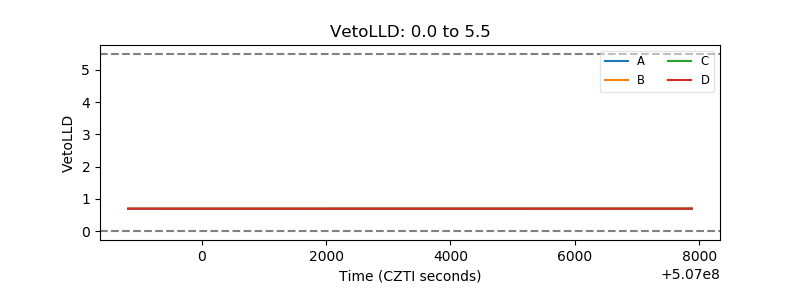 |
| Alpha Counter | 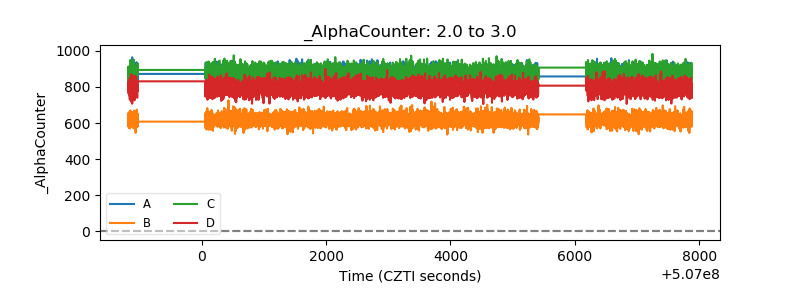 |
| _CPM_Rate | 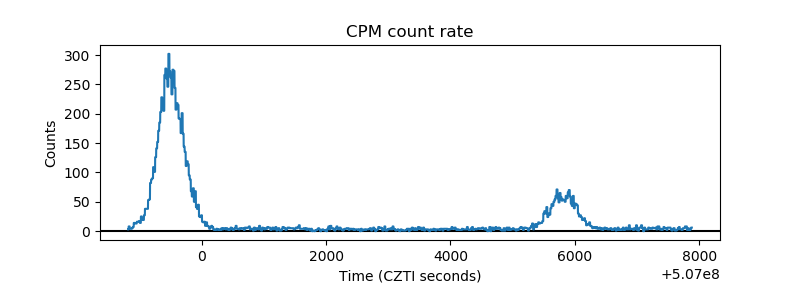 |
| CZT Counter | 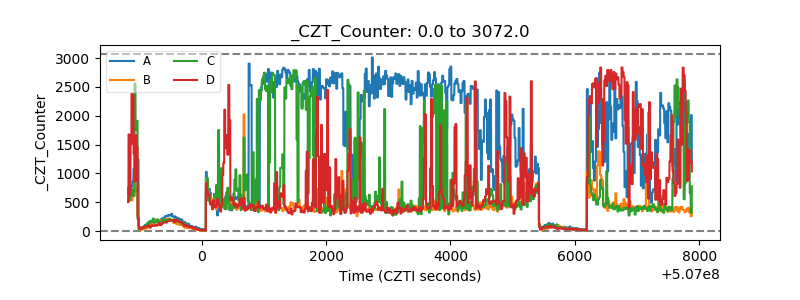 |
| +2.5 Volts monitor |  |
| +5 Volts monitor |  |
| _ROLL_ROT | 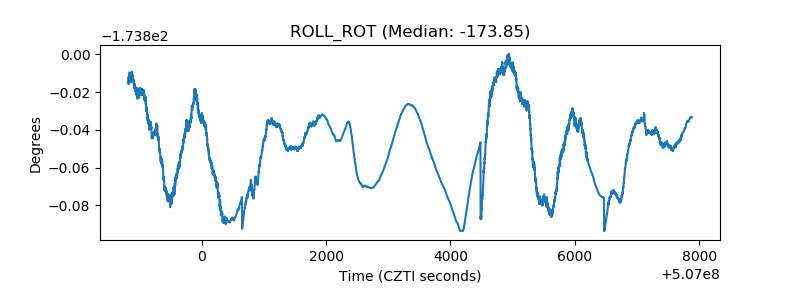 |
| _Roll_DEC | 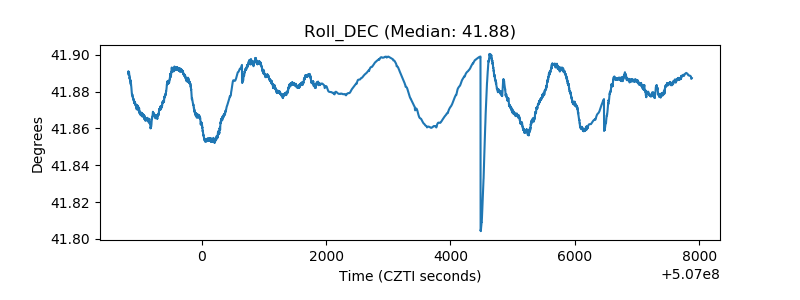 |
| _Roll_RA | 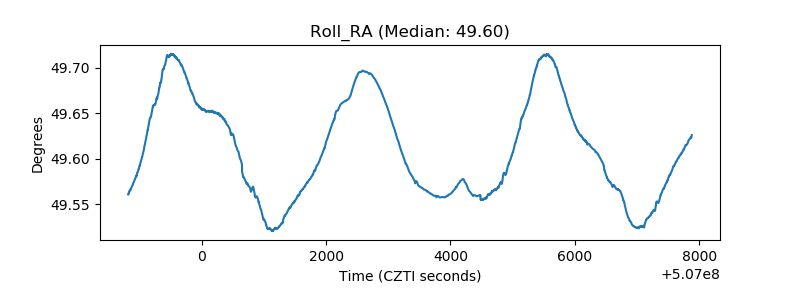 |
| Veto Counter | 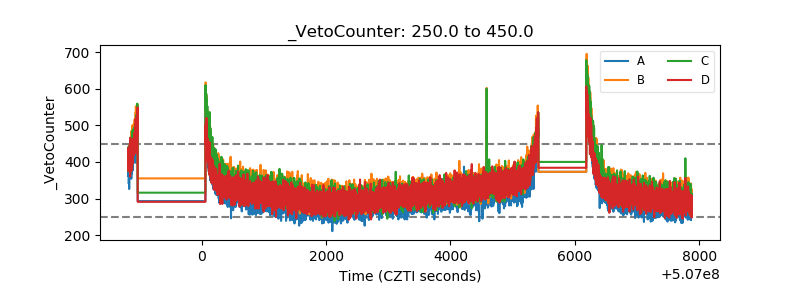 |