| Param | Original file | Final file |
|---|---|---|
| Filename | modeM0/AS1A14_030T02_9000006544_55871cztM0_level2.fits | modeM0/AS1A14_030T02_9000006544_55871cztM0_level2_quad_clean.evt |
| Size (bytes) | 754,441,920 | 102,346,560 |
| Size | 719.5 MB | 97.6 MB |
| Events in quadrant A | 8,118,141 | 638,318 |
| Events in quadrant B | 4,645,003 | 698,610 |
| Events in quadrant C | 5,176,894 | 651,964 |
| Events in quadrant D | 9,374,332 | 560,175 |
| Mode SS | |||
|---|---|---|---|
| Quadrant | BADHDUFLAG | Total packets | Discarded packets |
| A | 0 | 158 | 0 |
| B | 0 | 158 | 0 |
| C | 0 | 158 | 0 |
| D | 0 | 158 | 0 |
| Mode M9 | |||
|---|---|---|---|
| Quadrant | BADHDUFLAG | Total packets | Discarded packets |
| A | 0 | 3 | 0 |
| B | 0 | 4 | 0 |
| C | 0 | 4 | 0 |
| D | 0 | 4 | 0 |
| Mode M0 | |||
|---|---|---|---|
| Quadrant | BADHDUFLAG | Total packets | Discarded packets |
| A | 0 | 29590 | 1 |
| B | 0 | 19934 | 1 |
| C | 0 | 21270 | 1 |
| D | 0 | 33326 | 1 |
| Quadrant | Total seconds | Saturated seconds | Saturation percentage |
|---|---|---|---|
| A | 7907 | 1279 | 16.175541% |
| B | 7906 | 917 | 11.598786% |
| C | 7906 | 744 | 9.410574% |
| D | 7906 | 1384 | 17.505692% |
Noise dominated data is calculated using 1-second bins in cleaned event files. If a bin has >2000 counts, and if more than 50% of those come from <1% of pixels, then it is considered to be noise-dominated and hence unusable.
| Quadrant | # 1 sec bins | Bins with >0 counts | Bins with >2000 counts | High rate bins dominated by noise | Noise dominated (total time) | Noise dominated (detector-on time) | Marked lightcurve |
|---|---|---|---|---|---|---|---|
| A | 7907 | 7907 | 1190 | 1190 | 15.05% | 15.05% | 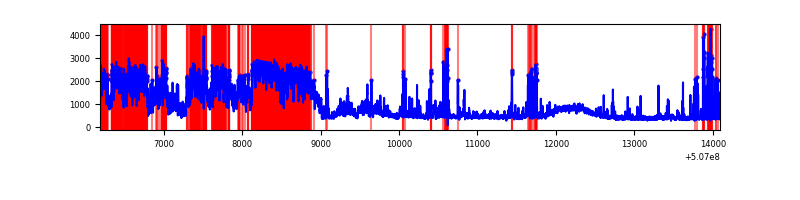 |
| B | 7906 | 7906 | 288 | 288 | 3.64% | 3.64% | 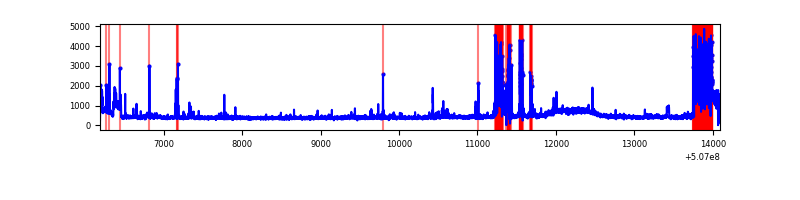 |
| C | 7906 | 7906 | 370 | 370 | 4.68% | 4.68% | 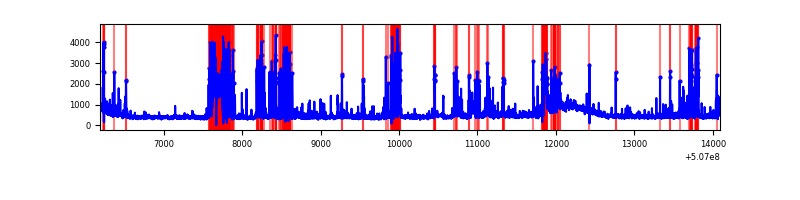 |
| D | 7906 | 7906 | 1252 | 1252 | 15.84% | 15.84% | 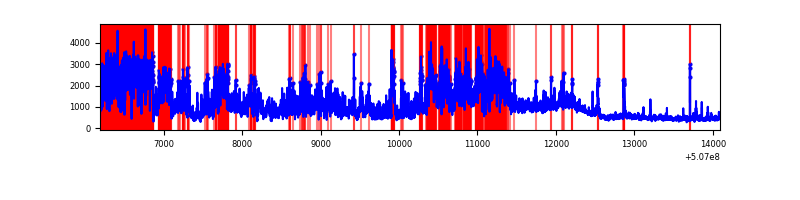 |
Top three noisy pixels from each quadrant. If the there are fewer than three noisy pixels in the level2.evt file, extra rows are filled as -1
| Pixel properties | Quadrant properties | ||||||
|---|---|---|---|---|---|---|---|
| Quadrant | DetID | PixID | Counts | Sigma | Mean | Median | Sigma |
| A | 12 | 115 | 4005627 | 20010.45 | 819 | 795 | 200.1 |
| A | 7 | 64 | 297907 | 1484.54 | 819 | 795 | 200.1 |
| A | 8 | 249 | 227720 | 1133.85 | 819 | 795 | 200.1 |
| B | 5 | 172 | 1294943 | 7496.49 | 800 | 768 | 172.6 |
| B | 4 | 21 | 45565 | 259.48 | 800 | 768 | 172.6 |
| B | 7 | 252 | 33374 | 188.87 | 800 | 768 | 172.6 |
| C | 15 | 199 | 1307456 | 6049.6 | 797 | 788 | 216.0 |
| C | 12 | 252 | 240640 | 1110.46 | 797 | 788 | 216.0 |
| C | 6 | 223 | 158448 | 729.93 | 797 | 788 | 216.0 |
| D | 2 | 62 | 4655145 | 21472.88 | 773 | 739 | 216.8 |
| D | 15 | 125 | 1022538 | 4714.02 | 773 | 739 | 216.8 |
| D | 11 | 129 | 224066 | 1030.31 | 773 | 739 | 216.8 |
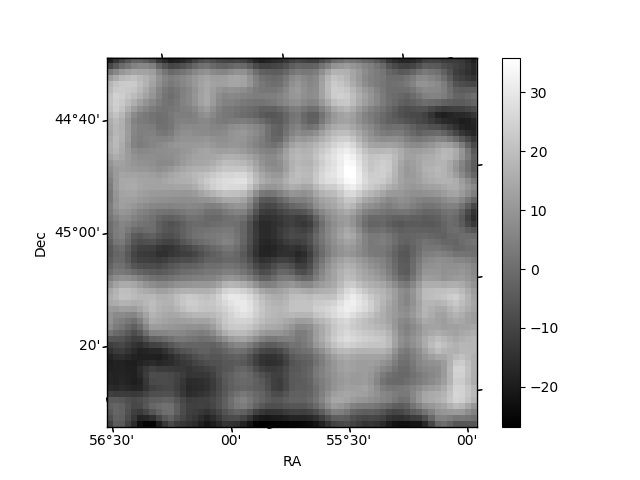
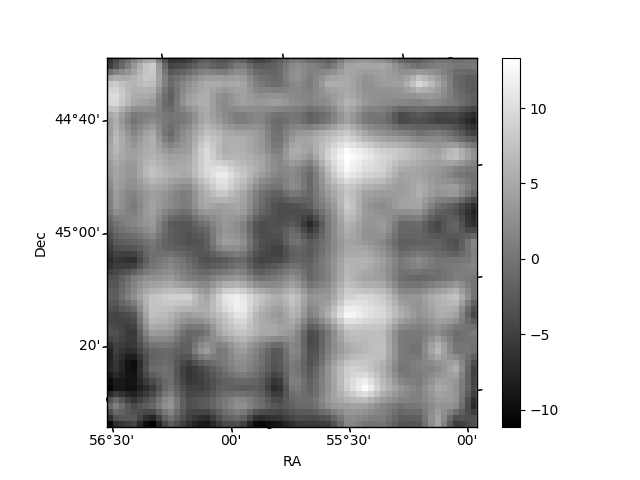
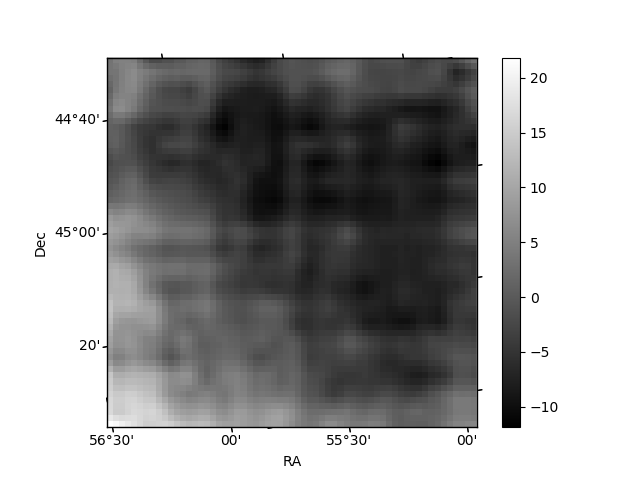
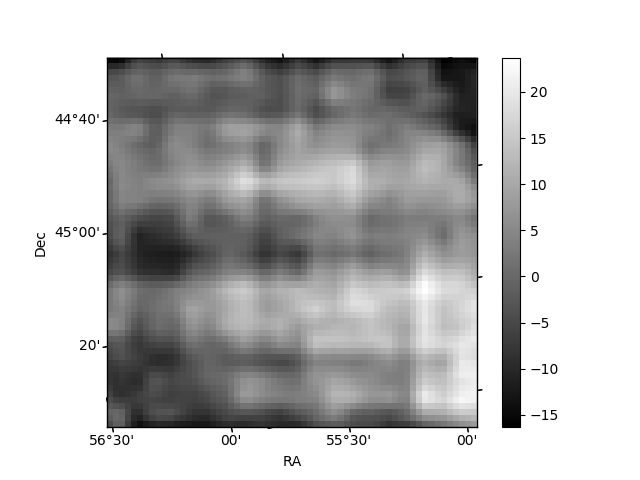
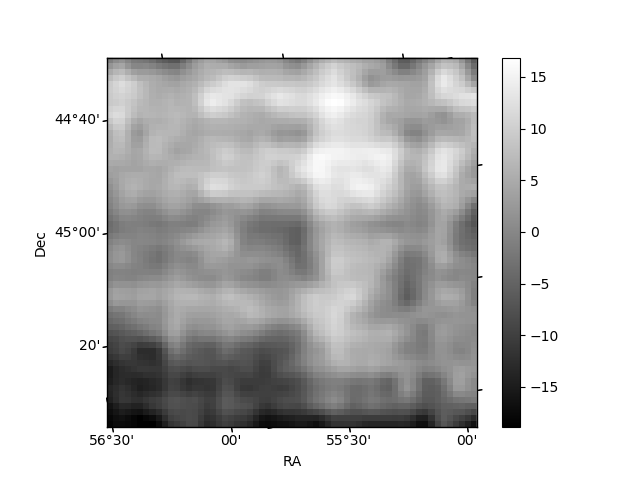
Histogram calculated using DETX and DETY for each event in the final _common_clean file
| Quadrant A | 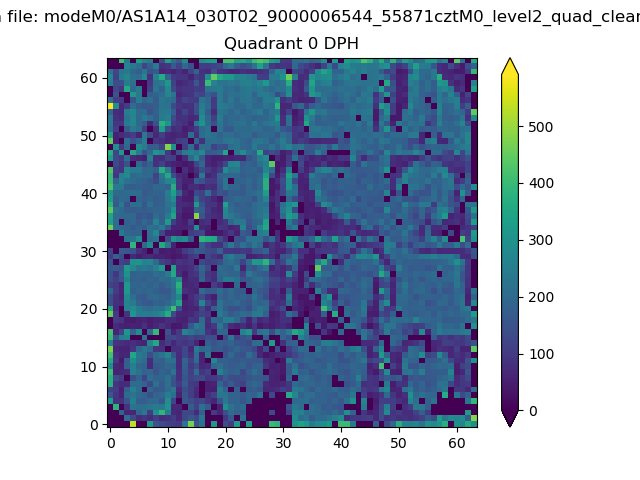 |
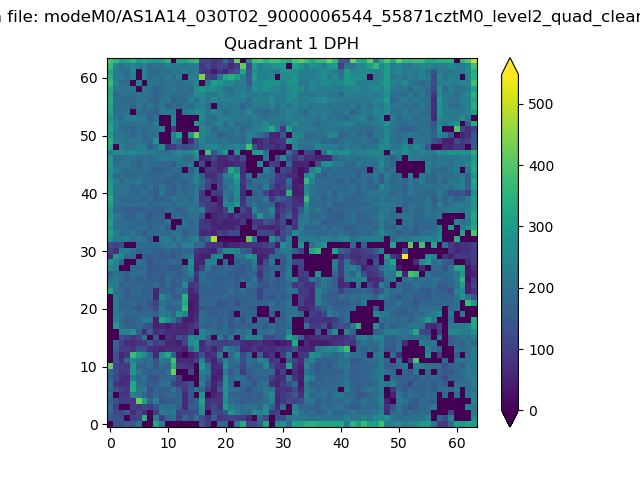 |
Quadrant B |
|---|---|---|---|
| Quadrant D | 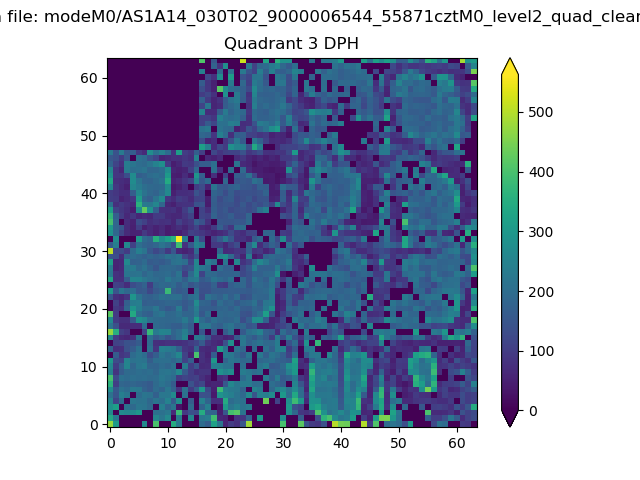 |
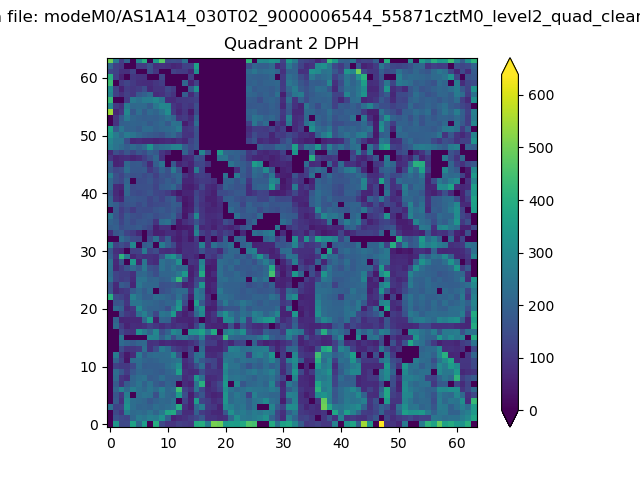 |
Quadrant C |
| Plot type | Count rate plots | Images |
|---|---|---|
| Comparison with Poisson distribution Blue bars denote a histogram of data divided into 1 sec bins. Red curve is a Poisson curve with rate = median count rate of data. |
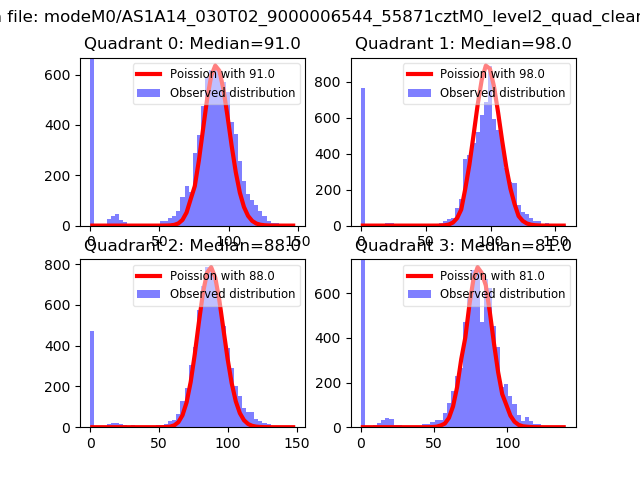 |
 |
| Quadrant-wise count rates Data is divided into 100 sec bins |
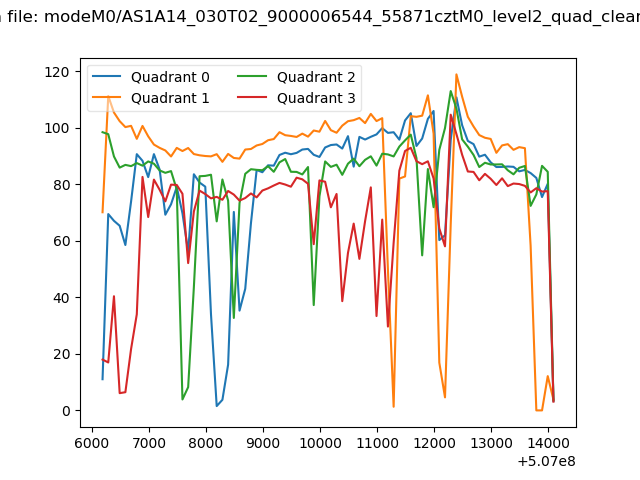 |
|
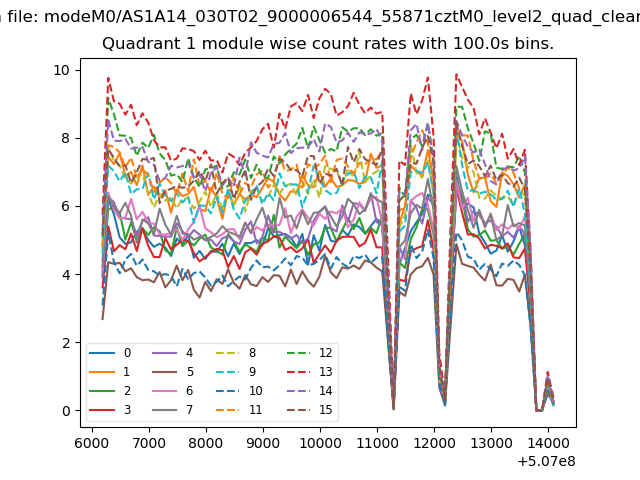
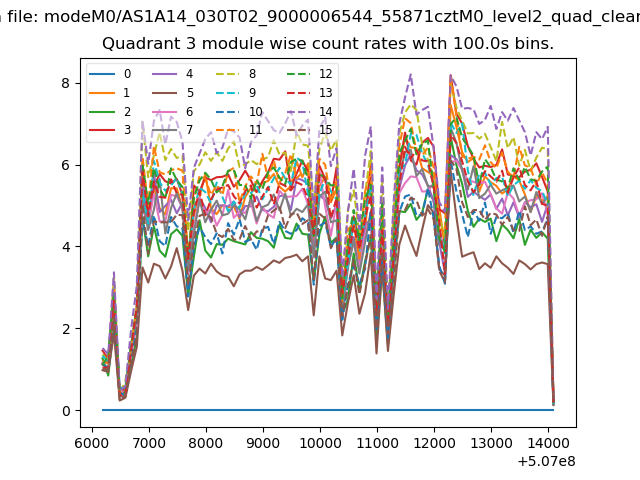
| Module-wise count rates for Quadrant A Data is divided into 100 sec bins |
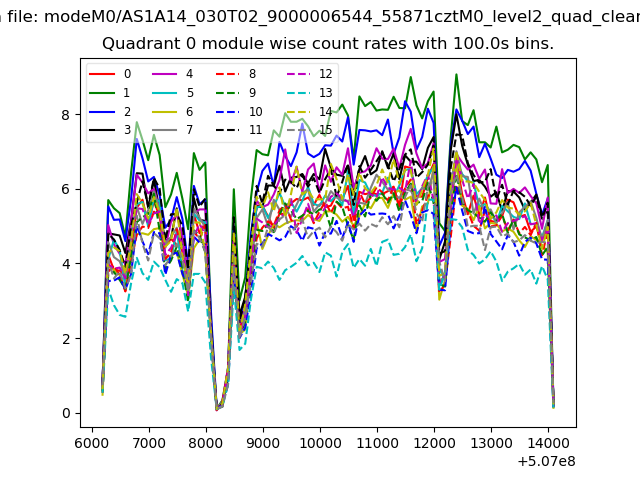 |
 |
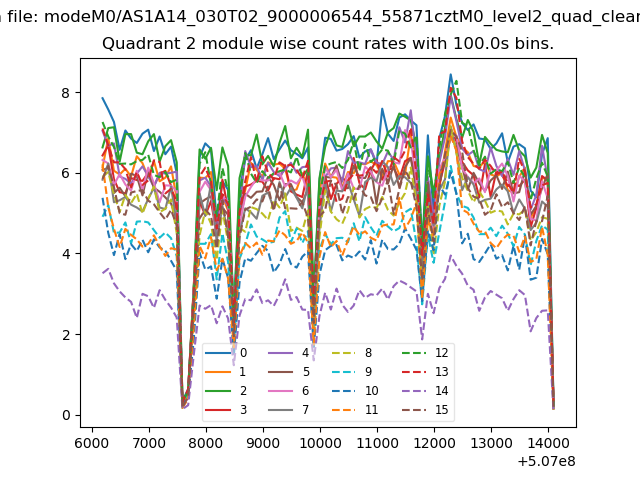
| Module-wise count rates for Quadrant B Data is divided into 100 sec bins |
 |
 |
| Module-wise count rates for Quadrant C Data is divided into 100 sec bins |
 |
 |
| Module-wise count rates for Quadrant D Data is divided into 100 sec bins |
 |
 |
| Parameter | Plot |
|---|---|
| CZT HV Monitor | 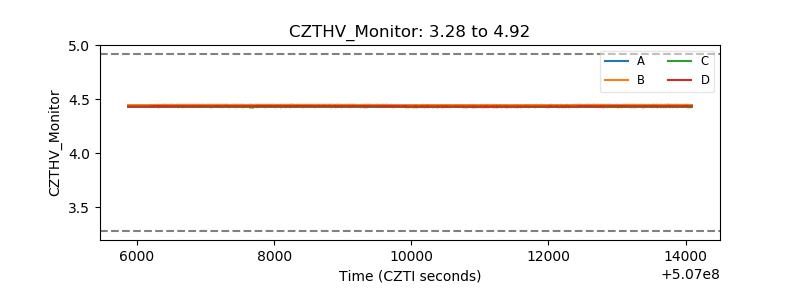 |
| D_VDD | 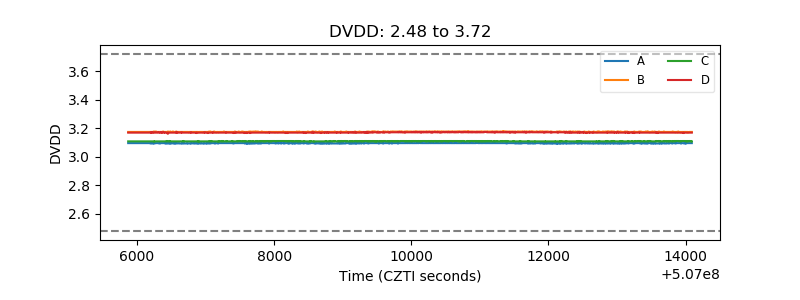 |
| Temperature 1 | 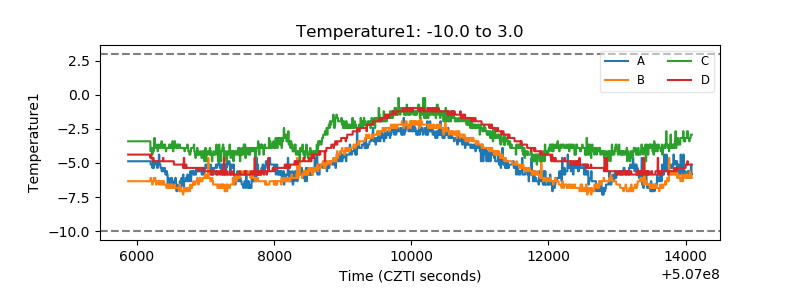 |
| Veto HV Monitor | 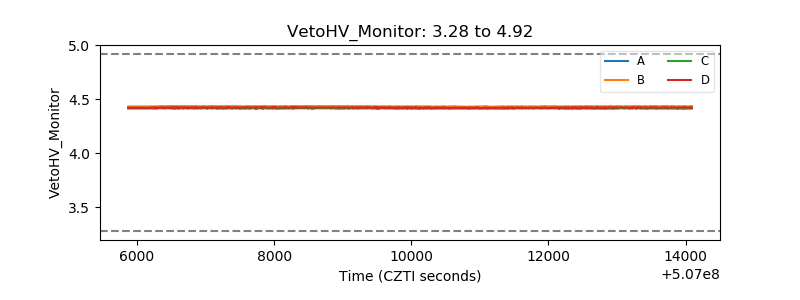 |
| Veto LLD | 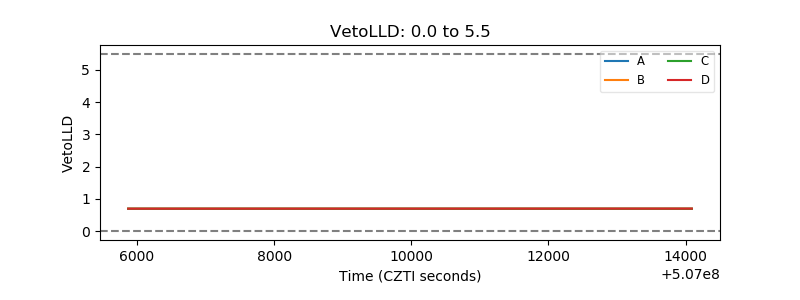 |
| Alpha Counter | 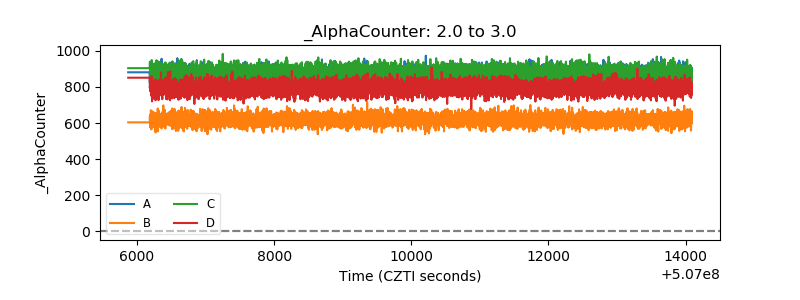 |
| _CPM_Rate | 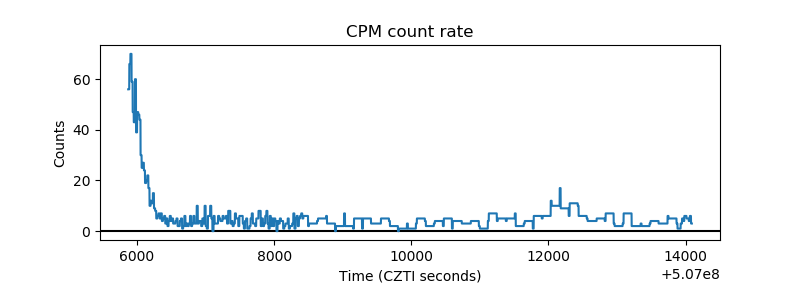 |
| CZT Counter | 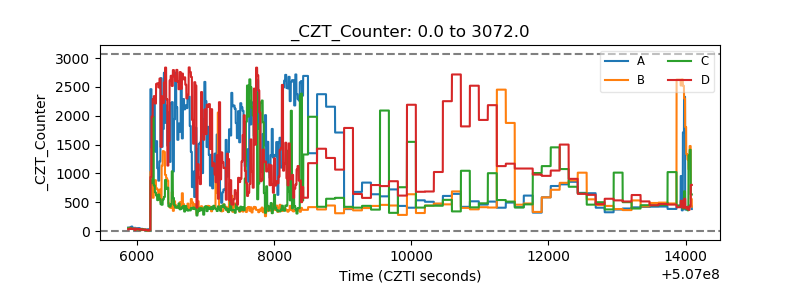 |
| +2.5 Volts monitor |  |
| +5 Volts monitor |  |
| _ROLL_ROT | 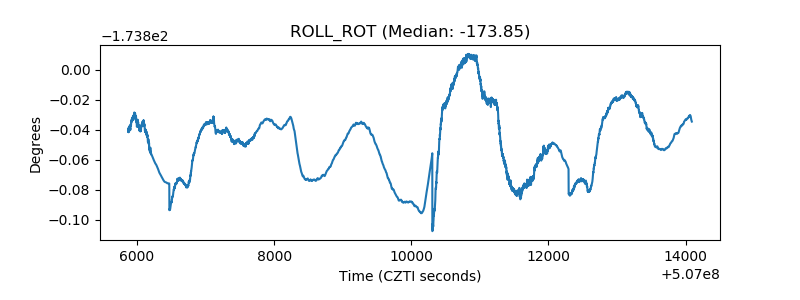 |
| _Roll_DEC | 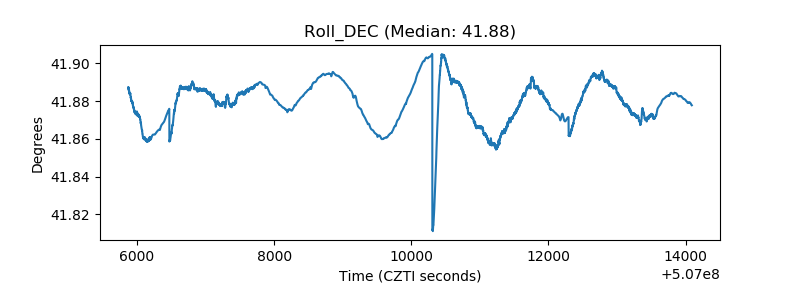 |
| _Roll_RA | 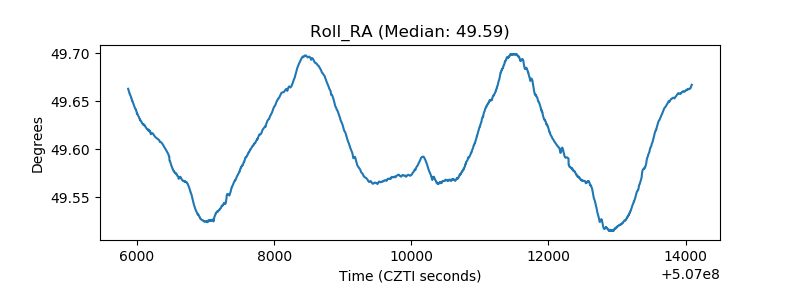 |
| Veto Counter | 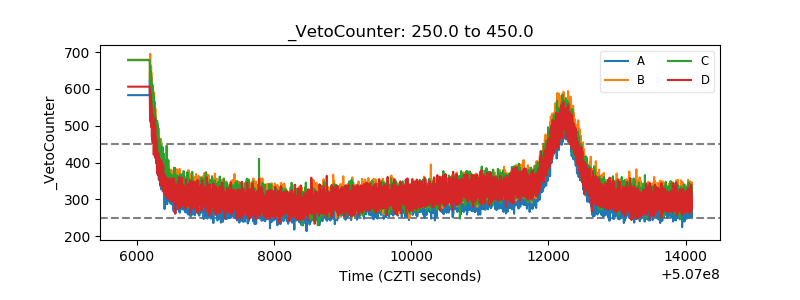 |