| Param | Original file | Final file |
|---|---|---|
| Filename | modeM0/AS1A14_030T02_9000006544_55872cztM0_level2.fits | modeM0/AS1A14_030T02_9000006544_55872cztM0_level2_quad_clean.evt |
| Size (bytes) | 534,487,680 | 105,886,080 |
| Size | 509.7 MB | 101.0 MB |
| Events in quadrant A | 3,922,519 | 692,220 |
| Events in quadrant B | 4,159,170 | 718,115 |
| Events in quadrant C | 4,670,835 | 647,947 |
| Events in quadrant D | 6,432,885 | 610,926 |
| Mode SS | |||
|---|---|---|---|
| Quadrant | BADHDUFLAG | Total packets | Discarded packets |
| A | 0 | 154 | 0 |
| B | 0 | 154 | 0 |
| C | 0 | 154 | 0 |
| D | 0 | 154 | 0 |
| Mode M0 | |||
|---|---|---|---|
| Quadrant | BADHDUFLAG | Total packets | Discarded packets |
| A | 0 | 17143 | 0 |
| B | 0 | 18153 | 0 |
| C | 0 | 19634 | 0 |
| D | 0 | 24318 | 0 |
| Quadrant | Total seconds | Saturated seconds | Saturation percentage |
|---|---|---|---|
| A | 7719 | 108 | 1.399145% |
| B | 7719 | 380 | 4.922917% |
| C | 7719 | 390 | 5.052468% |
| D | 7719 | 391 | 5.065423% |
Noise dominated data is calculated using 1-second bins in cleaned event files. If a bin has >2000 counts, and if more than 50% of those come from <1% of pixels, then it is considered to be noise-dominated and hence unusable.
| Quadrant | # 1 sec bins | Bins with >0 counts | Bins with >2000 counts | High rate bins dominated by noise | Noise dominated (total time) | Noise dominated (detector-on time) | Marked lightcurve |
|---|---|---|---|---|---|---|---|
| A | 7719 | 7719 | 89 | 89 | 1.15% | 1.15% | 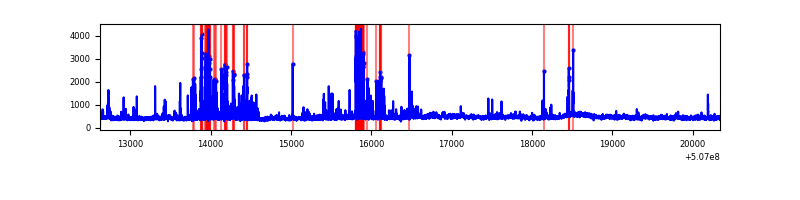 |
| B | 7719 | 7719 | 187 | 187 | 2.42% | 2.42% | 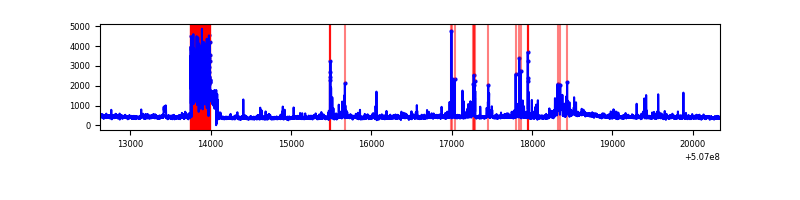 |
| C | 7719 | 7719 | 301 | 301 | 3.90% | 3.90% | 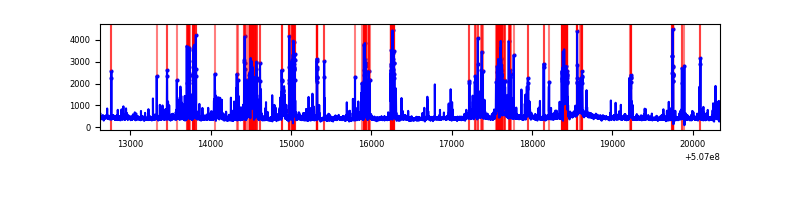 |
| D | 7719 | 7719 | 352 | 352 | 4.56% | 4.56% | 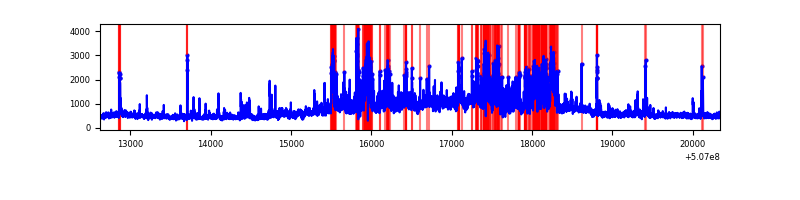 |
Top three noisy pixels from each quadrant. If the there are fewer than three noisy pixels in the level2.evt file, extra rows are filled as -1
| Pixel properties | Quadrant properties | ||||||
|---|---|---|---|---|---|---|---|
| Quadrant | DetID | PixID | Counts | Sigma | Mean | Median | Sigma |
| A | 8 | 249 | 488592 | 2527.89 | 778 | 755 | 193.0 |
| A | 7 | 64 | 136982 | 705.9 | 778 | 755 | 193.0 |
| A | 4 | 3 | 60298 | 308.54 | 778 | 755 | 193.0 |
| B | 5 | 172 | 865353 | 5323.07 | 754 | 726 | 162.4 |
| B | 4 | 21 | 117997 | 721.98 | 754 | 726 | 162.4 |
| B | 0 | 153 | 85427 | 521.46 | 754 | 726 | 162.4 |
| C | 15 | 199 | 1000714 | 4914.75 | 747 | 741 | 203.5 |
| C | 12 | 252 | 248056 | 1215.52 | 747 | 741 | 203.5 |
| C | 12 | 254 | 188639 | 923.49 | 747 | 741 | 203.5 |
| D | 2 | 62 | 1766750 | 8410.83 | 745 | 714 | 210.0 |
| D | 11 | 129 | 865708 | 4119.58 | 745 | 714 | 210.0 |
| D | 15 | 125 | 302724 | 1438.34 | 745 | 714 | 210.0 |
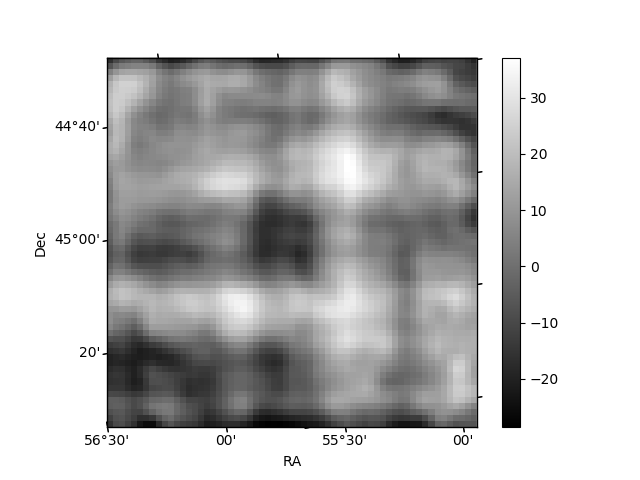
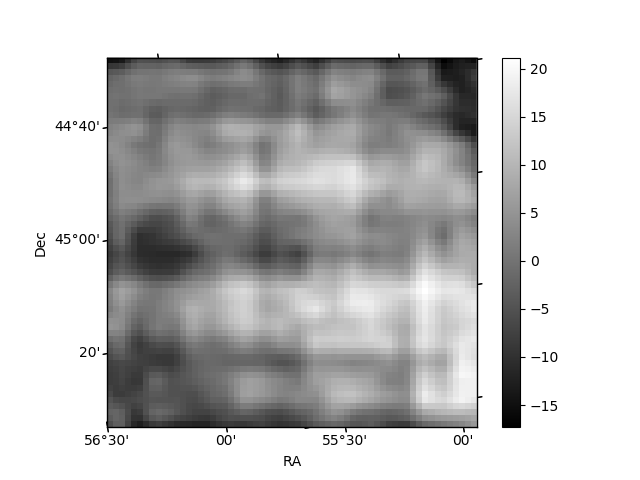
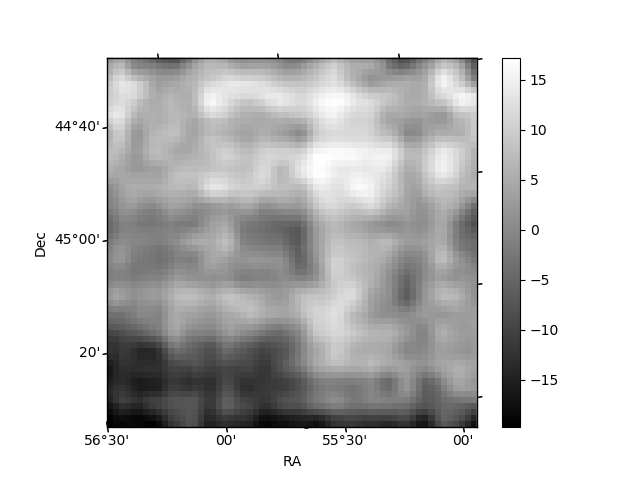
Histogram calculated using DETX and DETY for each event in the final _common_clean file
| Quadrant A | 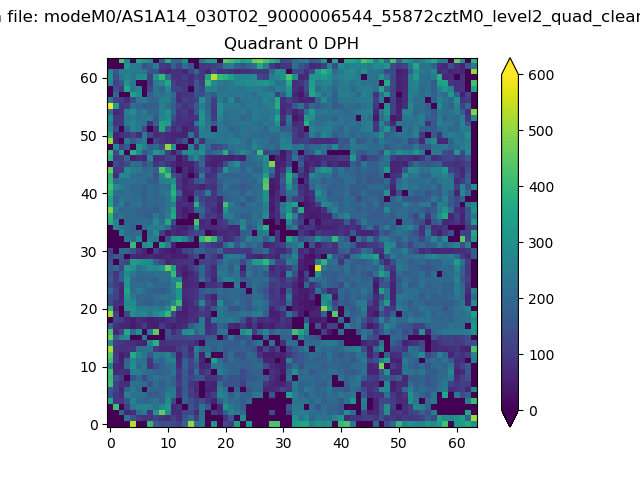 |
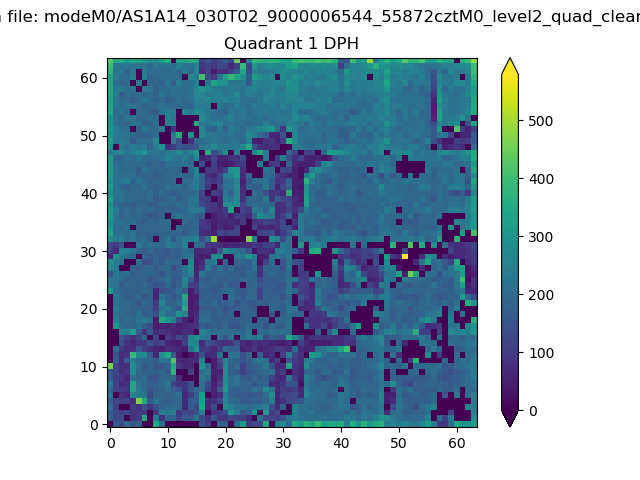 |
Quadrant B |
|---|---|---|---|
| Quadrant D | 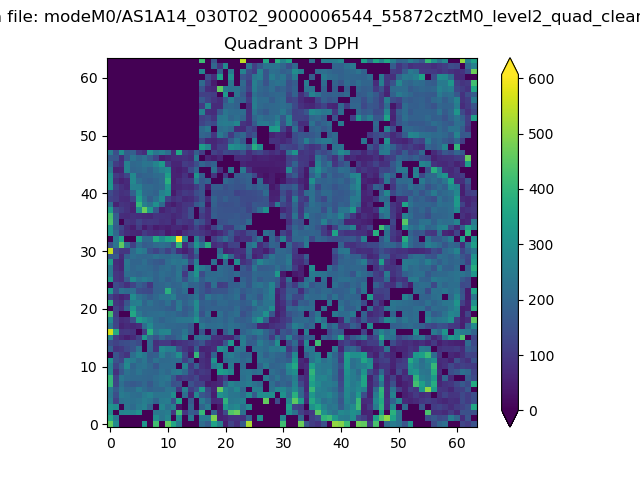 |
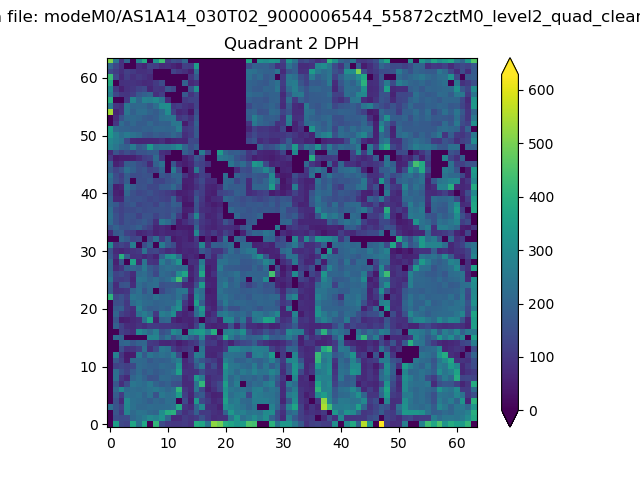 |
Quadrant C |
| Plot type | Count rate plots | Images |
|---|---|---|
| Comparison with Poisson distribution Blue bars denote a histogram of data divided into 1 sec bins. Red curve is a Poisson curve with rate = median count rate of data. |
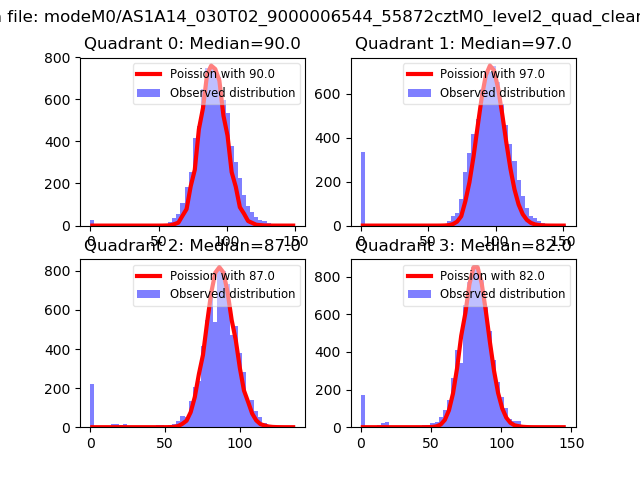 |
 |
| Quadrant-wise count rates Data is divided into 100 sec bins |
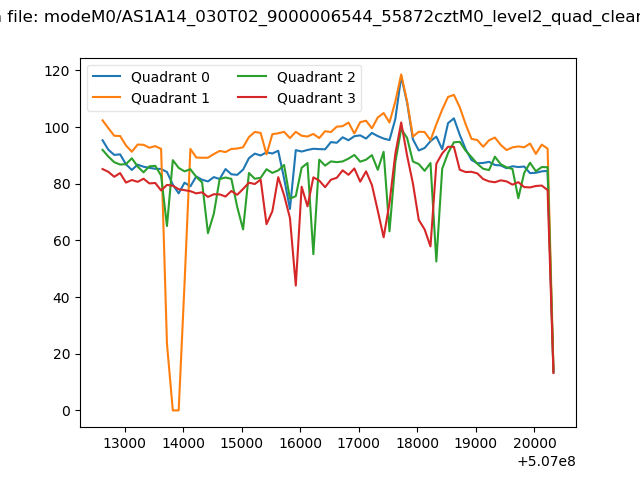 |
|
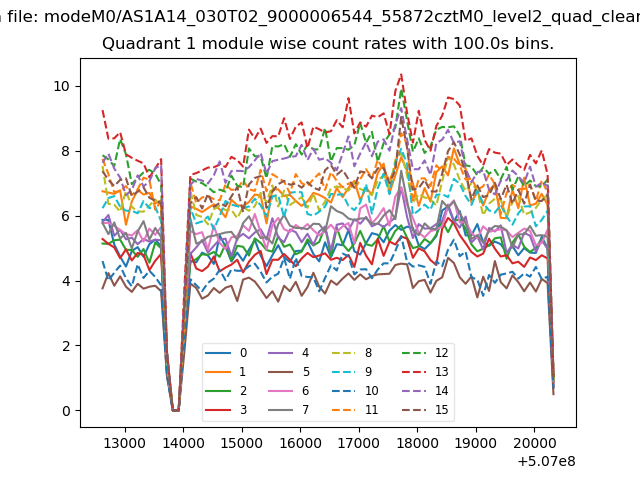
| Module-wise count rates for Quadrant A Data is divided into 100 sec bins |
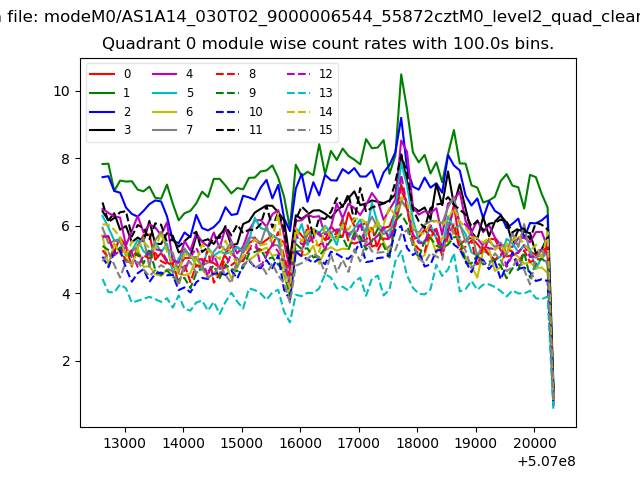 |
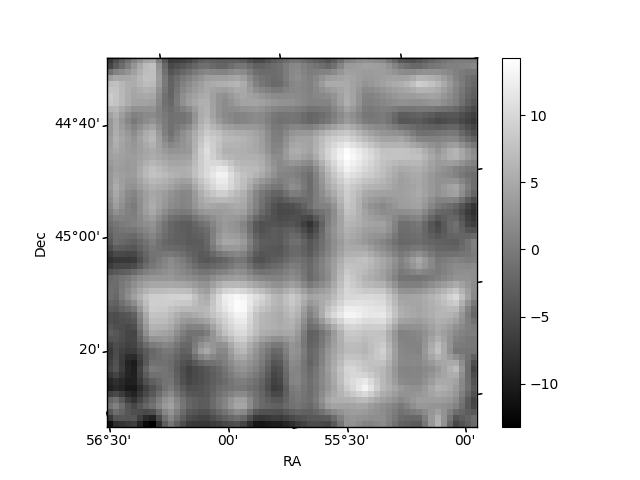 |
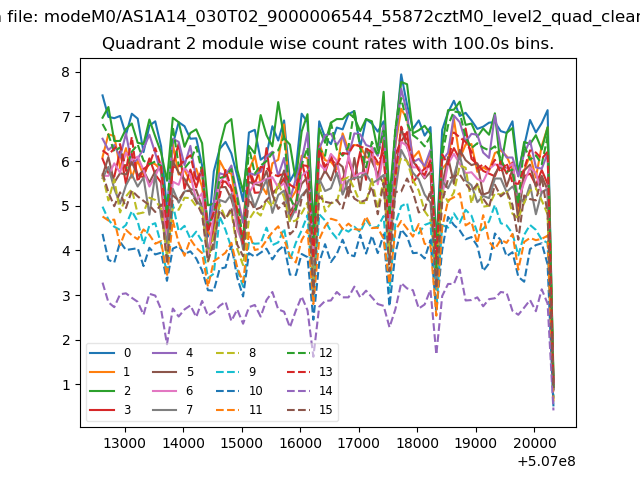
| Module-wise count rates for Quadrant B Data is divided into 100 sec bins |
 |
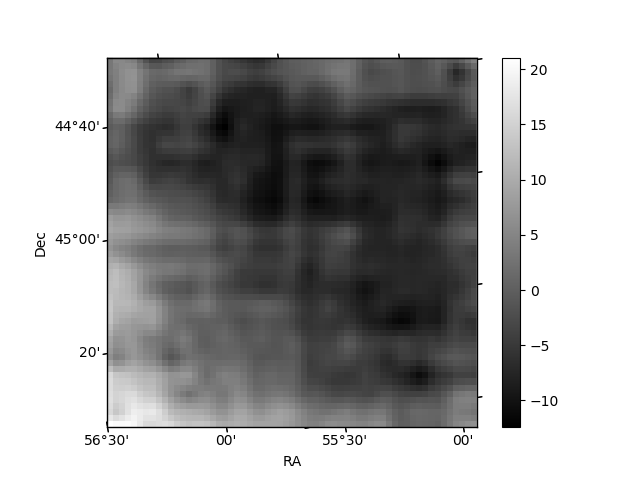 |
| Module-wise count rates for Quadrant C Data is divided into 100 sec bins |
 |
 |
| Module-wise count rates for Quadrant D Data is divided into 100 sec bins |
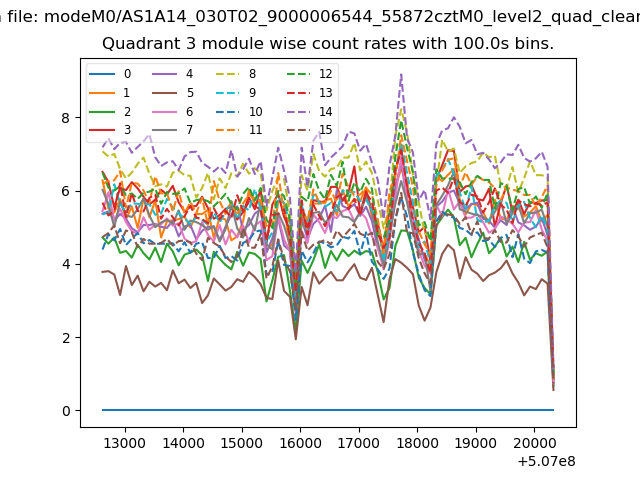 |
 |
| Parameter | Plot |
|---|---|
| CZT HV Monitor | 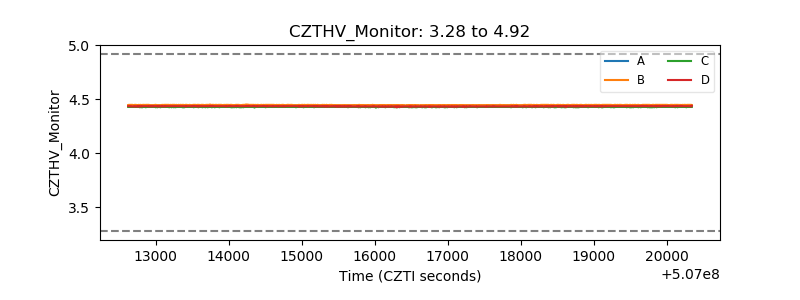 |
| D_VDD | 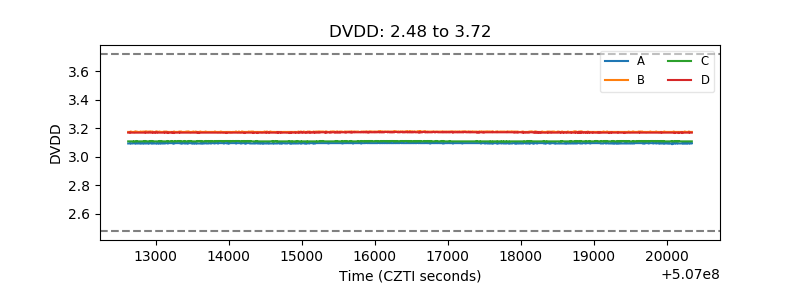 |
| Temperature 1 | 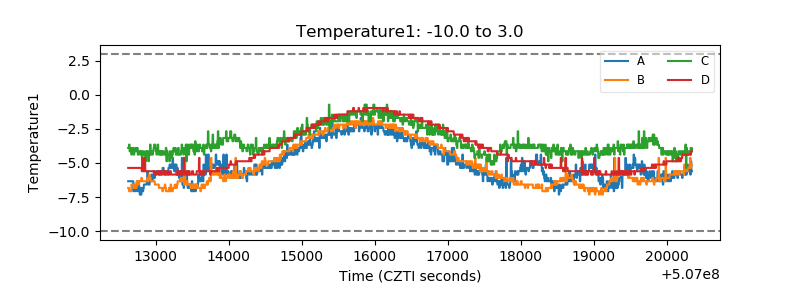 |
| Veto HV Monitor | 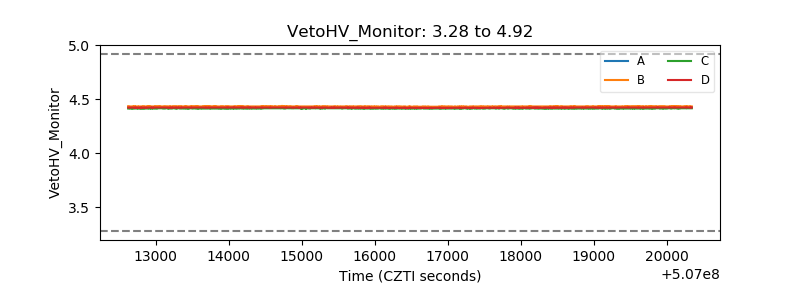 |
| Veto LLD | 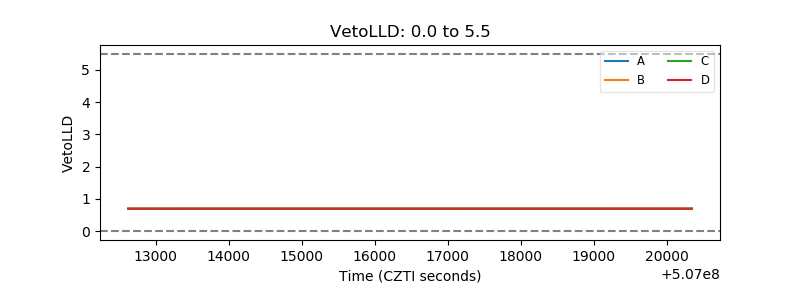 |
| Alpha Counter | 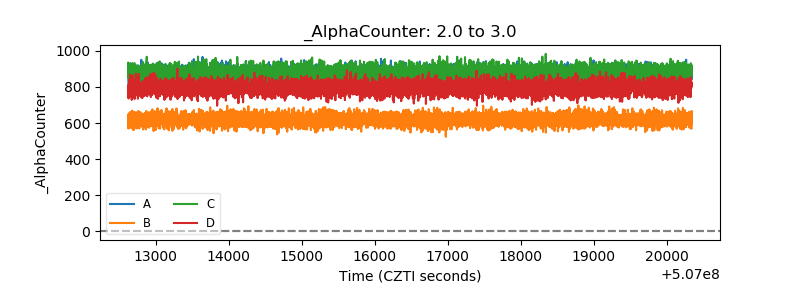 |
| _CPM_Rate | 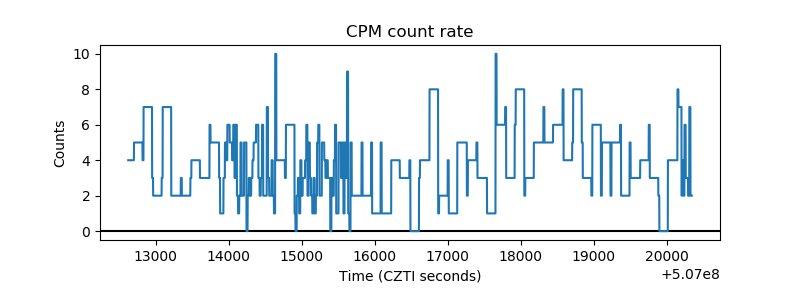 |
| CZT Counter | 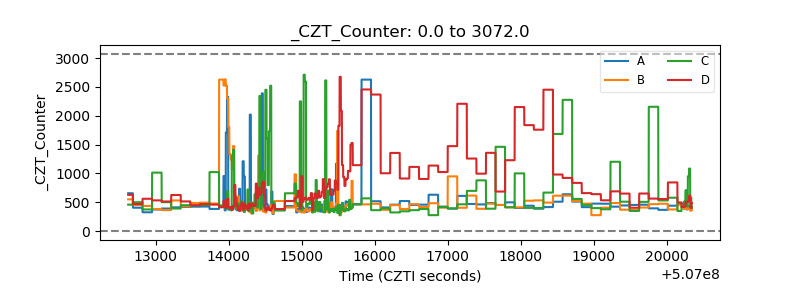 |
| +2.5 Volts monitor |  |
| +5 Volts monitor |  |
| _ROLL_ROT | 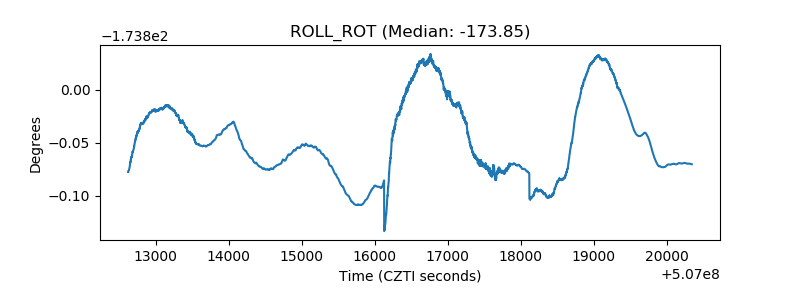 |
| _Roll_DEC | 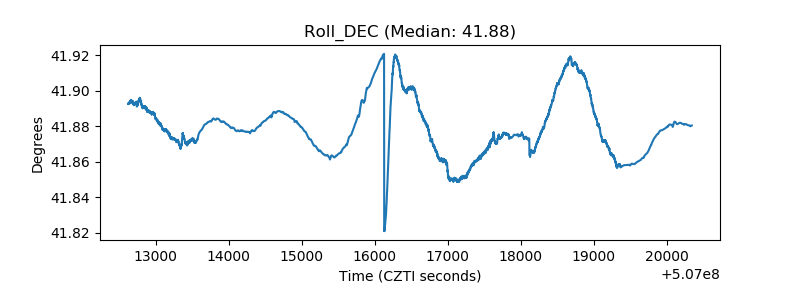 |
| _Roll_RA | 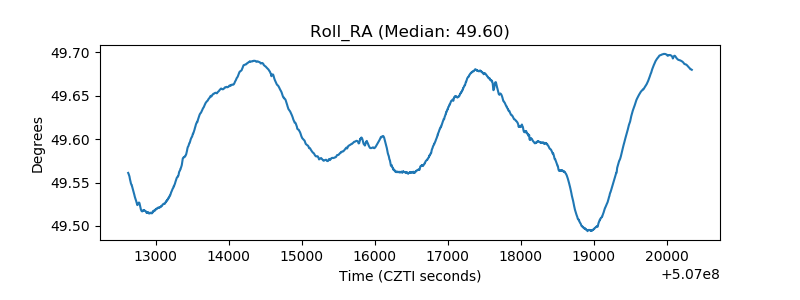 |
| Veto Counter | 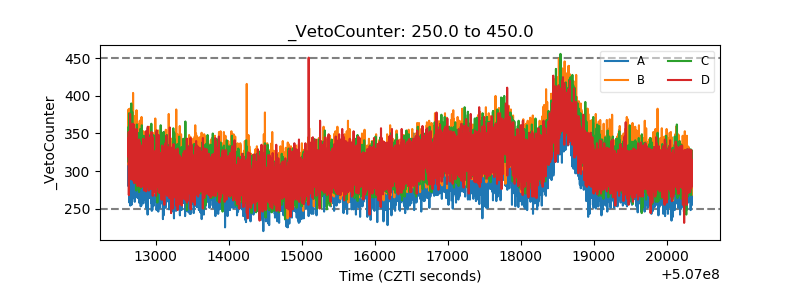 |