| Param | Original file | Final file |
|---|---|---|
| Filename | modeM0/AS1A14_030T02_9000006544_55873cztM0_level2.fits | modeM0/AS1A14_030T02_9000006544_55873cztM0_level2_quad_clean.evt |
| Size (bytes) | 512,280,000 | 112,178,880 |
| Size | 488.5 MB | 107.0 MB |
| Events in quadrant A | 3,982,969 | 726,498 |
| Events in quadrant B | 3,604,691 | 787,584 |
| Events in quadrant C | 5,064,859 | 674,762 |
| Events in quadrant D | 5,684,457 | 647,920 |
| Mode SS | |||
|---|---|---|---|
| Quadrant | BADHDUFLAG | Total packets | Discarded packets |
| A | 0 | 160 | 0 |
| B | 0 | 160 | 0 |
| C | 0 | 160 | 0 |
| D | 0 | 160 | 0 |
| Mode M0 | |||
|---|---|---|---|
| Quadrant | BADHDUFLAG | Total packets | Discarded packets |
| A | 0 | 17678 | 0 |
| B | 0 | 16764 | 0 |
| C | 0 | 21022 | 0 |
| D | 0 | 22439 | 0 |
| Quadrant | Total seconds | Saturated seconds | Saturation percentage |
|---|---|---|---|
| A | 8058 | 53 | 0.657731% |
| B | 8058 | 49 | 0.608091% |
| C | 8058 | 459 | 5.696203% |
| D | 8058 | 287 | 3.561678% |
Noise dominated data is calculated using 1-second bins in cleaned event files. If a bin has >2000 counts, and if more than 50% of those come from <1% of pixels, then it is considered to be noise-dominated and hence unusable.
| Quadrant | # 1 sec bins | Bins with >0 counts | Bins with >2000 counts | High rate bins dominated by noise | Noise dominated (total time) | Noise dominated (detector-on time) | Marked lightcurve |
|---|---|---|---|---|---|---|---|
| A | 8058 | 8058 | 50 | 50 | 0.62% | 0.62% | 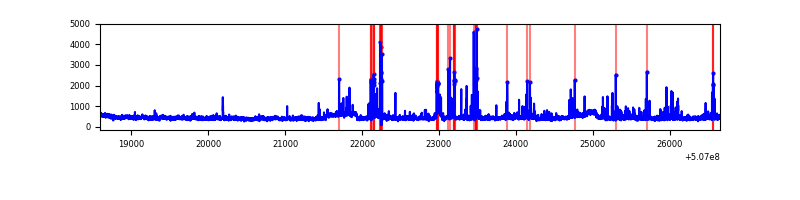 |
| B | 8058 | 8058 | 32 | 32 | 0.40% | 0.40% | 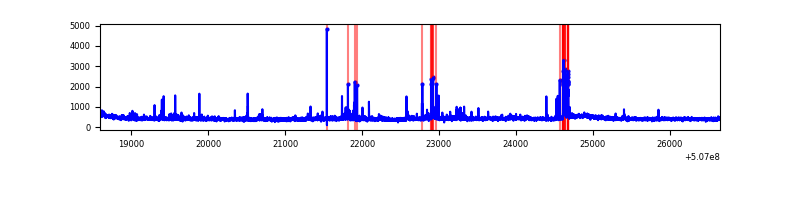 |
| C | 8058 | 8057 | 309 | 309 | 3.83% | 3.84% | 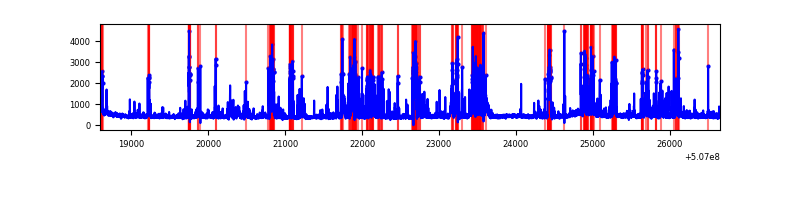 |
| D | 8058 | 8058 | 281 | 281 | 3.49% | 3.49% | 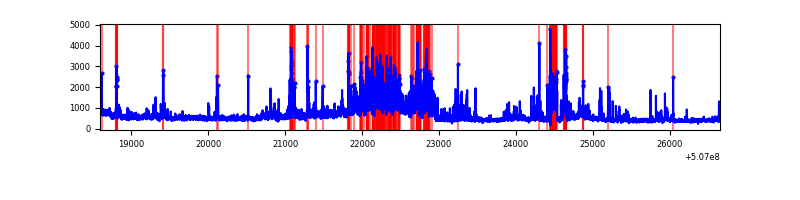 |
Top three noisy pixels from each quadrant. If the there are fewer than three noisy pixels in the level2.evt file, extra rows are filled as -1
| Pixel properties | Quadrant properties | ||||||
|---|---|---|---|---|---|---|---|
| Quadrant | DetID | PixID | Counts | Sigma | Mean | Median | Sigma |
| A | 4 | 249 | 418138 | 2046.5 | 824 | 803 | 203.9 |
| A | 8 | 192 | 97025 | 471.85 | 824 | 803 | 203.9 |
| A | 4 | 78 | 66906 | 324.15 | 824 | 803 | 203.9 |
| B | 4 | 21 | 126208 | 712.3 | 818 | 788 | 176.1 |
| B | 5 | 172 | 125136 | 706.21 | 818 | 788 | 176.1 |
| B | 5 | 185 | 57643 | 322.9 | 818 | 788 | 176.1 |
| C | 15 | 199 | 555732 | 2568.03 | 787 | 780 | 216.1 |
| C | 15 | 218 | 514695 | 2378.14 | 787 | 780 | 216.1 |
| C | 12 | 254 | 223707 | 1031.59 | 787 | 780 | 216.1 |
| D | 2 | 62 | 927472 | 4134.92 | 789 | 756 | 224.1 |
| D | 15 | 125 | 733458 | 3269.25 | 789 | 756 | 224.1 |
| D | 8 | 245 | 334011 | 1486.95 | 789 | 756 | 224.1 |
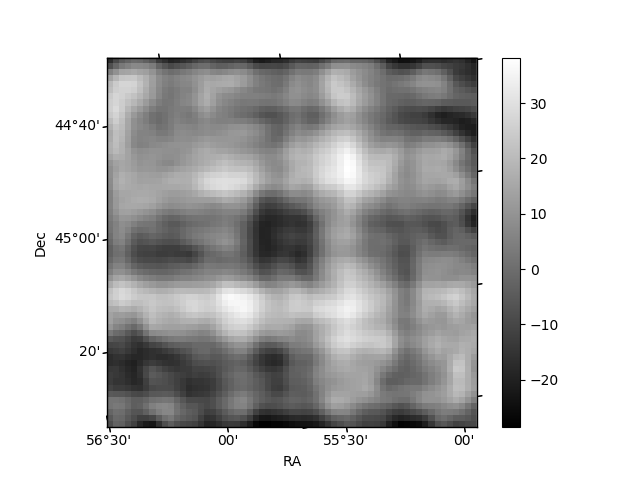
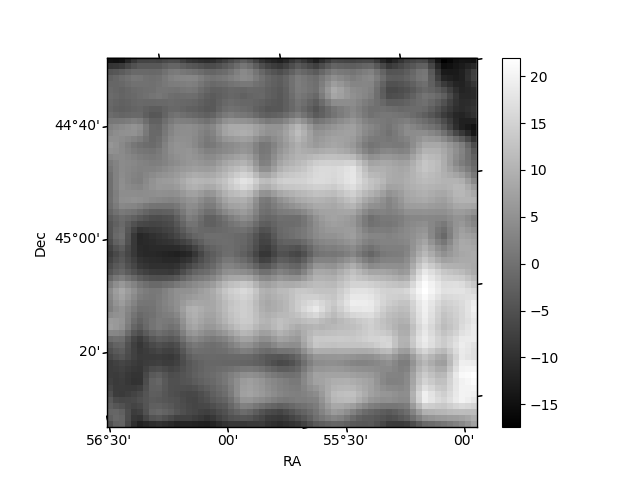
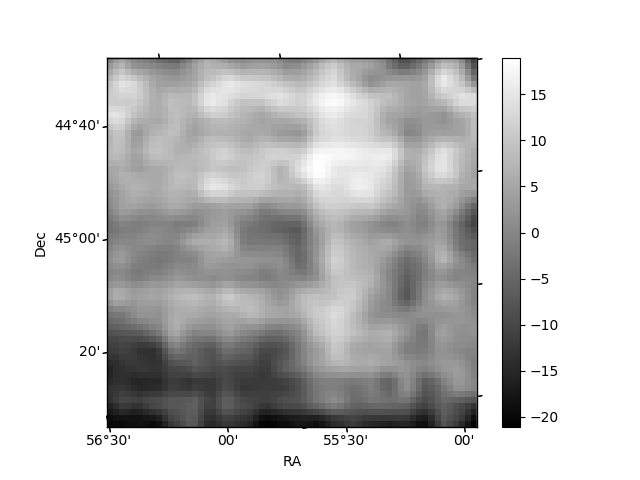
Histogram calculated using DETX and DETY for each event in the final _common_clean file
| Quadrant A | 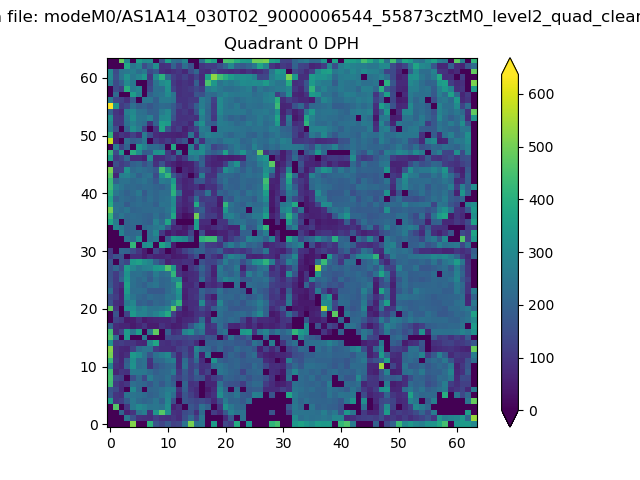 |
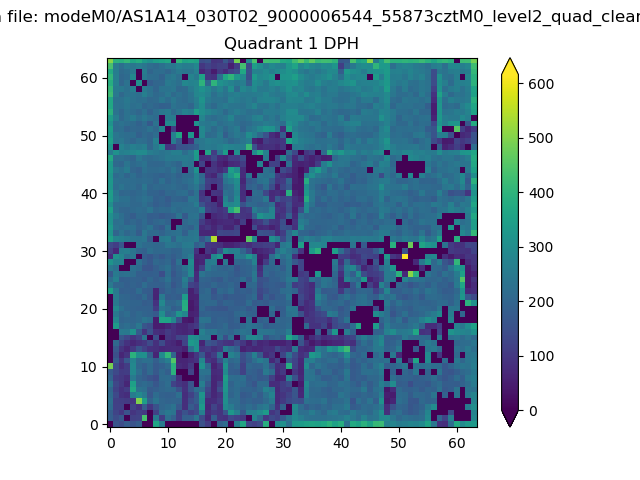 |
Quadrant B |
|---|---|---|---|
| Quadrant D | 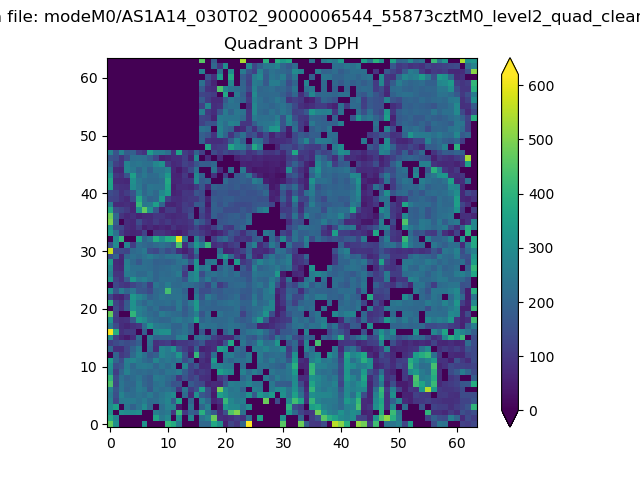 |
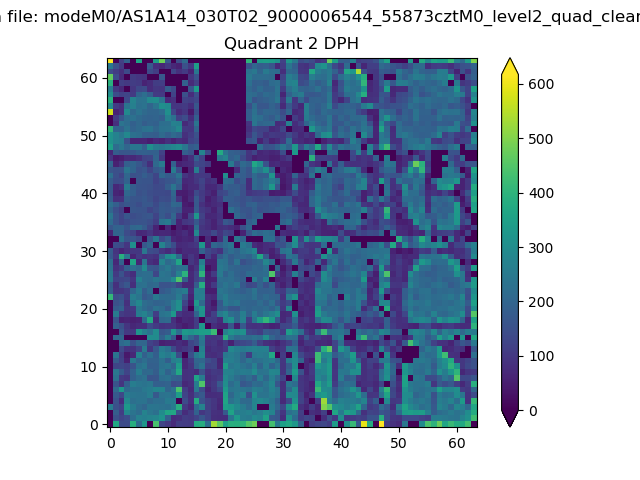 |
Quadrant C |
| Plot type | Count rate plots | Images |
|---|---|---|
| Comparison with Poisson distribution Blue bars denote a histogram of data divided into 1 sec bins. Red curve is a Poisson curve with rate = median count rate of data. |
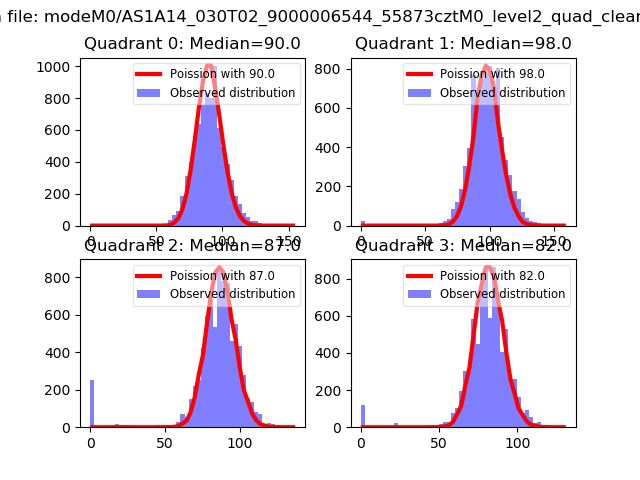 |
 |
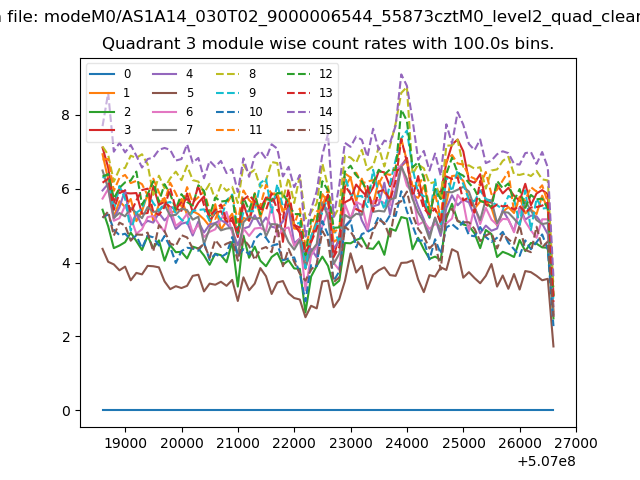
| Quadrant-wise count rates Data is divided into 100 sec bins |
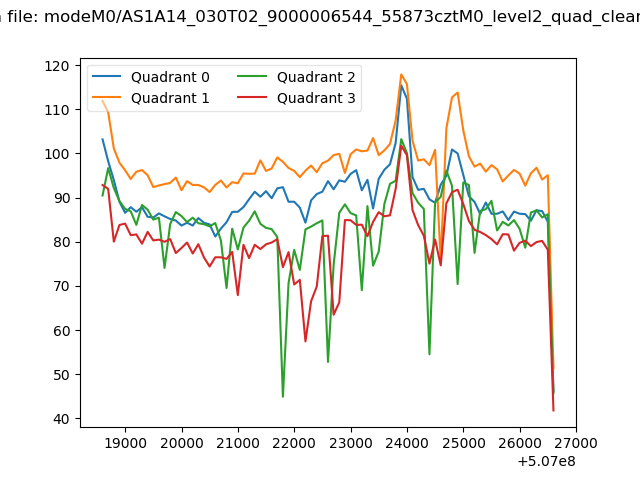 |
|
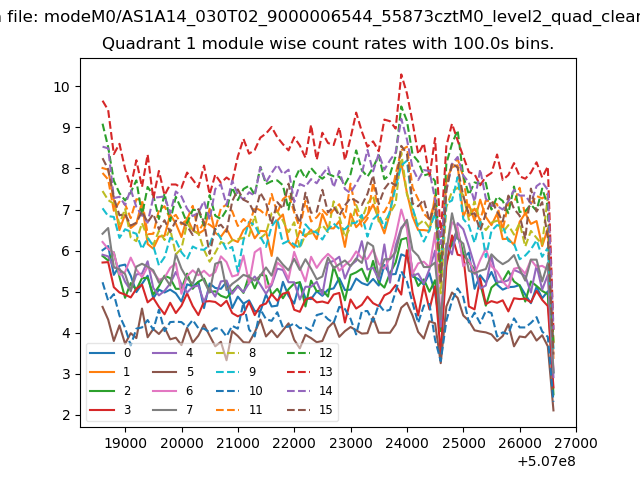
| Module-wise count rates for Quadrant A Data is divided into 100 sec bins |
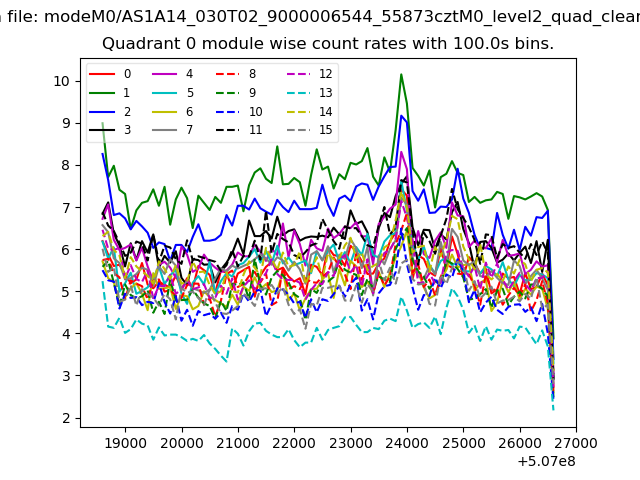 |
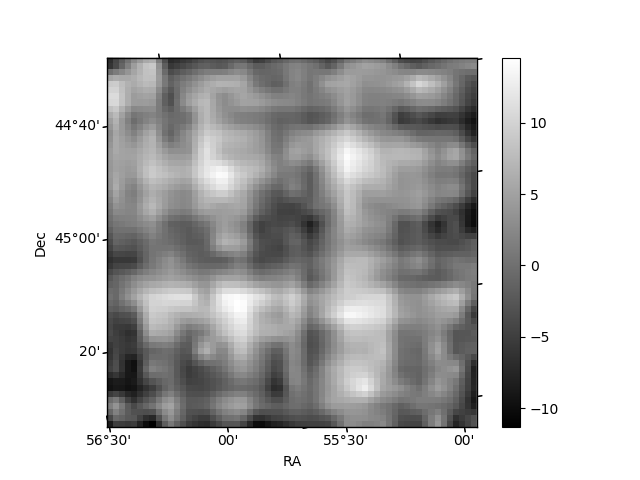 |
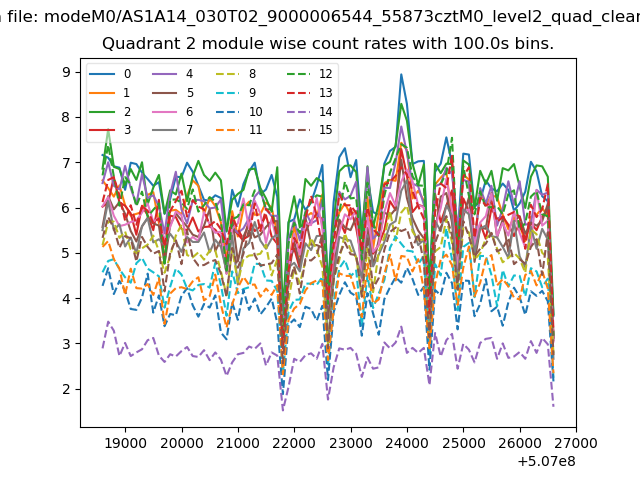
| Module-wise count rates for Quadrant B Data is divided into 100 sec bins |
 |
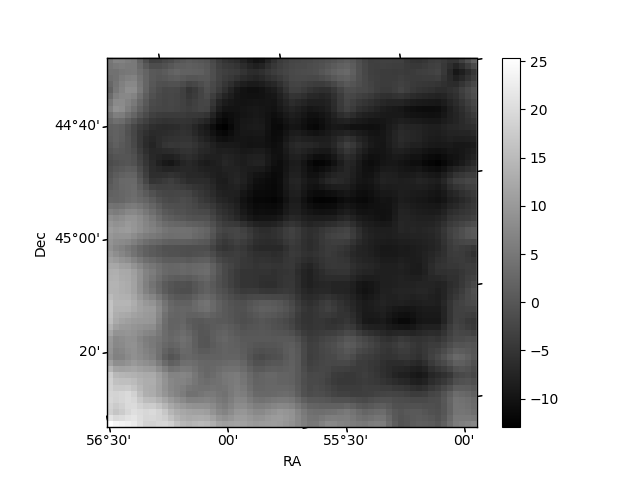 |
| Module-wise count rates for Quadrant C Data is divided into 100 sec bins |
 |
 |
| Module-wise count rates for Quadrant D Data is divided into 100 sec bins |
 |
 |
| Parameter | Plot |
|---|---|
| CZT HV Monitor | 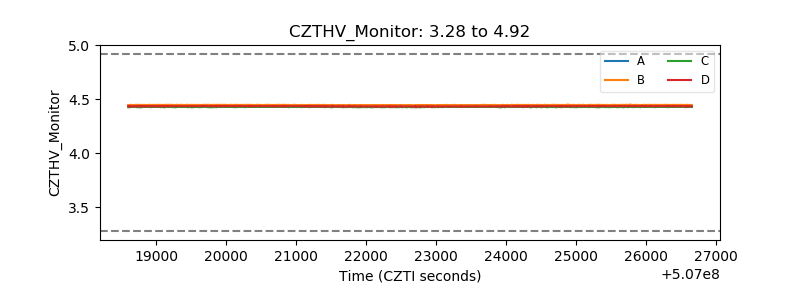 |
| D_VDD | 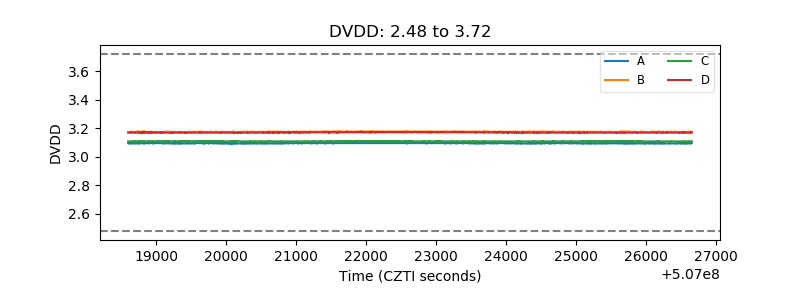 |
| Temperature 1 | 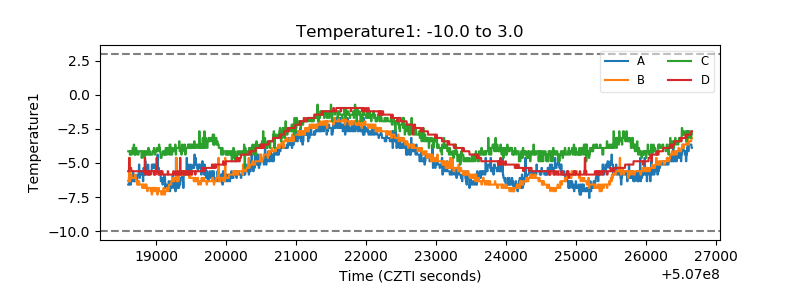 |
| Veto HV Monitor | 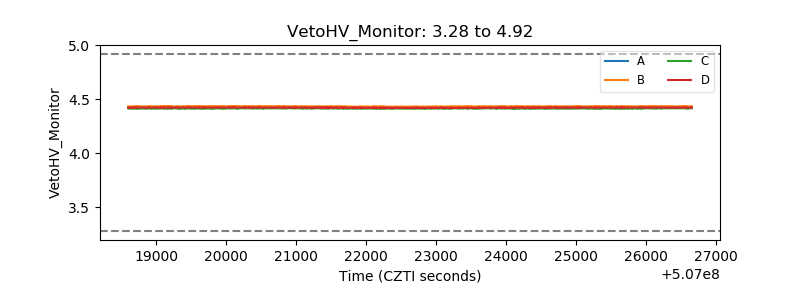 |
| Veto LLD | 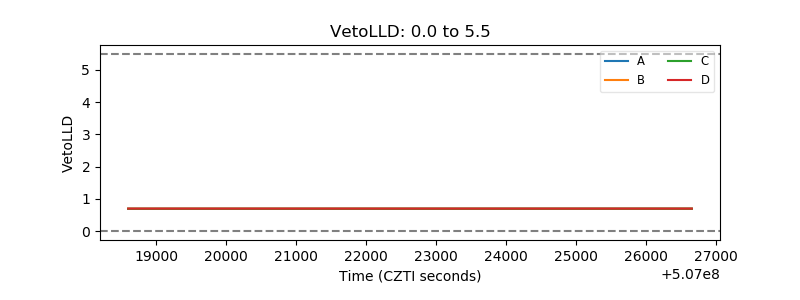 |
| Alpha Counter | 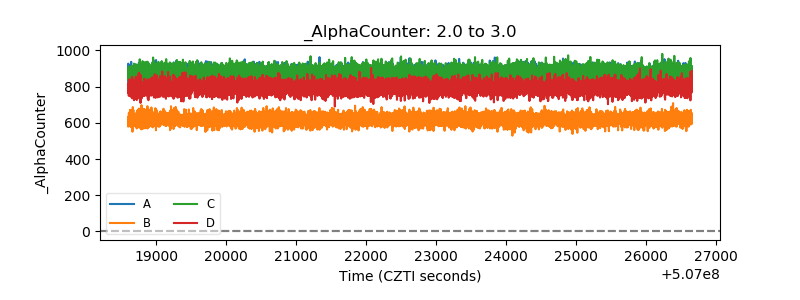 |
| _CPM_Rate | 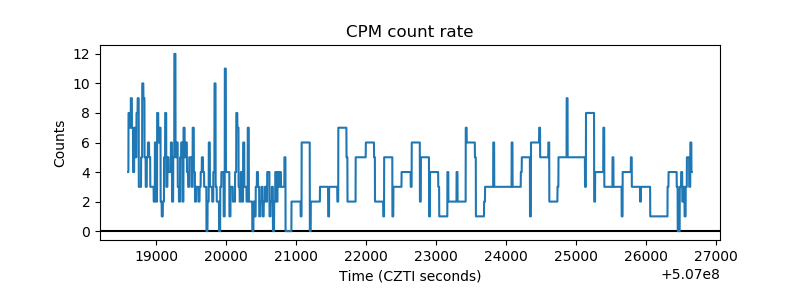 |
| CZT Counter | 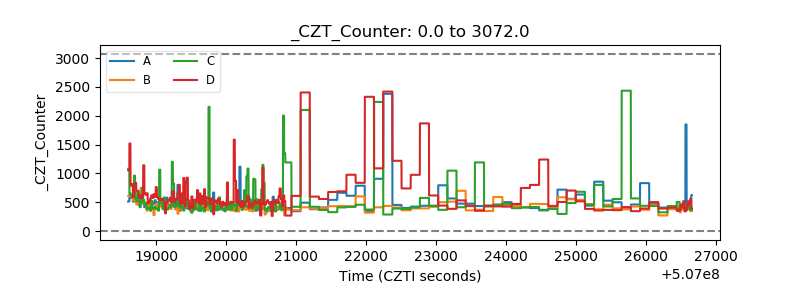 |
| +2.5 Volts monitor |  |
| +5 Volts monitor |  |
| _ROLL_ROT | 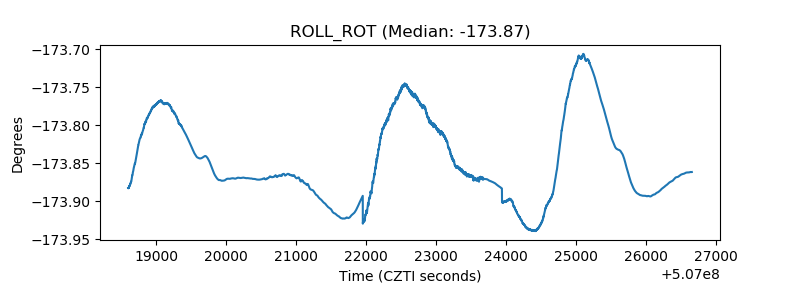 |
| _Roll_DEC | 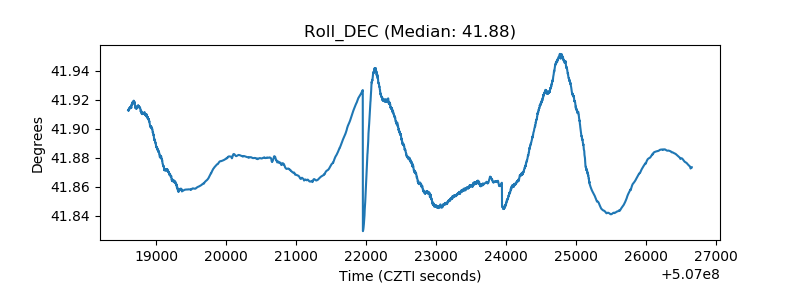 |
| _Roll_RA | 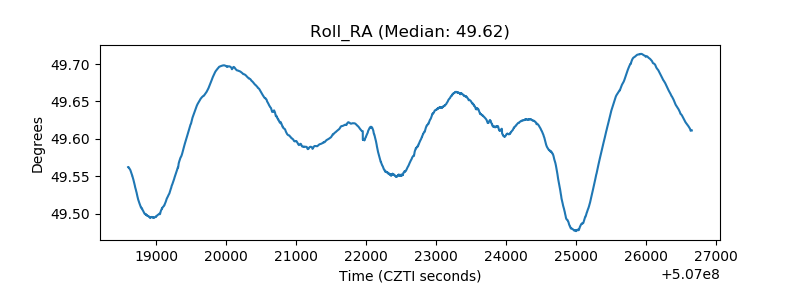 |
| Veto Counter | 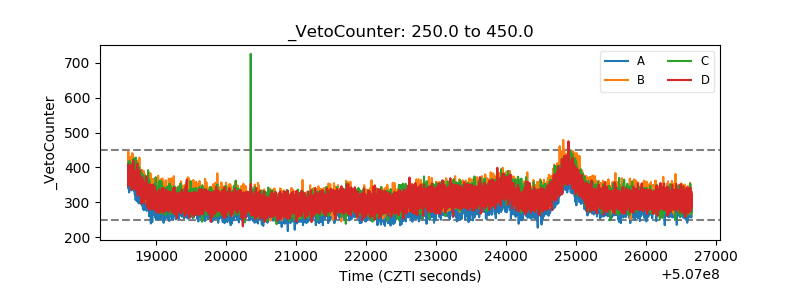 |