| Param | Original file | Final file |
|---|---|---|
| Filename | modeM0/AS1A14_030T02_9000006544_55876cztM0_level2.fits | modeM0/AS1A14_030T02_9000006544_55876cztM0_level2_quad_clean.evt |
| Size (bytes) | 1,482,396,480 | 259,637,760 |
| Size | 1.4 GB | 247.6 MB |
| Events in quadrant A | 10,816,138 | 1,760,233 |
| Events in quadrant B | 9,167,635 | 1,914,422 |
| Events in quadrant C | 11,974,389 | 1,631,261 |
| Events in quadrant D | 21,389,904 | 1,197,568 |
| Mode SS | |||
|---|---|---|---|
| Quadrant | BADHDUFLAG | Total packets | Discarded packets |
| A | 0 | 400 | 0 |
| B | 0 | 400 | 0 |
| C | 0 | 400 | 0 |
| D | 0 | 400 | 0 |
| Mode M9 | |||
|---|---|---|---|
| Quadrant | BADHDUFLAG | Total packets | Discarded packets |
| A | 0 | 8 | 0 |
| B | 0 | 8 | 0 |
| C | 0 | 8 | 0 |
| D | 0 | 8 | 0 |
| Mode M0 | |||
|---|---|---|---|
| Quadrant | BADHDUFLAG | Total packets | Discarded packets |
| A | 0 | 46346 | 3 |
| B | 0 | 41878 | 9 |
| C | 0 | 50623 | 4 |
| D | 0 | 77360 | 3 |
| Quadrant | Total seconds | Saturated seconds | Saturation percentage |
|---|---|---|---|
| A | 19694 | 535 | 2.716563% |
| B | 19691 | 362 | 1.838403% |
| C | 19694 | 1130 | 5.737788% |
| D | 19694 | 5041 | 25.596628% |
Noise dominated data is calculated using 1-second bins in cleaned event files. If a bin has >2000 counts, and if more than 50% of those come from <1% of pixels, then it is considered to be noise-dominated and hence unusable.
| Quadrant | # 1 sec bins | Bins with >0 counts | Bins with >2000 counts | High rate bins dominated by noise | Noise dominated (total time) | Noise dominated (detector-on time) | Marked lightcurve |
|---|---|---|---|---|---|---|---|
| A | 20589 | 19697 | 186 | 186 | 0.90% | 0.94% | 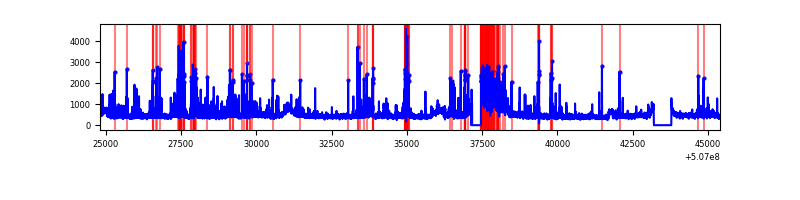 |
| B | 20589 | 19695 | 65 | 65 | 0.32% | 0.33% | 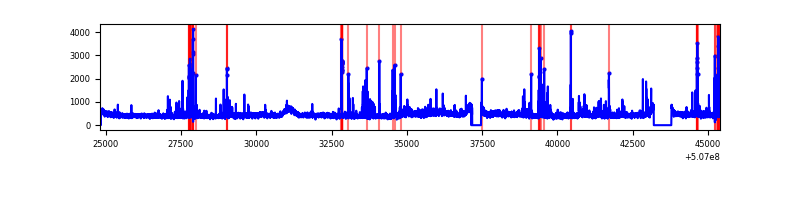 |
| C | 20589 | 19697 | 834 | 834 | 4.05% | 4.23% | 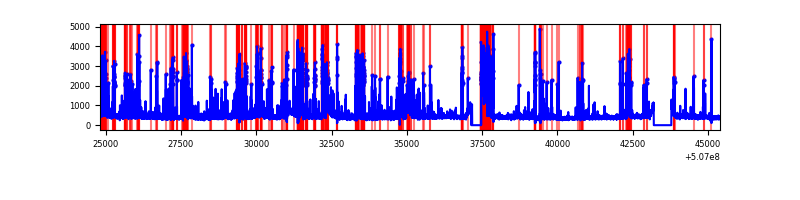 |
| D | 20589 | 19696 | 3442 | 3442 | 16.72% | 17.48% | 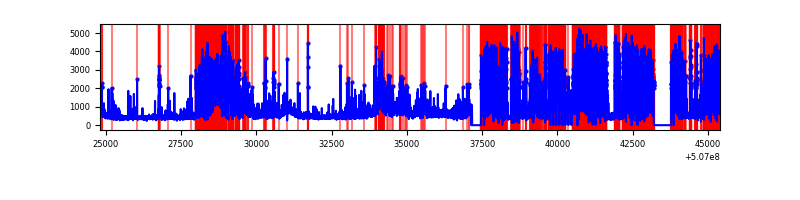 |
Top three noisy pixels from each quadrant. If the there are fewer than three noisy pixels in the level2.evt file, extra rows are filled as -1
| Pixel properties | Quadrant properties | ||||||
|---|---|---|---|---|---|---|---|
| Quadrant | DetID | PixID | Counts | Sigma | Mean | Median | Sigma |
| A | 4 | 249 | 1040214 | 2049.14 | 2060 | 2009 | 506.7 |
| A | 12 | 115 | 595246 | 1170.89 | 2060 | 2009 | 506.7 |
| A | 15 | 32 | 380552 | 747.14 | 2060 | 2009 | 506.7 |
| B | 0 | 153 | 381671 | 863.16 | 2036 | 1958 | 439.9 |
| B | 7 | 0 | 255782 | 576.99 | 2036 | 1958 | 439.9 |
| B | 0 | 199 | 84933 | 188.62 | 2036 | 1958 | 439.9 |
| C | 15 | 199 | 1826965 | 3451.75 | 1951 | 1932 | 528.7 |
| C | 13 | 3 | 979824 | 1849.52 | 1951 | 1932 | 528.7 |
| C | 6 | 223 | 537392 | 1012.73 | 1951 | 1932 | 528.7 |
| D | 11 | 129 | 8786613 | 18265.01 | 1702 | 1628 | 481.0 |
| D | 15 | 125 | 2155729 | 4478.63 | 1702 | 1628 | 481.0 |
| D | 2 | 62 | 1679389 | 3488.26 | 1702 | 1628 | 481.0 |
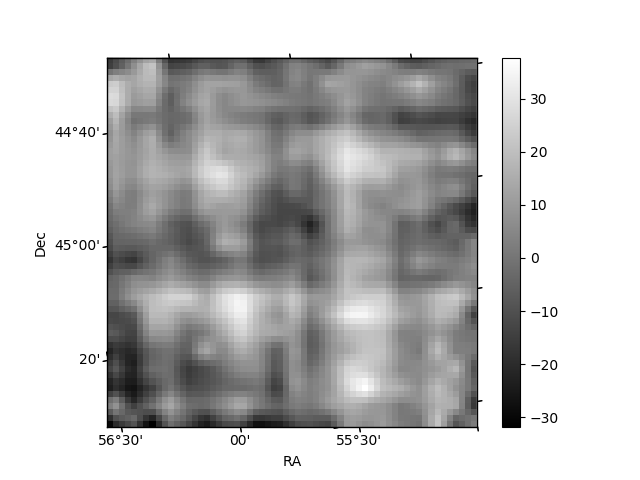
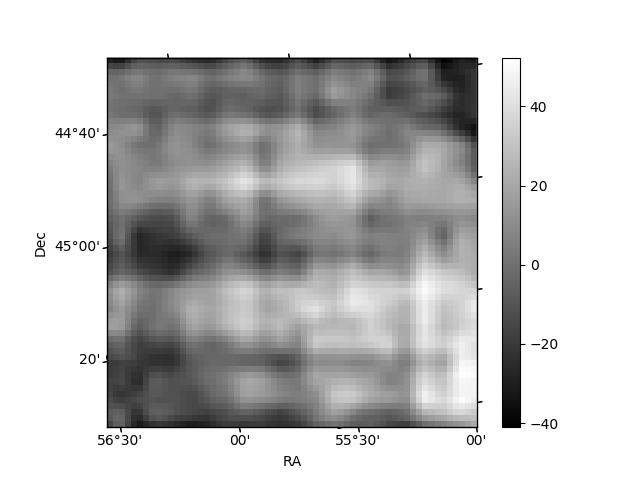
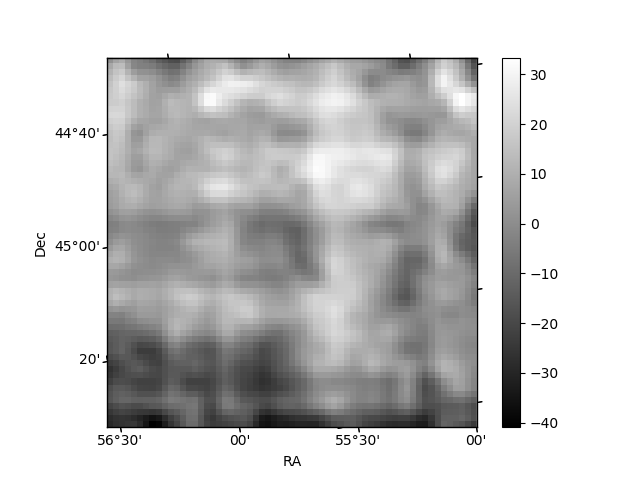
Histogram calculated using DETX and DETY for each event in the final _common_clean file
| Quadrant A | 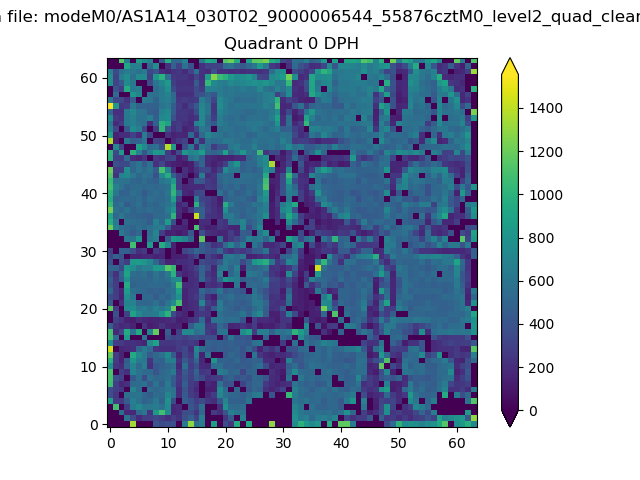 |
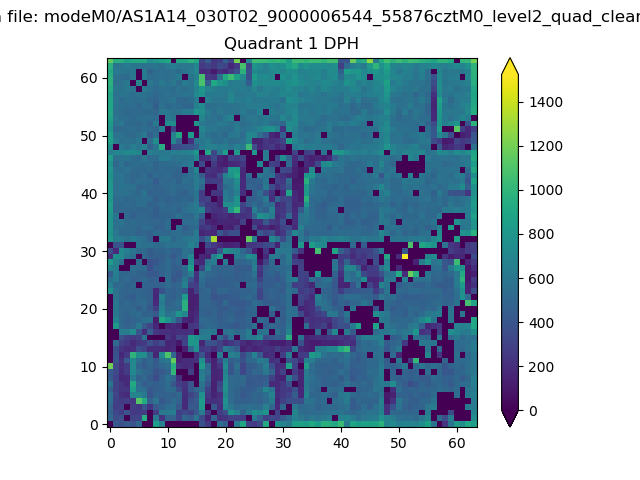 |
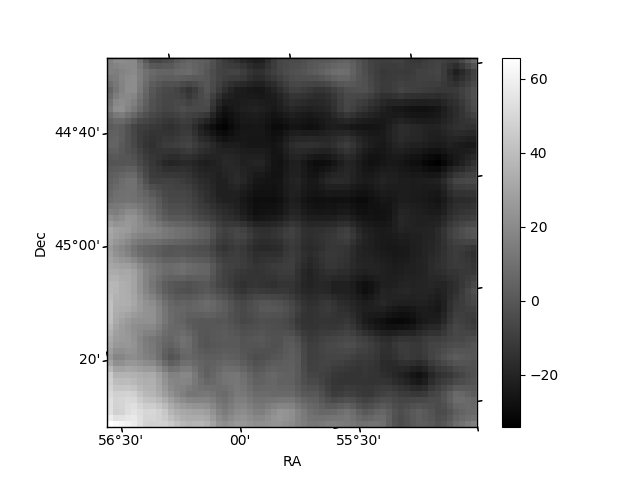
Quadrant B |
|---|---|---|---|
| Quadrant D | 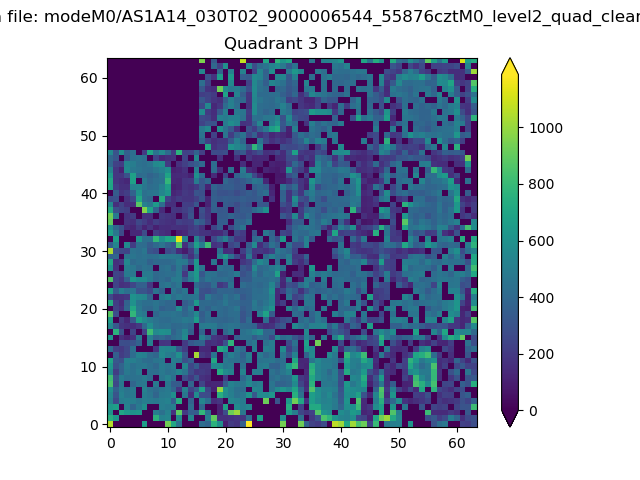 |
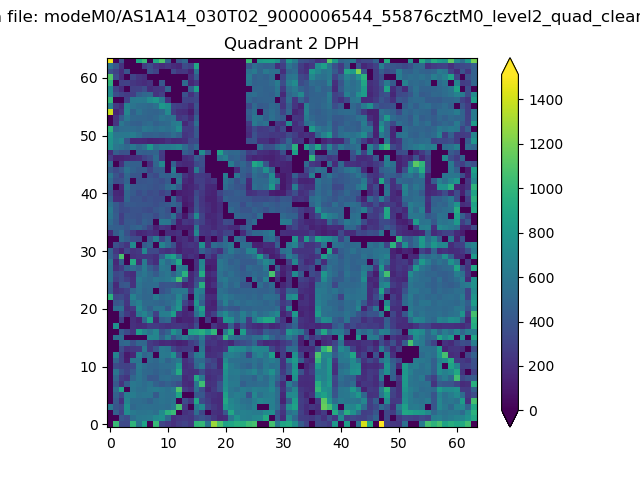 |
Quadrant C |
| Plot type | Count rate plots | Images |
|---|---|---|
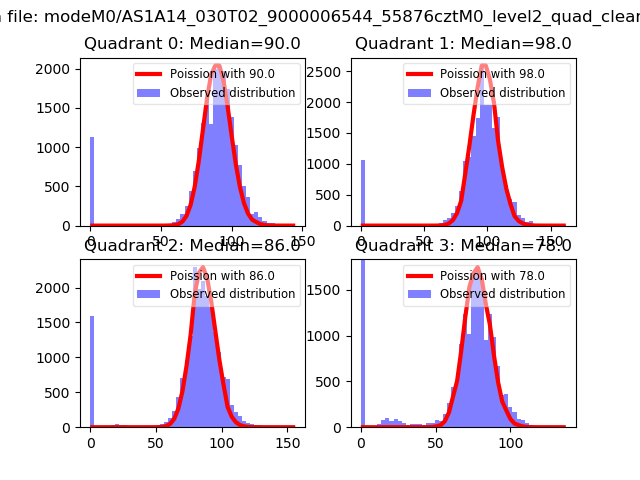
| Comparison with Poisson distribution Blue bars denote a histogram of data divided into 1 sec bins. Red curve is a Poisson curve with rate = median count rate of data. |
 |
 |
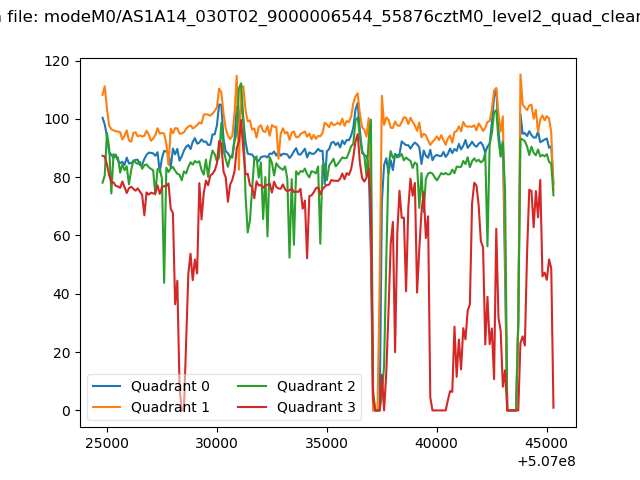
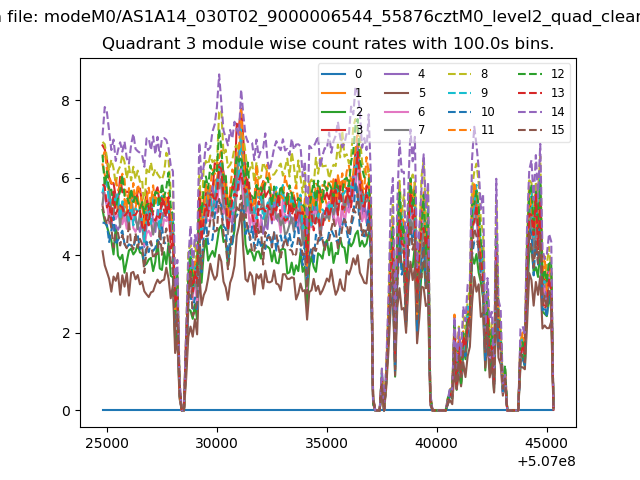
| Quadrant-wise count rates Data is divided into 100 sec bins |
 |
|
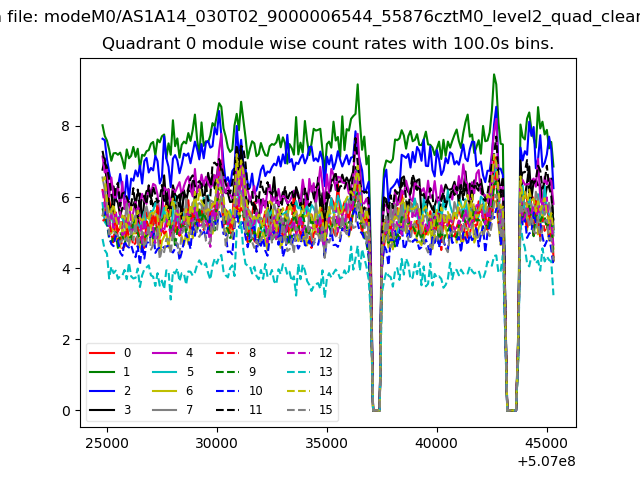
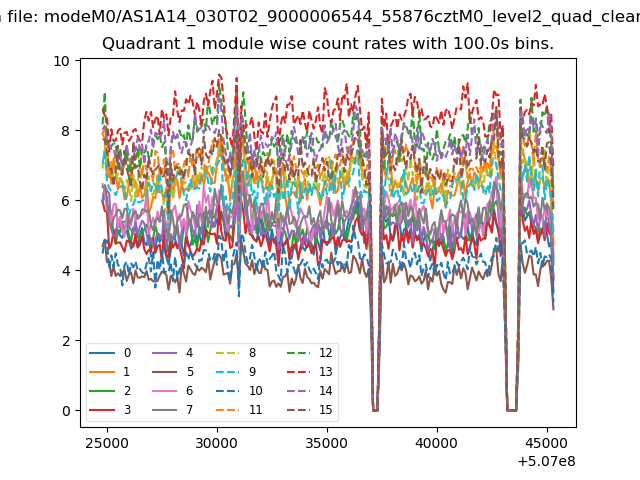
| Module-wise count rates for Quadrant A Data is divided into 100 sec bins |
 |
 |
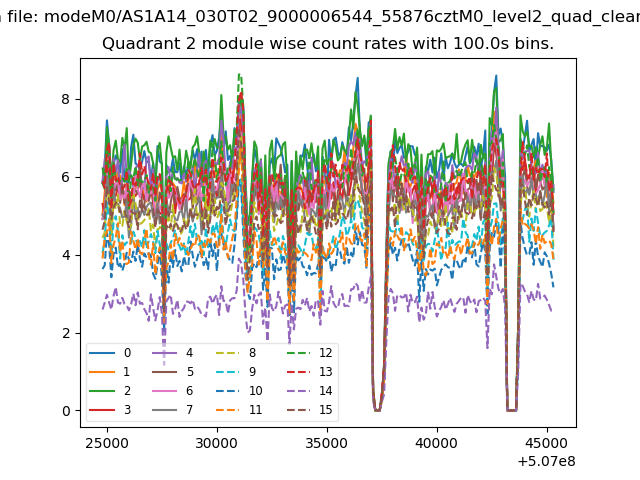
| Module-wise count rates for Quadrant B Data is divided into 100 sec bins |
 |
 |
| Module-wise count rates for Quadrant C Data is divided into 100 sec bins |
 |
 |
| Module-wise count rates for Quadrant D Data is divided into 100 sec bins |
 |
 |
| Parameter | Plot |
|---|---|
| CZT HV Monitor |  |
| D_VDD | 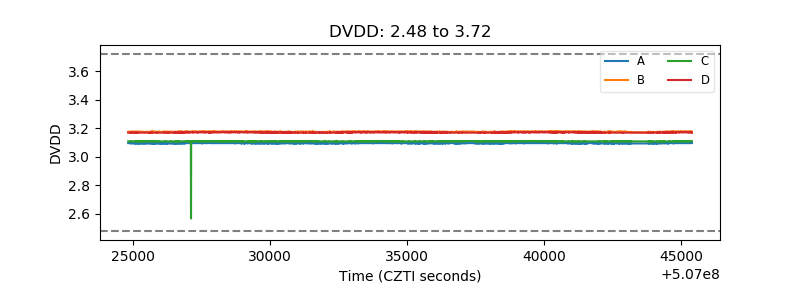 |
| Temperature 1 | 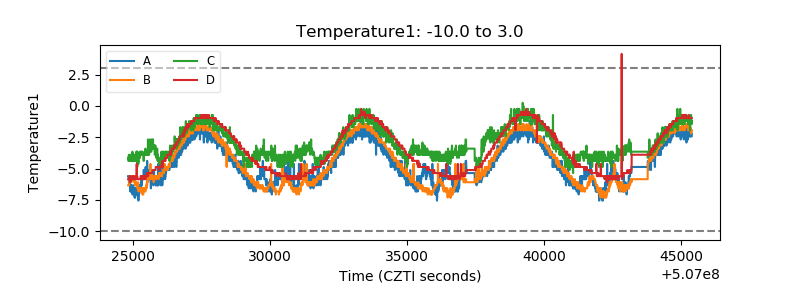 |
| Veto HV Monitor | 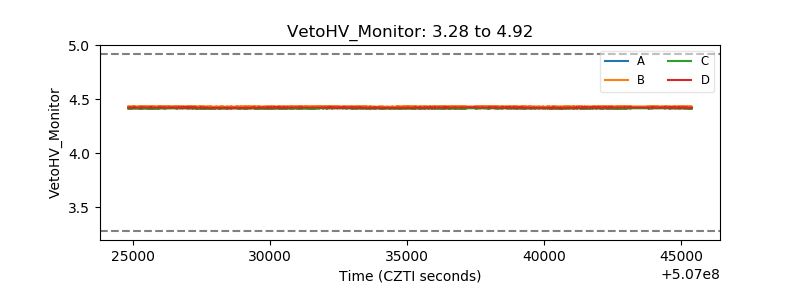 |
| Veto LLD | 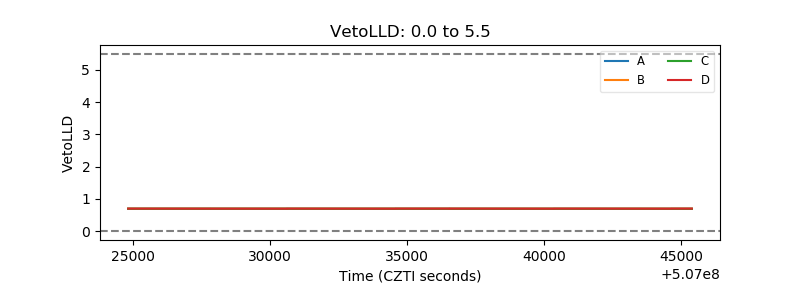 |
| Alpha Counter | 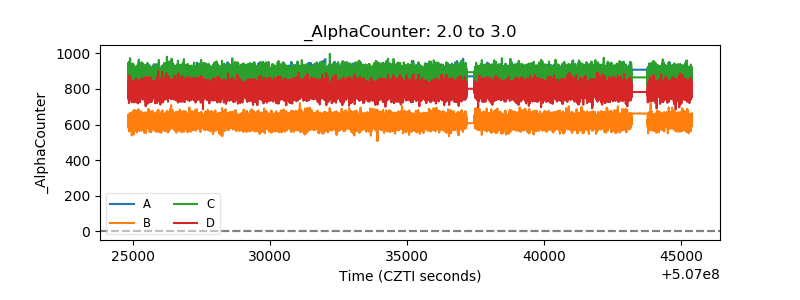 |
| _CPM_Rate | 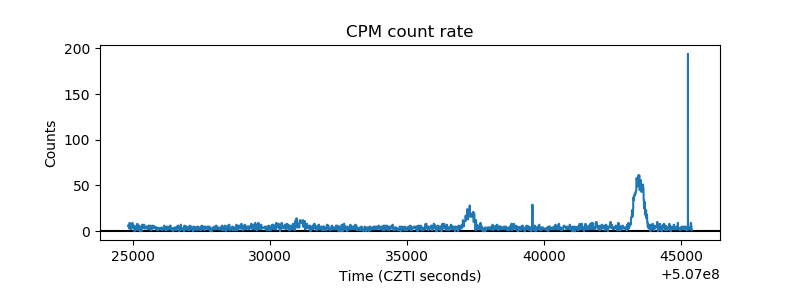 |
| CZT Counter | 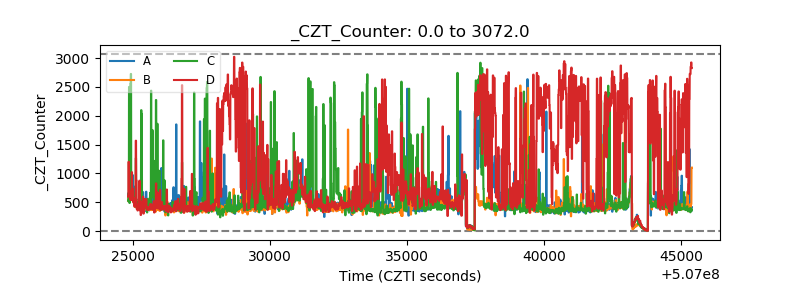 |
| +2.5 Volts monitor |  |
| +5 Volts monitor |  |
| _ROLL_ROT | 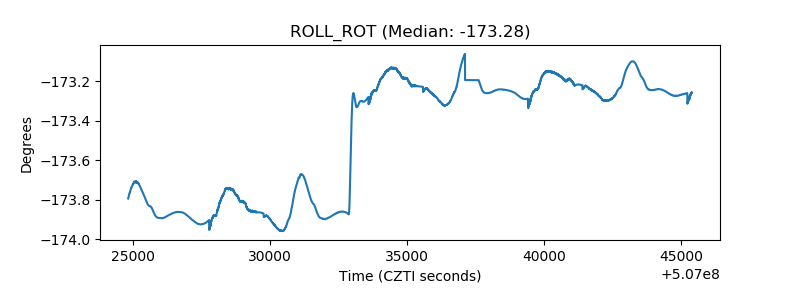 |
| _Roll_DEC | 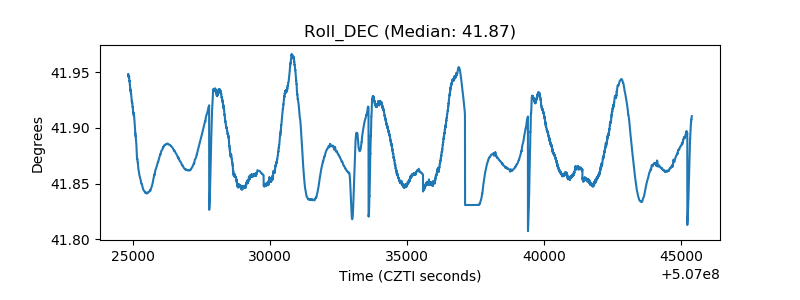 |
| _Roll_RA | 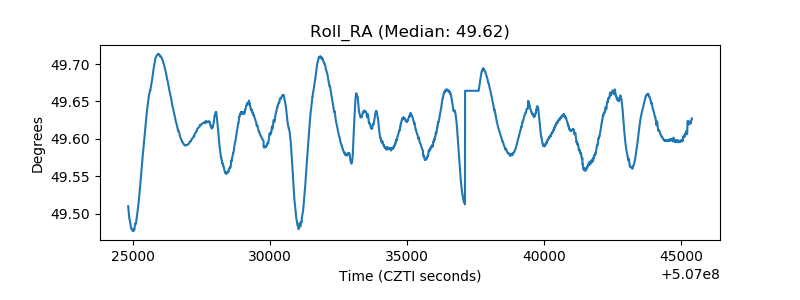 |
| Veto Counter | 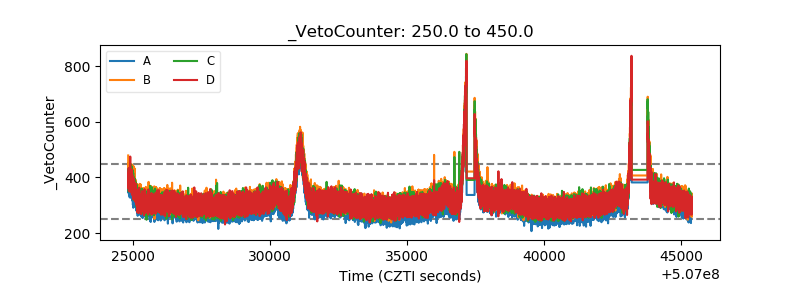 |