| Param | Original file | Final file |
|---|---|---|
| Filename | modeM0/AS1A14_030T02_9000006544_55877cztM0_level2.fits | modeM0/AS1A14_030T02_9000006544_55877cztM0_level2_quad_clean.evt |
| Size (bytes) | 617,535,360 | 88,758,720 |
| Size | 588.9 MB | 84.6 MB |
| Events in quadrant A | 3,710,537 | 640,941 |
| Events in quadrant B | 3,283,776 | 686,554 |
| Events in quadrant C | 3,086,953 | 605,957 |
| Events in quadrant D | 12,240,154 | 272,437 |
| Mode SS | |||
|---|---|---|---|
| Quadrant | BADHDUFLAG | Total packets | Discarded packets |
| A | 0 | 140 | 0 |
| B | 0 | 140 | 0 |
| C | 0 | 140 | 0 |
| D | 0 | 140 | 0 |
| Mode M9 | |||
|---|---|---|---|
| Quadrant | BADHDUFLAG | Total packets | Discarded packets |
| A | 0 | 8 | 0 |
| B | 0 | 8 | 0 |
| C | 0 | 8 | 0 |
| D | 0 | 8 | 0 |
| Mode M0 | |||
|---|---|---|---|
| Quadrant | BADHDUFLAG | Total packets | Discarded packets |
| A | 0 | 15771 | 1 |
| B | 0 | 14938 | 1 |
| C | 0 | 14719 | 1 |
| D | 0 | 41081 | 4 |
| Quadrant | Total seconds | Saturated seconds | Saturation percentage |
|---|---|---|---|
| A | 6909 | 90 | 1.302649% |
| B | 6910 | 103 | 1.490593% |
| C | 6910 | 76 | 1.099855% |
| D | 6909 | 3954 | 57.229700% |
Noise dominated data is calculated using 1-second bins in cleaned event files. If a bin has >2000 counts, and if more than 50% of those come from <1% of pixels, then it is considered to be noise-dominated and hence unusable.
| Quadrant | # 1 sec bins | Bins with >0 counts | Bins with >2000 counts | High rate bins dominated by noise | Noise dominated (total time) | Noise dominated (detector-on time) | Marked lightcurve |
|---|---|---|---|---|---|---|---|
| A | 7709 | 6910 | 44 | 44 | 0.57% | 0.64% | 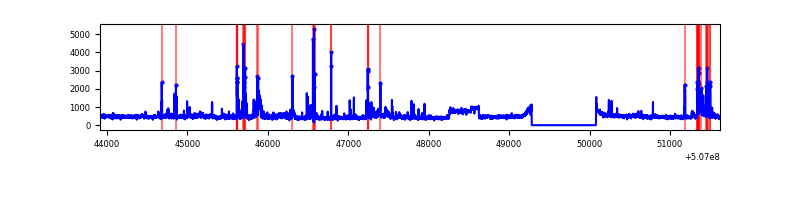 |
| B | 7710 | 6911 | 49 | 49 | 0.64% | 0.71% | 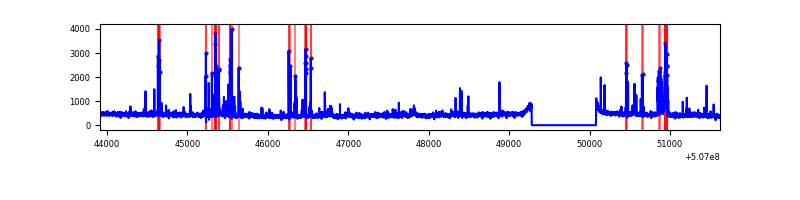 |
| C | 7710 | 6911 | 35 | 35 | 0.45% | 0.51% | 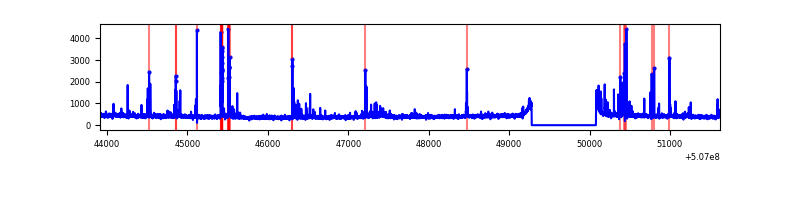 |
| D | 7709 | 6907 | 3054 | 3054 | 39.62% | 44.22% | 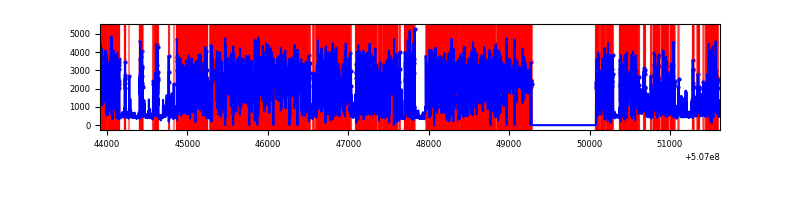 |
Top three noisy pixels from each quadrant. If the there are fewer than three noisy pixels in the level2.evt file, extra rows are filled as -1
| Pixel properties | Quadrant properties | ||||||
|---|---|---|---|---|---|---|---|
| Quadrant | DetID | PixID | Counts | Sigma | Mean | Median | Sigma |
| A | 4 | 249 | 261414 | 1455.95 | 720 | 700 | 179.1 |
| A | 15 | 32 | 170667 | 949.18 | 720 | 700 | 179.1 |
| A | 8 | 192 | 144885 | 805.2 | 720 | 700 | 179.1 |
| B | 0 | 153 | 198800 | 1305.97 | 707 | 681 | 151.7 |
| B | 5 | 185 | 134170 | 879.94 | 707 | 681 | 151.7 |
| B | 0 | 199 | 47284 | 307.2 | 707 | 681 | 151.7 |
| C | 12 | 254 | 171518 | 888.2 | 698 | 690 | 192.3 |
| C | 15 | 199 | 126419 | 653.71 | 698 | 690 | 192.3 |
| C | 15 | 131 | 25039 | 126.6 | 698 | 690 | 192.3 |
| D | 11 | 129 | 9444866 | 73153.92 | 452 | 431 | 129.1 |
| D | 15 | 125 | 382751 | 2961.34 | 452 | 431 | 129.1 |
| D | 8 | 245 | 201428 | 1556.87 | 452 | 431 | 129.1 |
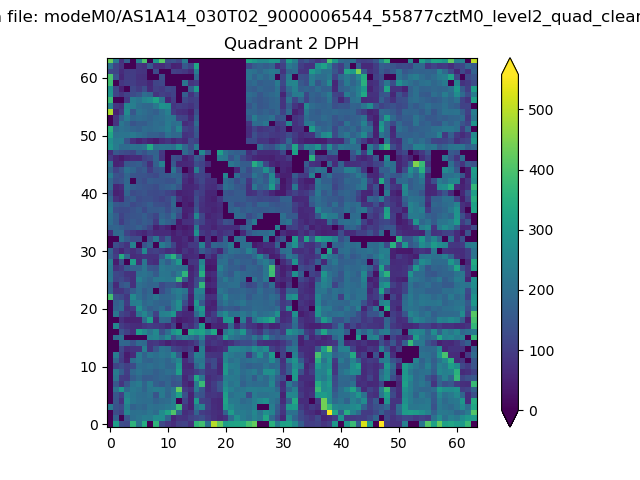
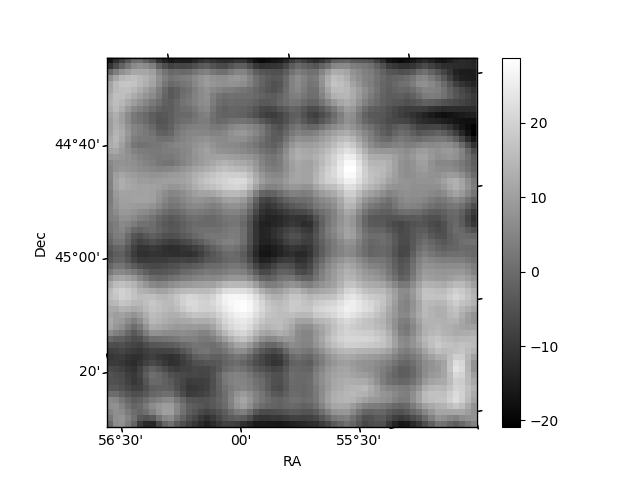
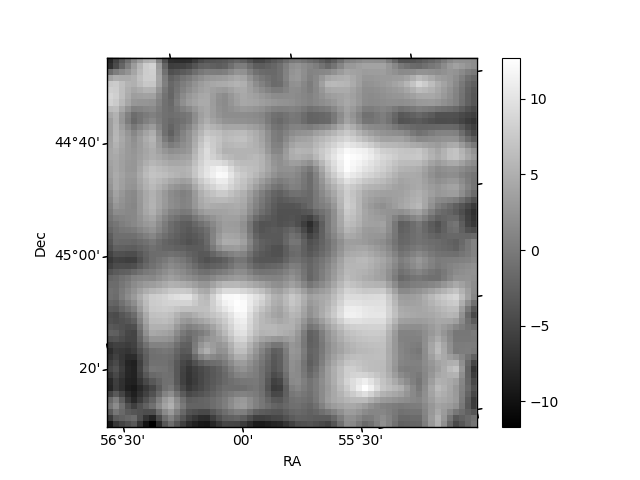
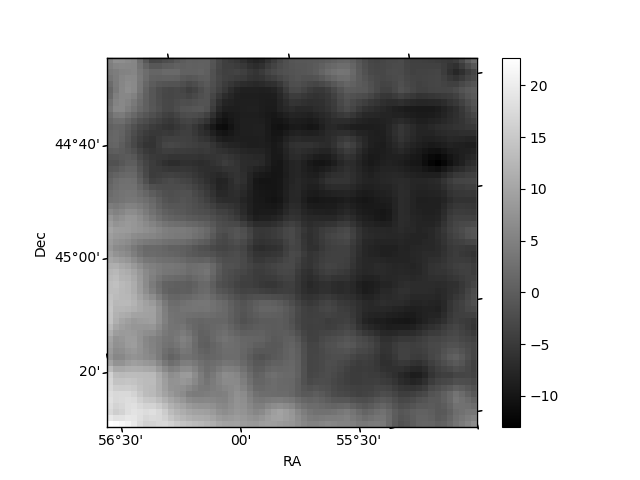
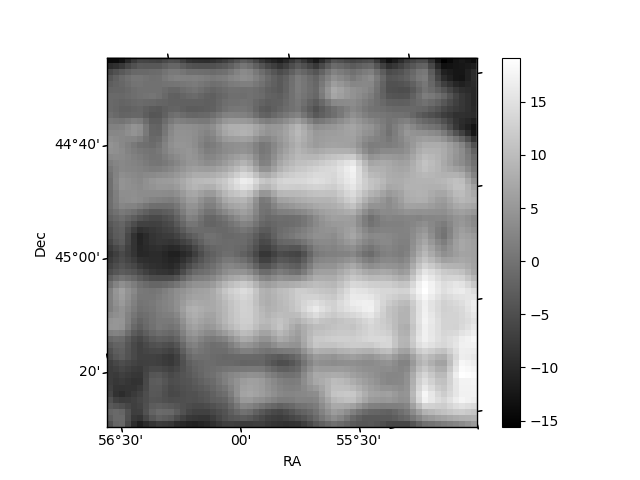
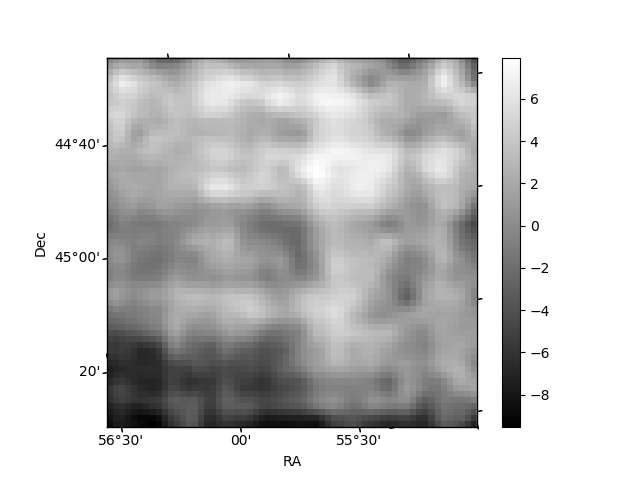
Histogram calculated using DETX and DETY for each event in the final _common_clean file
| Quadrant A | 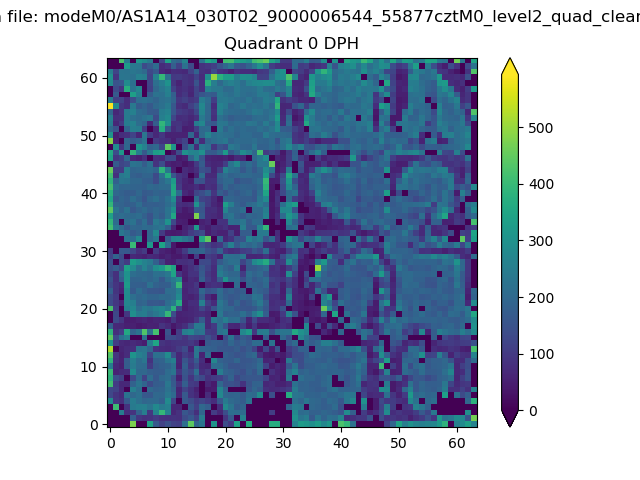 |
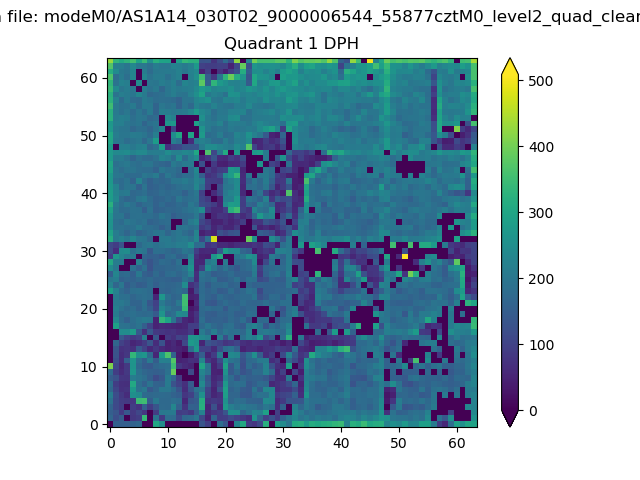 |
Quadrant B |
|---|---|---|---|
| Quadrant D | 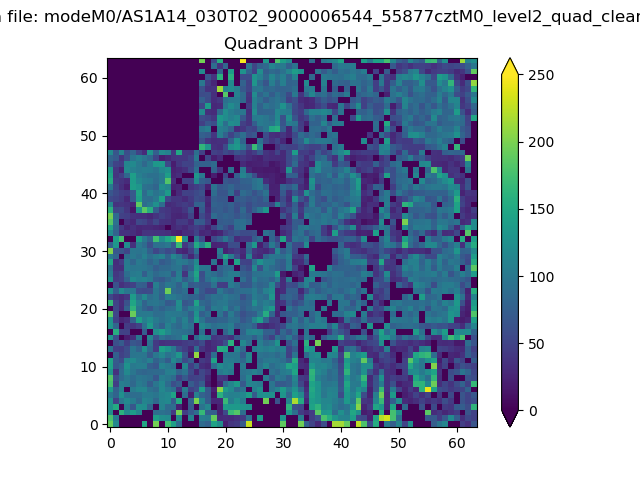 |
 |
Quadrant C |
| Plot type | Count rate plots | Images |
|---|---|---|
| Comparison with Poisson distribution Blue bars denote a histogram of data divided into 1 sec bins. Red curve is a Poisson curve with rate = median count rate of data. |
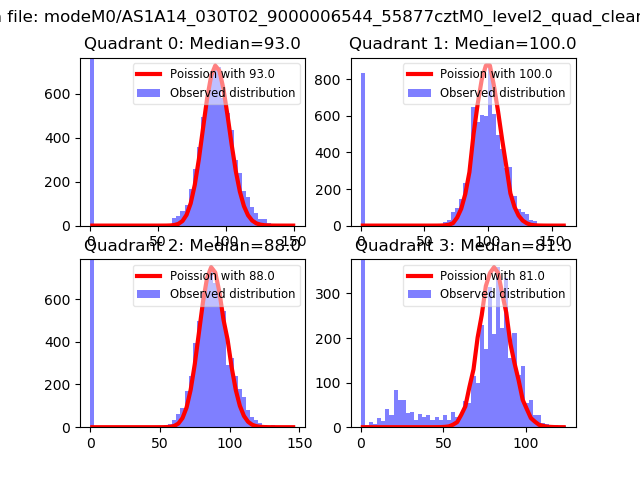 |
 |
| Quadrant-wise count rates Data is divided into 100 sec bins |
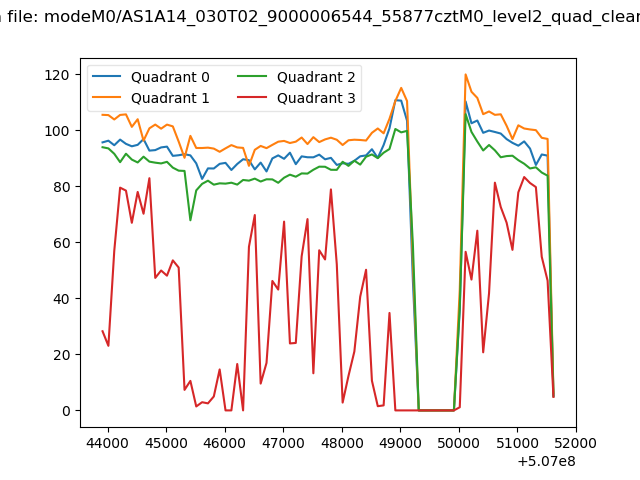 |
|
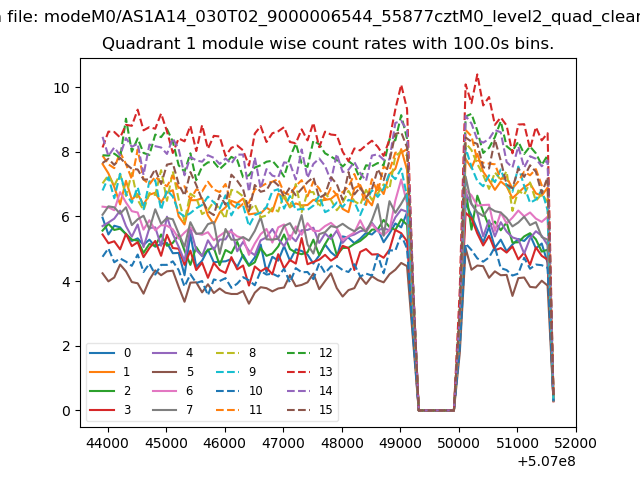
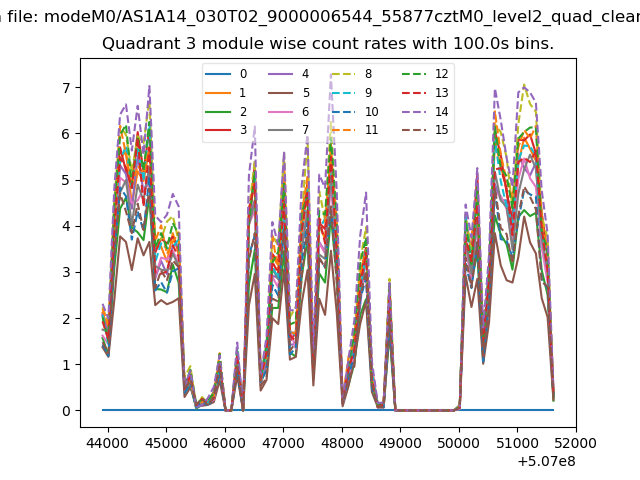
| Module-wise count rates for Quadrant A Data is divided into 100 sec bins |
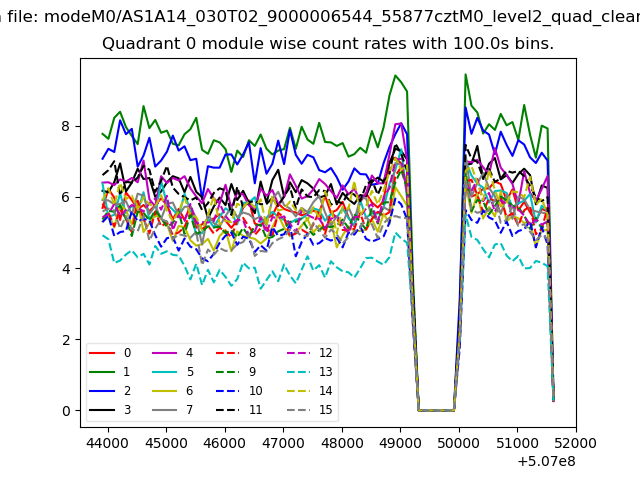 |
 |
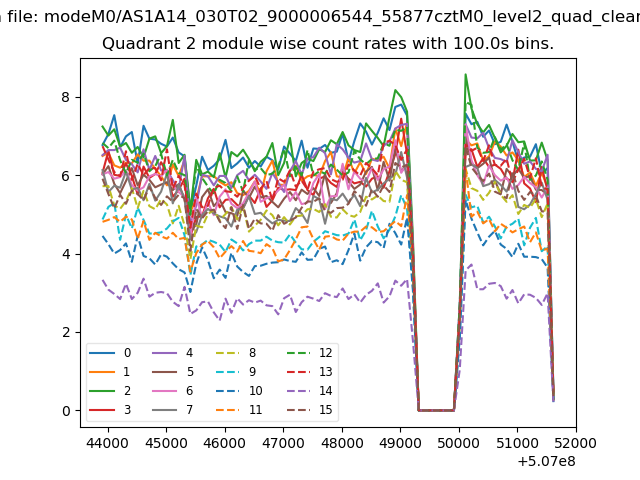
| Module-wise count rates for Quadrant B Data is divided into 100 sec bins |
 |
 |
| Module-wise count rates for Quadrant C Data is divided into 100 sec bins |
 |
 |
| Module-wise count rates for Quadrant D Data is divided into 100 sec bins |
 |
 |
| Parameter | Plot |
|---|---|
| CZT HV Monitor | 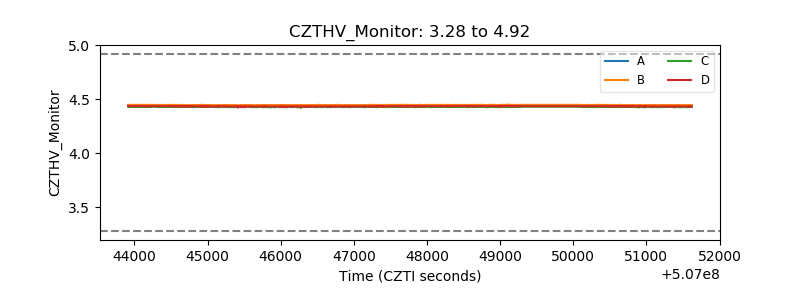 |
| D_VDD | 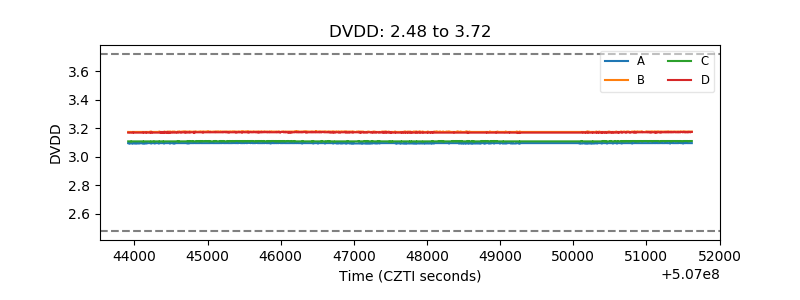 |
| Temperature 1 | 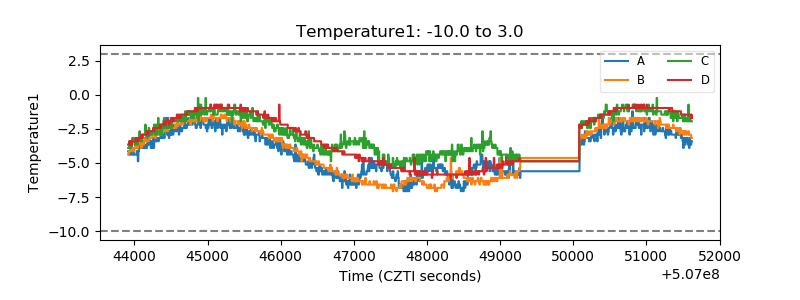 |
| Veto HV Monitor | 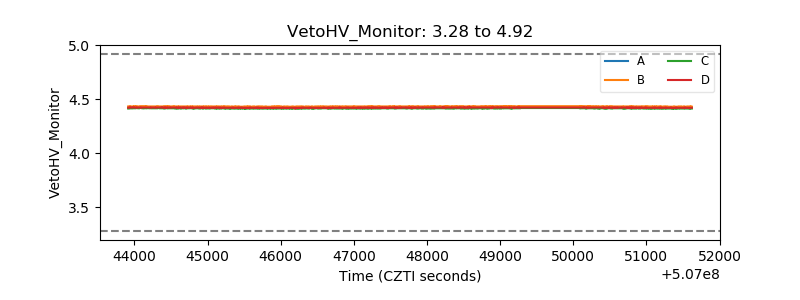 |
| Veto LLD | 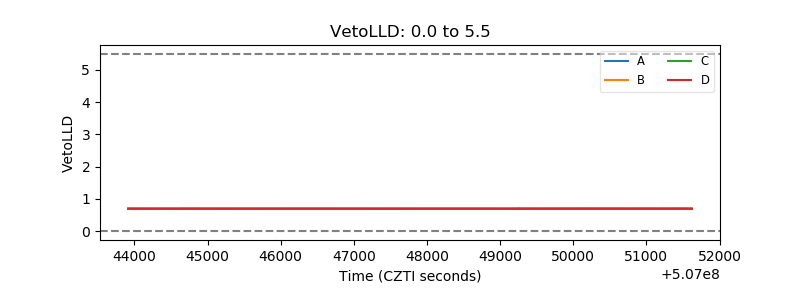 |
| Alpha Counter | 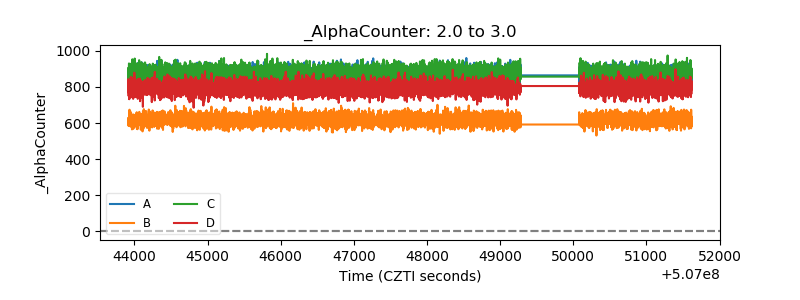 |
| _CPM_Rate | 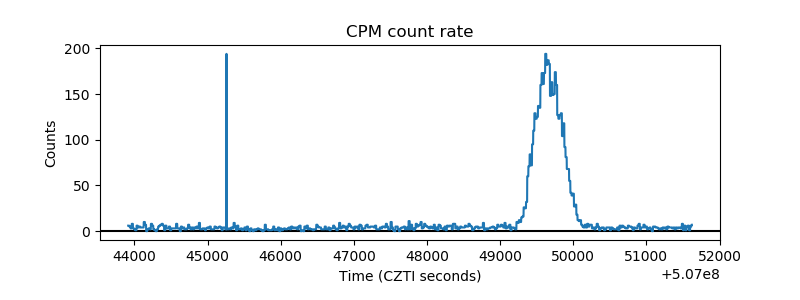 |
| CZT Counter | 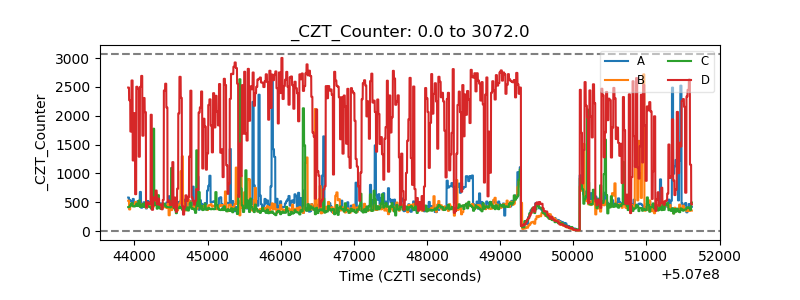 |
| +2.5 Volts monitor | 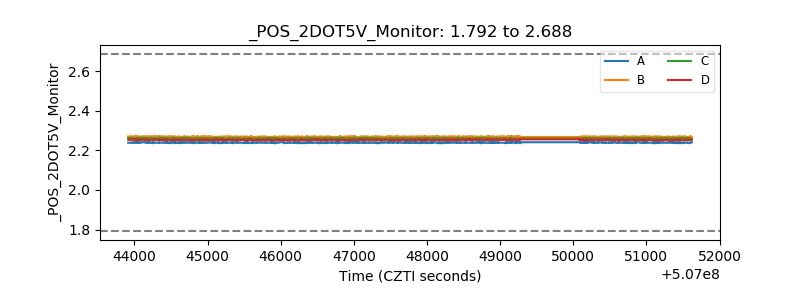 |
| +5 Volts monitor |  |
| _ROLL_ROT | 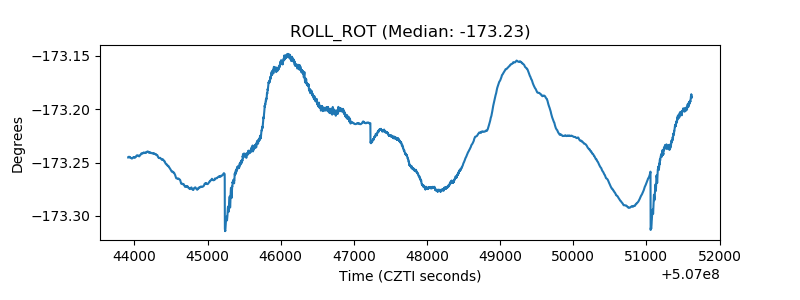 |
| _Roll_DEC | 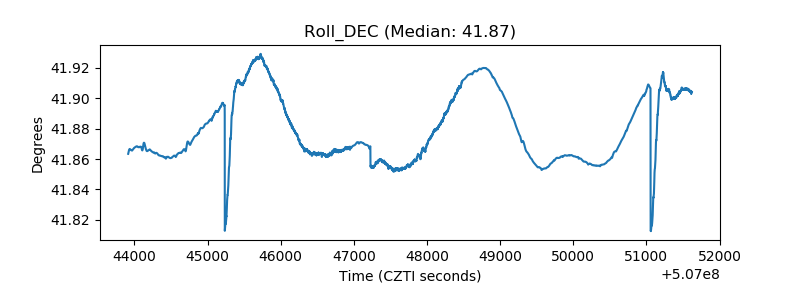 |
| _Roll_RA | 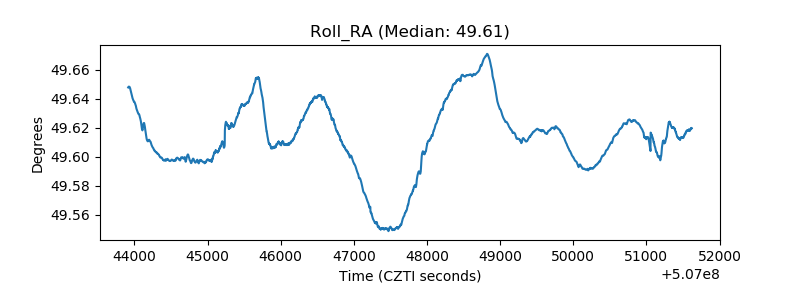 |
| Veto Counter | 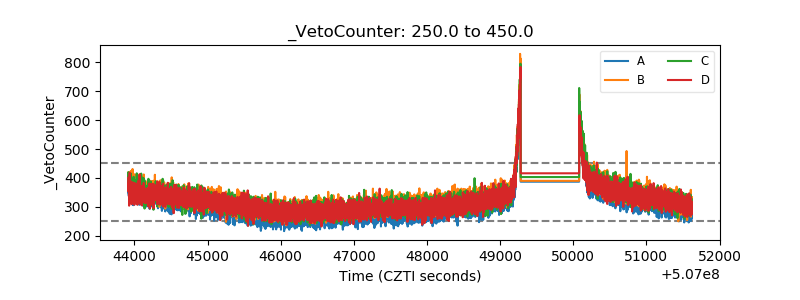 |