| Param | Original file | Final file |
|---|---|---|
| Filename | modeM0/AS1A14_030T02_9000006544_55879cztM0_level2.fits | modeM0/AS1A14_030T02_9000006544_55879cztM0_level2_quad_clean.evt |
| Size (bytes) | 558,204,480 | 87,255,360 |
| Size | 532.3 MB | 83.2 MB |
| Events in quadrant A | 4,152,353 | 582,840 |
| Events in quadrant B | 2,927,462 | 647,361 |
| Events in quadrant C | 4,192,146 | 552,063 |
| Events in quadrant D | 8,888,684 | 408,681 |
| Mode SS | |||
|---|---|---|---|
| Quadrant | BADHDUFLAG | Total packets | Discarded packets |
| A | 0 | 130 | 0 |
| B | 0 | 130 | 0 |
| C | 0 | 130 | 0 |
| D | 0 | 130 | 0 |
| Mode M9 | |||
|---|---|---|---|
| Quadrant | BADHDUFLAG | Total packets | Discarded packets |
| A | 0 | 10 | 0 |
| B | 0 | 10 | 0 |
| C | 0 | 10 | 0 |
| D | 0 | 10 | 0 |
| Mode M0 | |||
|---|---|---|---|
| Quadrant | BADHDUFLAG | Total packets | Discarded packets |
| A | 0 | 16862 | 1 |
| B | 0 | 13685 | 1 |
| C | 0 | 17336 | 1 |
| D | 0 | 30864 | 1 |
| Quadrant | Total seconds | Saturated seconds | Saturation percentage |
|---|---|---|---|
| A | 6465 | 345 | 5.336427% |
| B | 6466 | 74 | 1.144448% |
| C | 6466 | 350 | 5.412929% |
| D | 6466 | 1920 | 29.693783% |
Noise dominated data is calculated using 1-second bins in cleaned event files. If a bin has >2000 counts, and if more than 50% of those come from <1% of pixels, then it is considered to be noise-dominated and hence unusable.
| Quadrant | # 1 sec bins | Bins with >0 counts | Bins with >2000 counts | High rate bins dominated by noise | Noise dominated (total time) | Noise dominated (detector-on time) | Marked lightcurve |
|---|---|---|---|---|---|---|---|
| A | 7440 | 6466 | 279 | 279 | 3.75% | 4.31% | 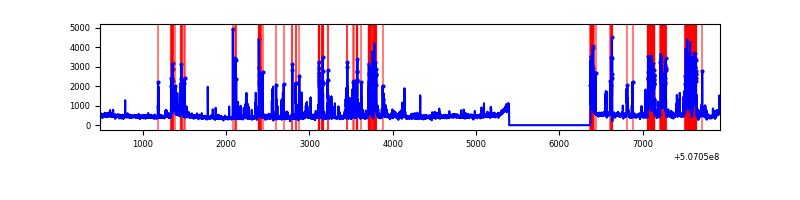 |
| B | 7441 | 6467 | 15 | 15 | 0.20% | 0.23% | 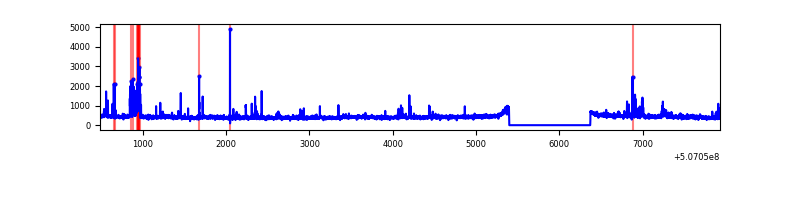 |
| C | 7441 | 6467 | 265 | 265 | 3.56% | 4.10% | 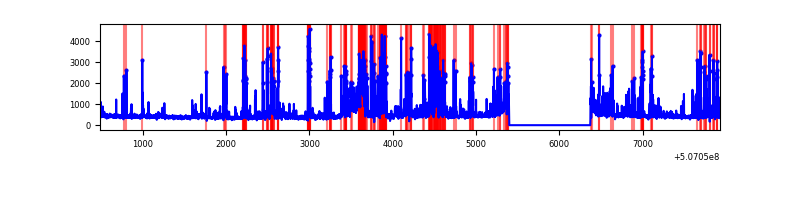 |
| D | 7441 | 6467 | 1563 | 1563 | 21.01% | 24.17% | 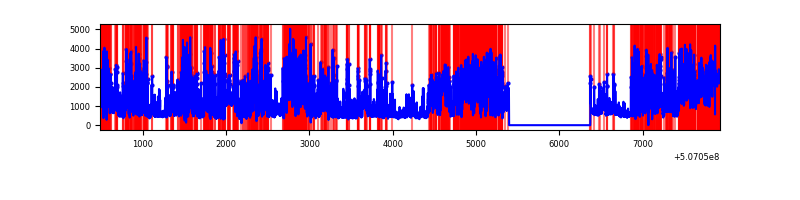 |
Top three noisy pixels from each quadrant. If the there are fewer than three noisy pixels in the level2.evt file, extra rows are filled as -1
| Pixel properties | Quadrant properties | ||||||
|---|---|---|---|---|---|---|---|
| Quadrant | DetID | PixID | Counts | Sigma | Mean | Median | Sigma |
| A | 15 | 32 | 737650 | 4531.64 | 651 | 635 | 162.6 |
| A | 0 | 8 | 360001 | 2209.61 | 651 | 635 | 162.6 |
| A | 4 | 249 | 193276 | 1184.48 | 651 | 635 | 162.6 |
| B | 5 | 185 | 120844 | 852.88 | 657 | 632 | 140.9 |
| B | 0 | 153 | 69020 | 485.2 | 657 | 632 | 140.9 |
| B | 0 | 197 | 44908 | 314.13 | 657 | 632 | 140.9 |
| C | 12 | 254 | 1006851 | 5747.56 | 635 | 629 | 175.1 |
| C | 13 | 3 | 508096 | 2898.66 | 635 | 629 | 175.1 |
| C | 12 | 252 | 104977 | 596.04 | 635 | 629 | 175.1 |
| D | 11 | 129 | 6156970 | 38359.83 | 564 | 539 | 160.5 |
| D | 3 | 12 | 101774 | 630.78 | 564 | 539 | 160.5 |
| D | 15 | 125 | 76255 | 471.78 | 564 | 539 | 160.5 |
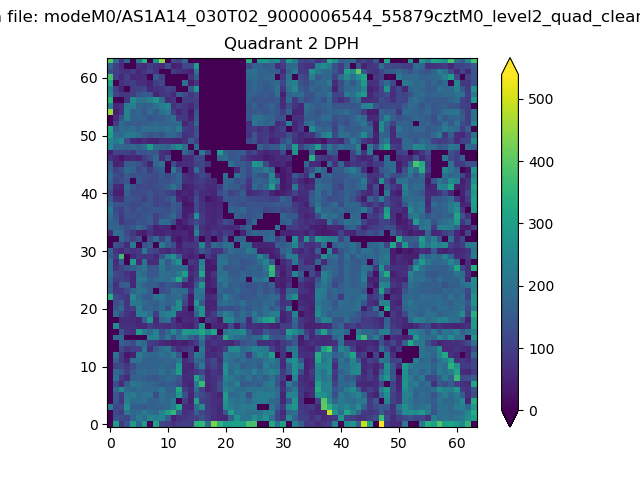
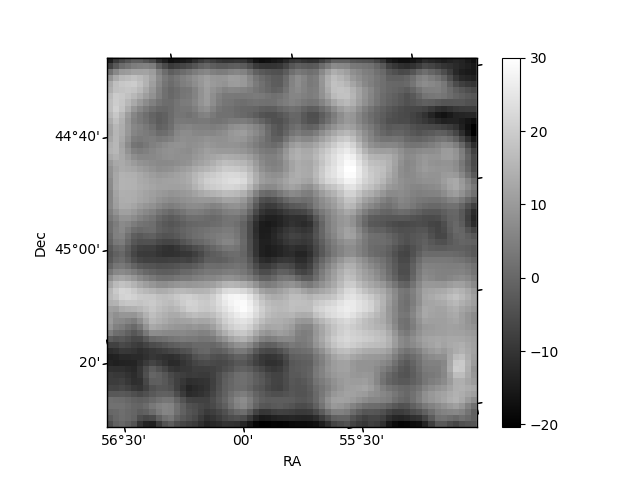
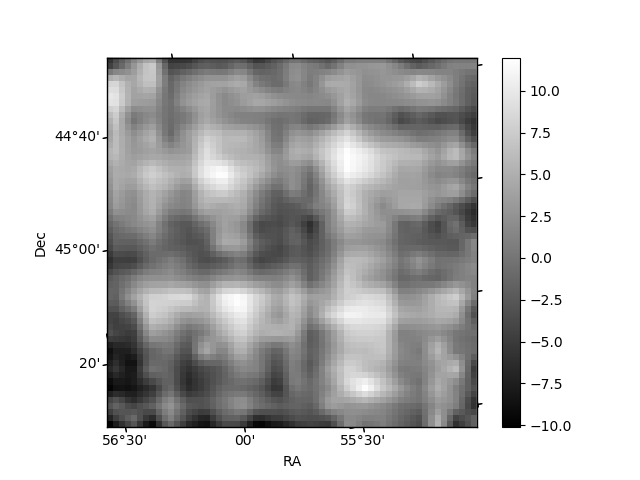
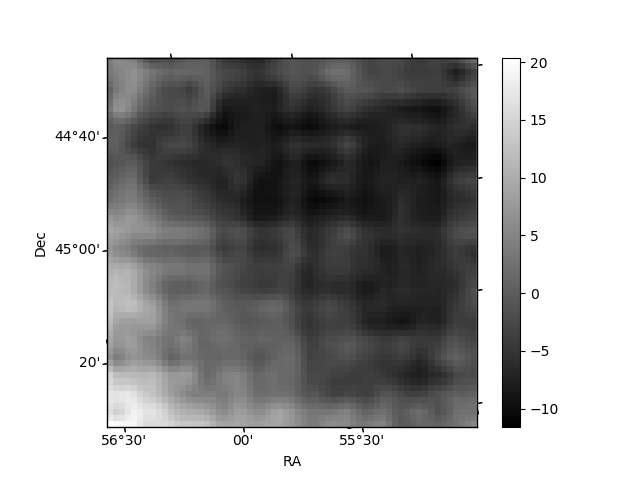
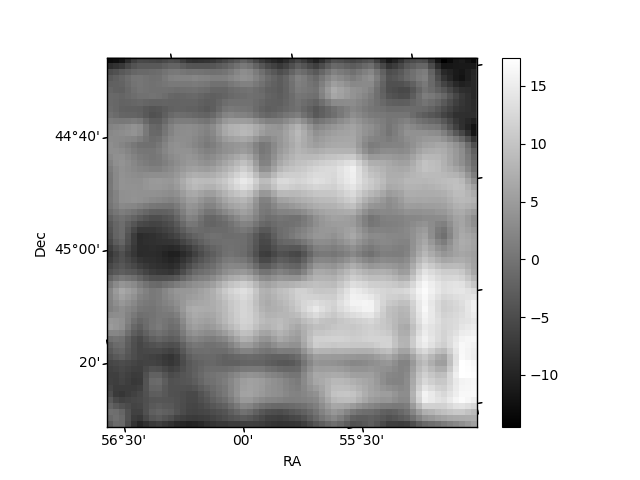
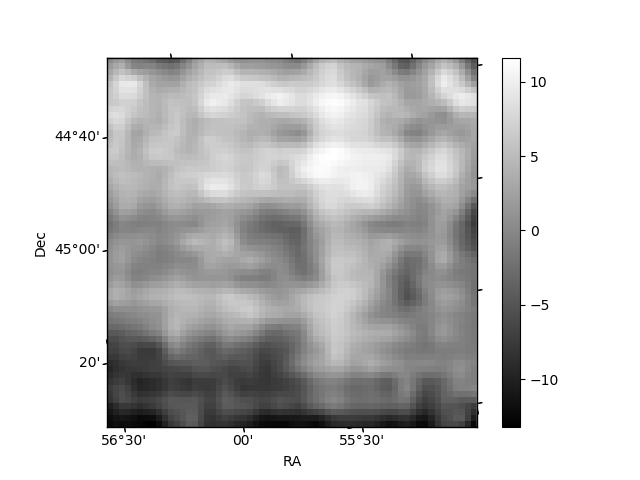
Histogram calculated using DETX and DETY for each event in the final _common_clean file
| Quadrant A | 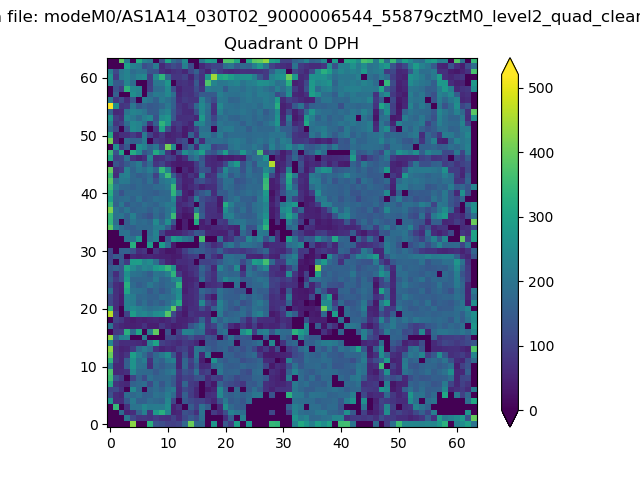 |
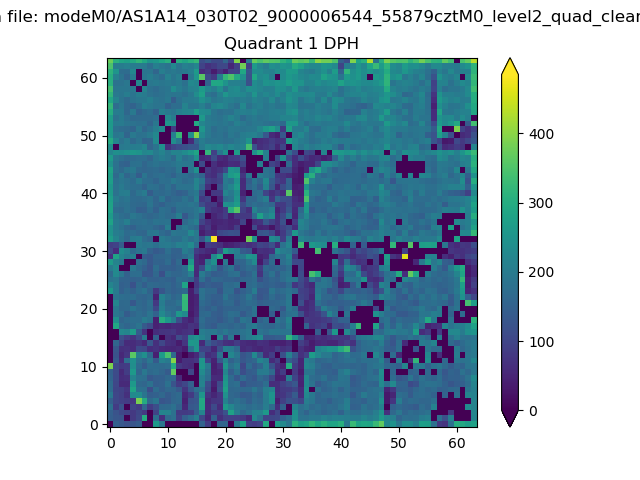 |
Quadrant B |
|---|---|---|---|
| Quadrant D | 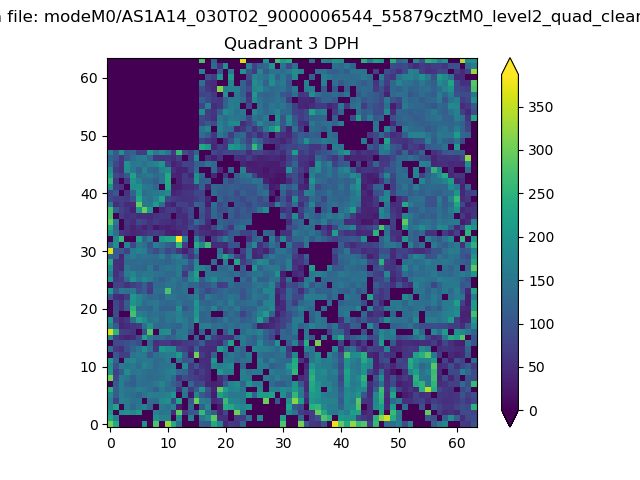 |
 |
Quadrant C |
| Plot type | Count rate plots | Images |
|---|---|---|
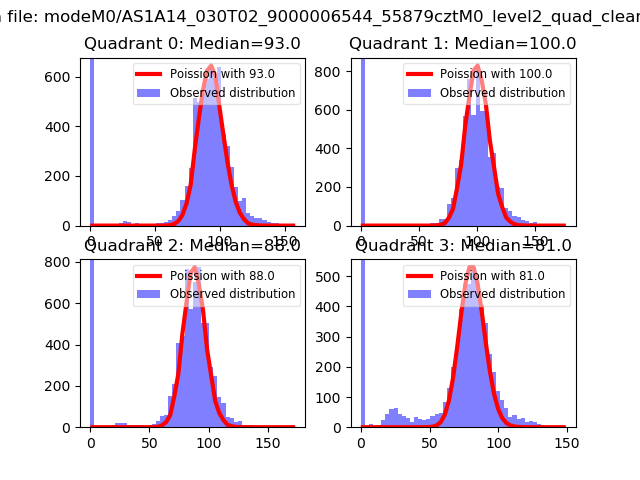
| Comparison with Poisson distribution Blue bars denote a histogram of data divided into 1 sec bins. Red curve is a Poisson curve with rate = median count rate of data. |
 |
 |
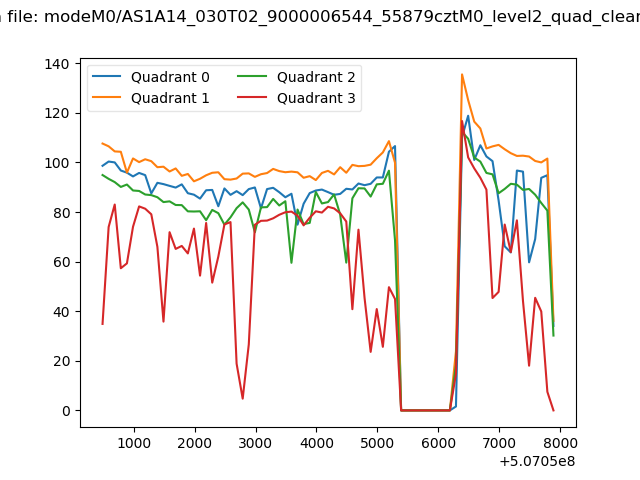
| Quadrant-wise count rates Data is divided into 100 sec bins |
 |
|
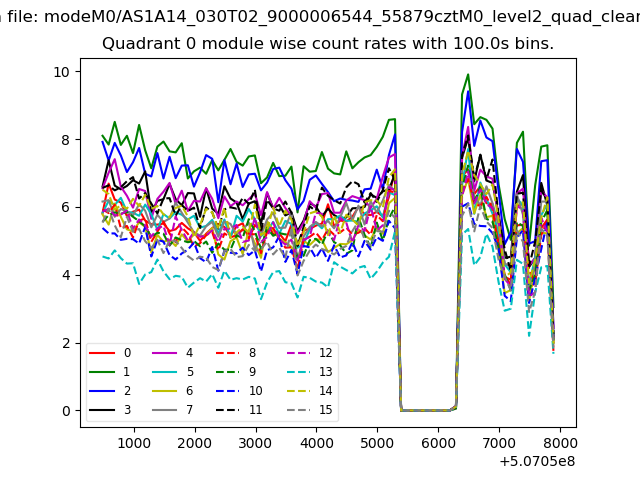
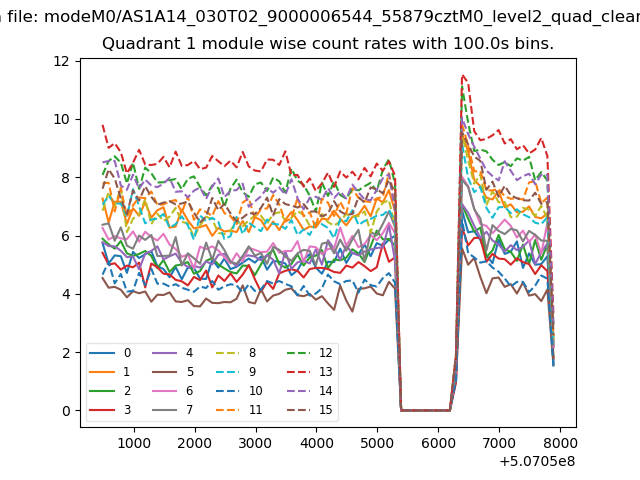
| Module-wise count rates for Quadrant A Data is divided into 100 sec bins |
 |
 |
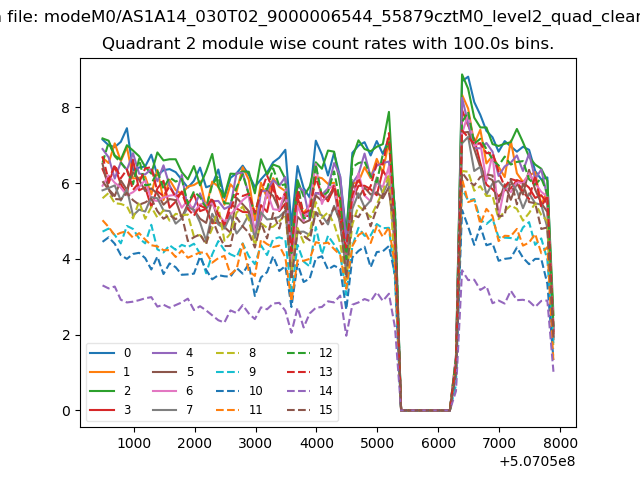
| Module-wise count rates for Quadrant B Data is divided into 100 sec bins |
 |
 |
| Module-wise count rates for Quadrant C Data is divided into 100 sec bins |
 |
 |
| Module-wise count rates for Quadrant D Data is divided into 100 sec bins |
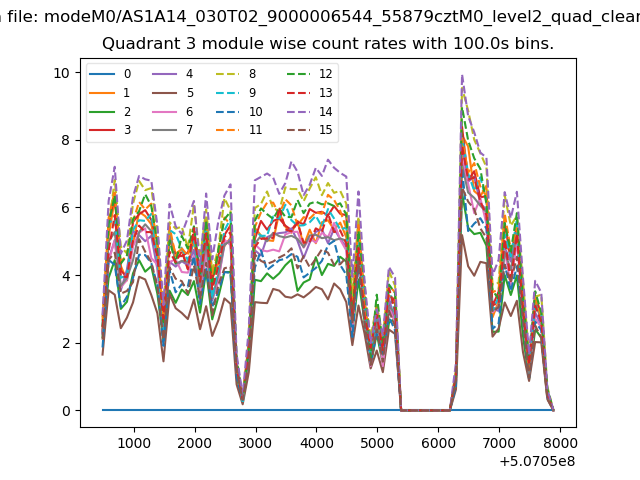 |
 |
| Parameter | Plot |
|---|---|
| CZT HV Monitor | 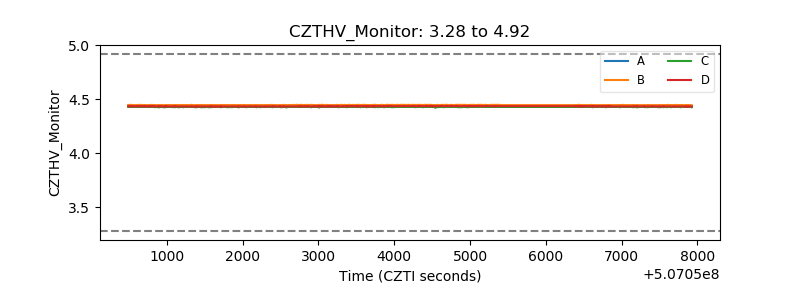 |
| D_VDD | 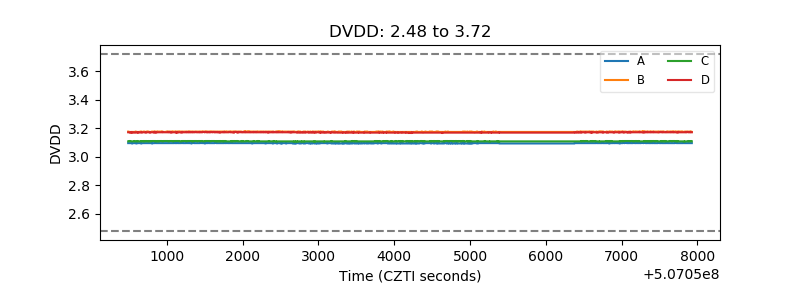 |
| Temperature 1 | 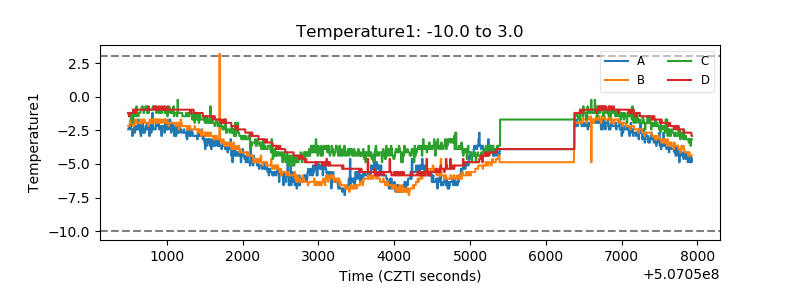 |
| Veto HV Monitor | 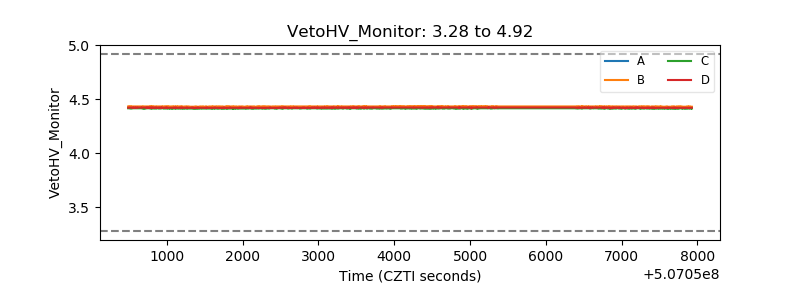 |
| Veto LLD | 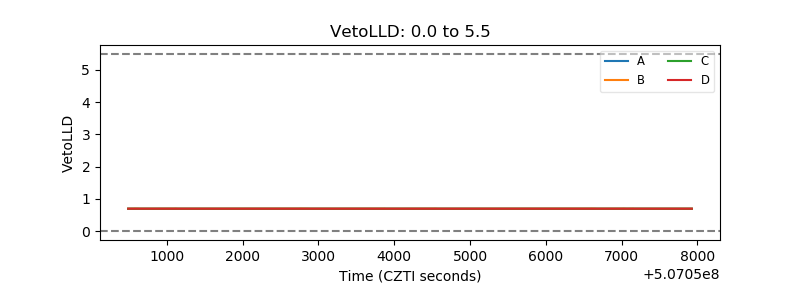 |
| Alpha Counter | 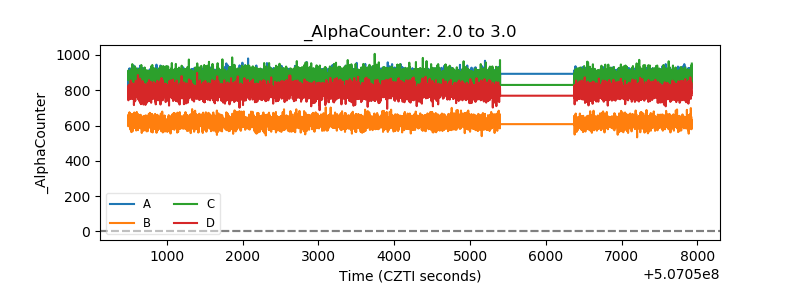 |
| _CPM_Rate | 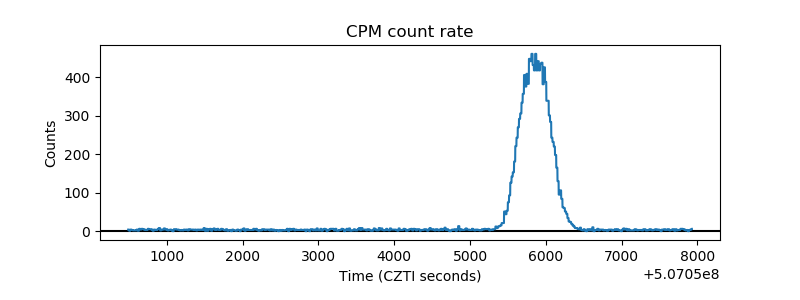 |
| CZT Counter | 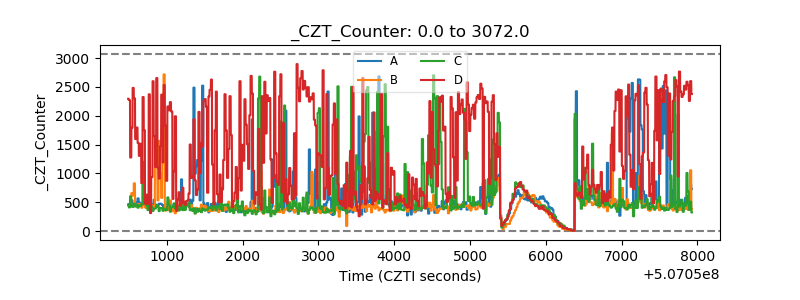 |
| +2.5 Volts monitor |  |
| +5 Volts monitor |  |
| _ROLL_ROT | 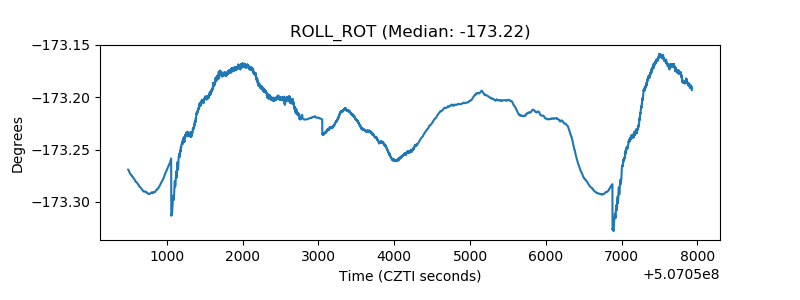 |
| _Roll_DEC | 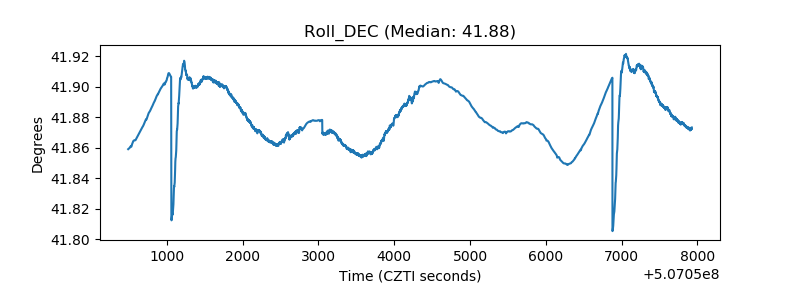 |
| _Roll_RA | 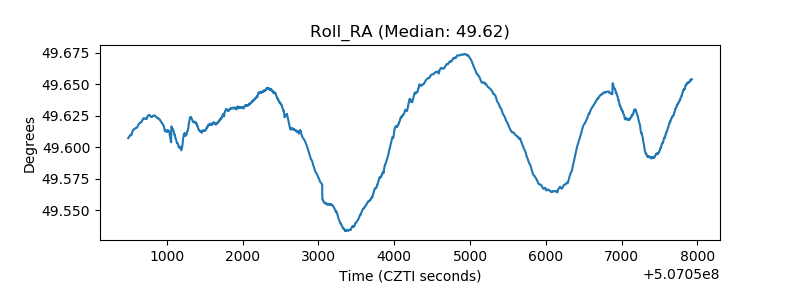 |
| Veto Counter | 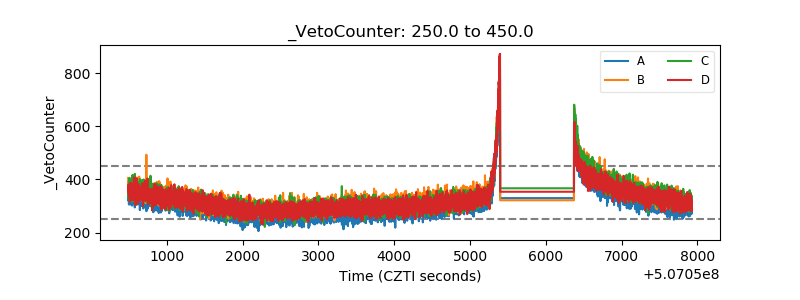 |