| Param | Original file | Final file |
|---|---|---|
| Filename | modeM0/AS1A14_030T02_9000006544_55880cztM0_level2.fits | modeM0/AS1A14_030T02_9000006544_55880cztM0_level2_quad_clean.evt |
| Size (bytes) | 589,798,080 | 87,707,520 |
| Size | 562.5 MB | 83.6 MB |
| Events in quadrant A | 4,065,923 | 600,384 |
| Events in quadrant B | 2,982,039 | 666,637 |
| Events in quadrant C | 3,932,166 | 577,384 |
| Events in quadrant D | 10,346,630 | 357,356 |
| Mode SS | |||
|---|---|---|---|
| Quadrant | BADHDUFLAG | Total packets | Discarded packets |
| A | 0 | 132 | 0 |
| B | 0 | 132 | 0 |
| C | 0 | 132 | 0 |
| D | 0 | 132 | 0 |
| Mode M9 | |||
|---|---|---|---|
| Quadrant | BADHDUFLAG | Total packets | Discarded packets |
| A | 0 | 11 | 0 |
| B | 0 | 11 | 0 |
| C | 0 | 11 | 0 |
| D | 0 | 11 | 0 |
| Mode M0 | |||
|---|---|---|---|
| Quadrant | BADHDUFLAG | Total packets | Discarded packets |
| A | 0 | 16799 | 2 |
| B | 0 | 13702 | 2 |
| C | 0 | 16519 | 2 |
| D | 0 | 35232 | 2 |
| Quadrant | Total seconds | Saturated seconds | Saturation percentage |
|---|---|---|---|
| A | 6504 | 330 | 5.073801% |
| B | 6505 | 58 | 0.891622% |
| C | 6505 | 267 | 4.104535% |
| D | 6505 | 2731 | 41.983090% |
Noise dominated data is calculated using 1-second bins in cleaned event files. If a bin has >2000 counts, and if more than 50% of those come from <1% of pixels, then it is considered to be noise-dominated and hence unusable.
| Quadrant | # 1 sec bins | Bins with >0 counts | Bins with >2000 counts | High rate bins dominated by noise | Noise dominated (total time) | Noise dominated (detector-on time) | Marked lightcurve |
|---|---|---|---|---|---|---|---|
| A | 7579 | 6505 | 248 | 248 | 3.27% | 3.81% | 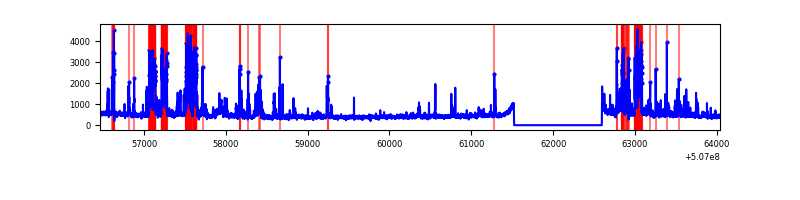 |
| B | 7580 | 6506 | 7 | 7 | 0.09% | 0.11% | 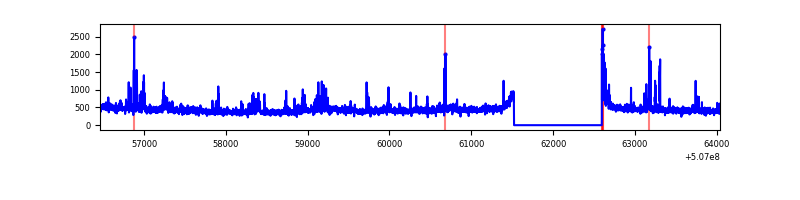 |
| C | 7580 | 6506 | 194 | 194 | 2.56% | 2.98% | 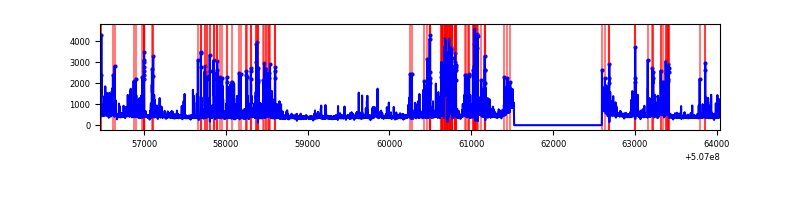 |
| D | 7580 | 6505 | 2306 | 2306 | 30.42% | 35.45% | 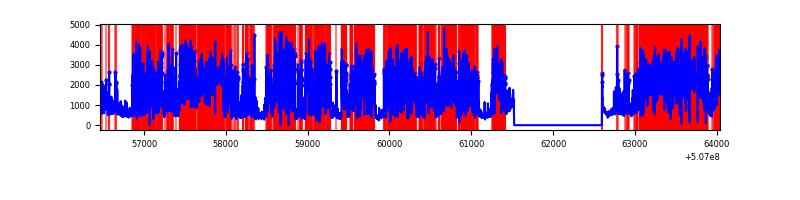 |
Top three noisy pixels from each quadrant. If the there are fewer than three noisy pixels in the level2.evt file, extra rows are filled as -1
| Pixel properties | Quadrant properties | ||||||
|---|---|---|---|---|---|---|---|
| Quadrant | DetID | PixID | Counts | Sigma | Mean | Median | Sigma |
| A | 15 | 32 | 967829 | 5884.91 | 666 | 651 | 164.3 |
| A | 4 | 249 | 119507 | 723.19 | 666 | 651 | 164.3 |
| A | 4 | 3 | 85269 | 514.87 | 666 | 651 | 164.3 |
| B | 0 | 199 | 70972 | 486.37 | 672 | 649 | 144.6 |
| B | 0 | 197 | 54742 | 374.12 | 672 | 649 | 144.6 |
| B | 0 | 153 | 49024 | 334.57 | 672 | 649 | 144.6 |
| C | 12 | 254 | 741027 | 4117.57 | 653 | 647 | 179.8 |
| C | 13 | 3 | 250003 | 1386.78 | 653 | 647 | 179.8 |
| C | 12 | 252 | 144433 | 799.66 | 653 | 647 | 179.8 |
| D | 11 | 129 | 7648896 | 50935.67 | 533 | 511 | 150.2 |
| D | 2 | 31 | 175731 | 1166.91 | 533 | 511 | 150.2 |
| D | 7 | 96 | 120392 | 798.37 | 533 | 511 | 150.2 |
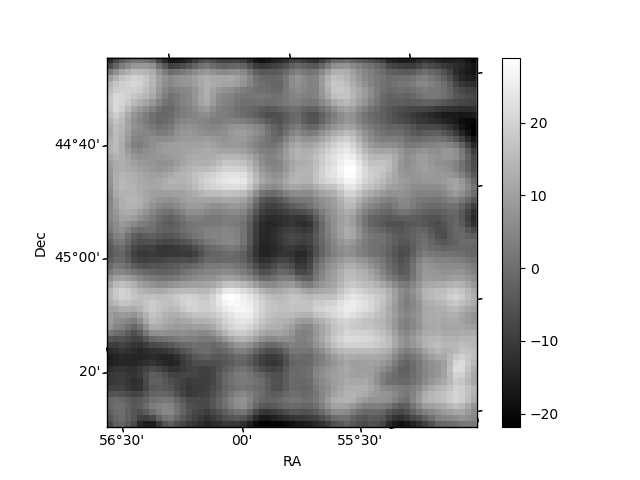
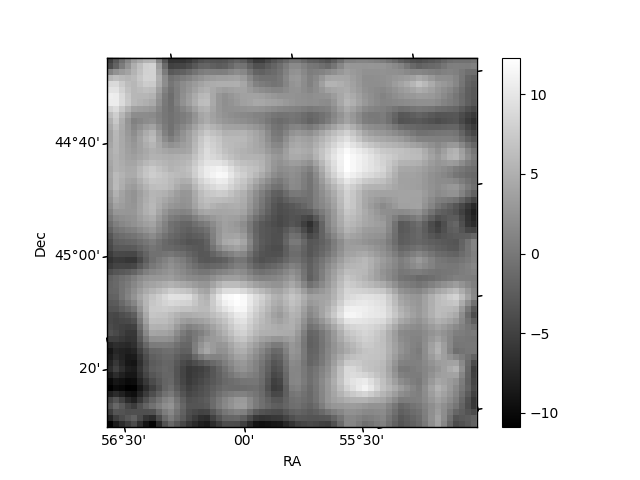
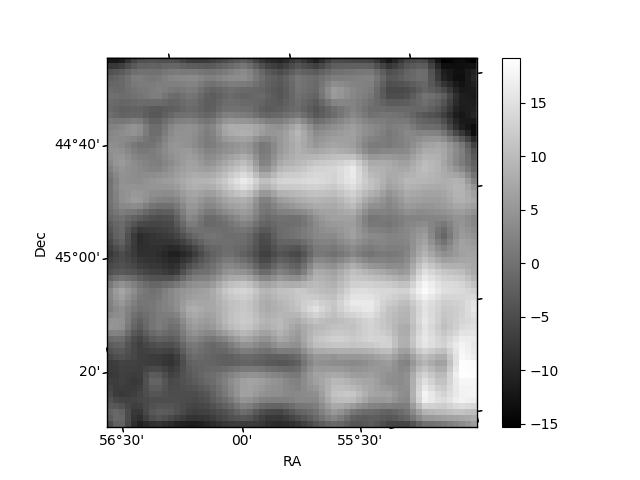
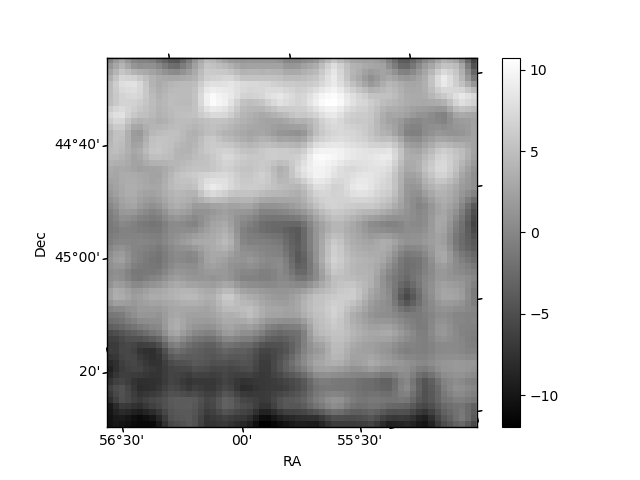
Histogram calculated using DETX and DETY for each event in the final _common_clean file
| Quadrant A | 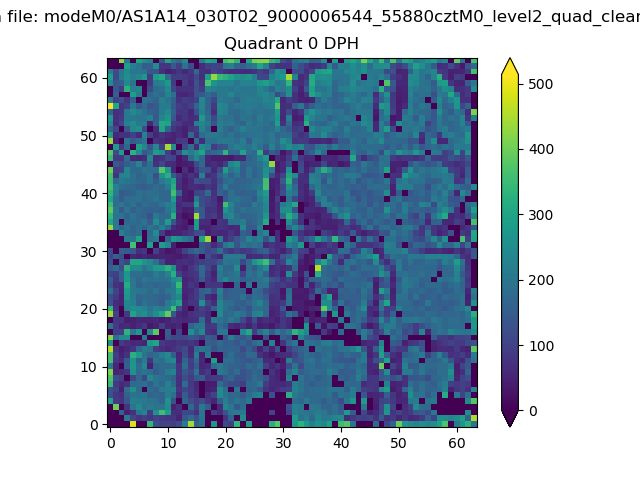 |
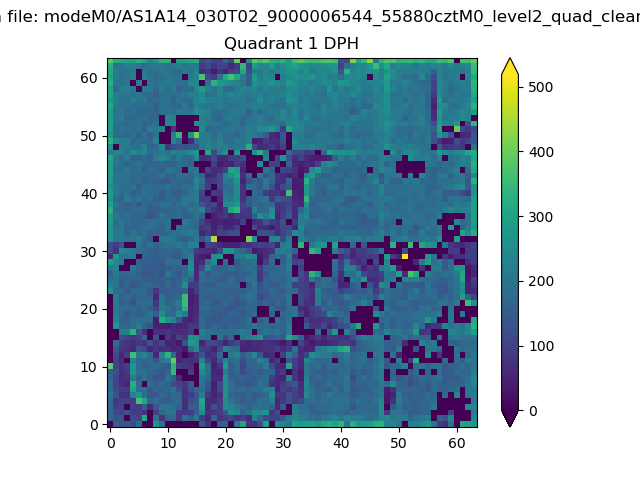 |
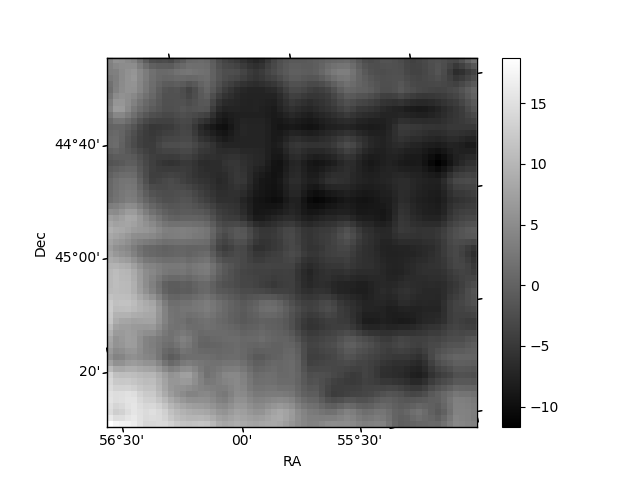
Quadrant B |
|---|---|---|---|
| Quadrant D | 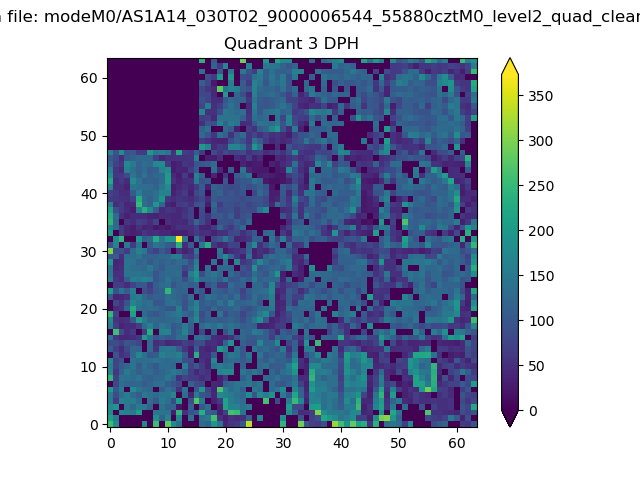 |
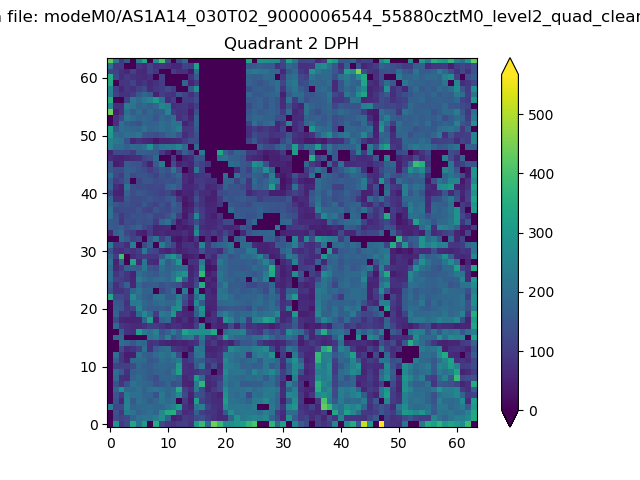 |
Quadrant C |
| Plot type | Count rate plots | Images |
|---|---|---|
| Comparison with Poisson distribution Blue bars denote a histogram of data divided into 1 sec bins. Red curve is a Poisson curve with rate = median count rate of data. |
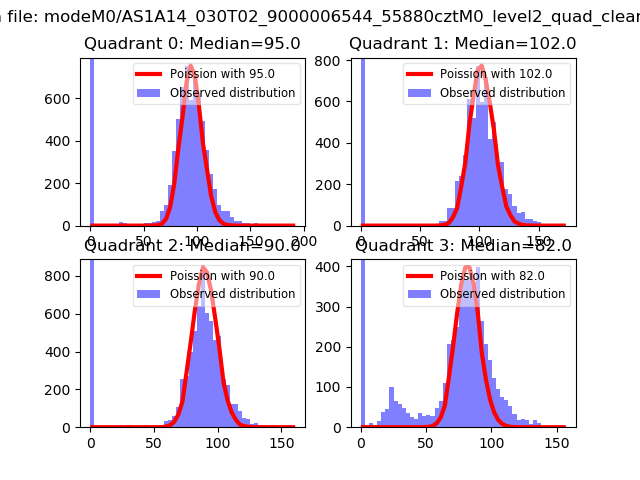 |
 |
| Quadrant-wise count rates Data is divided into 100 sec bins |
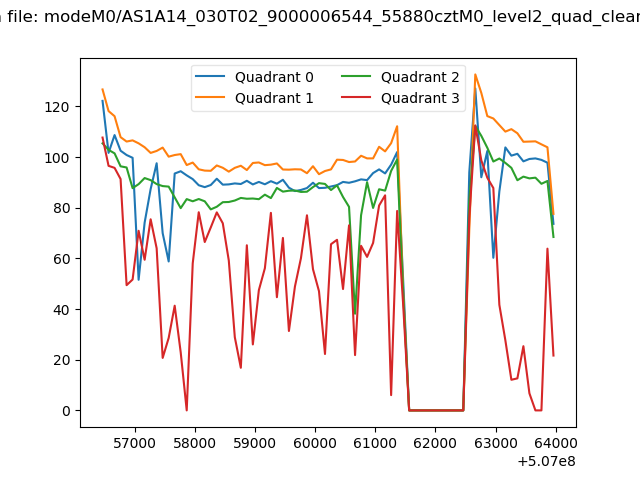 |
|
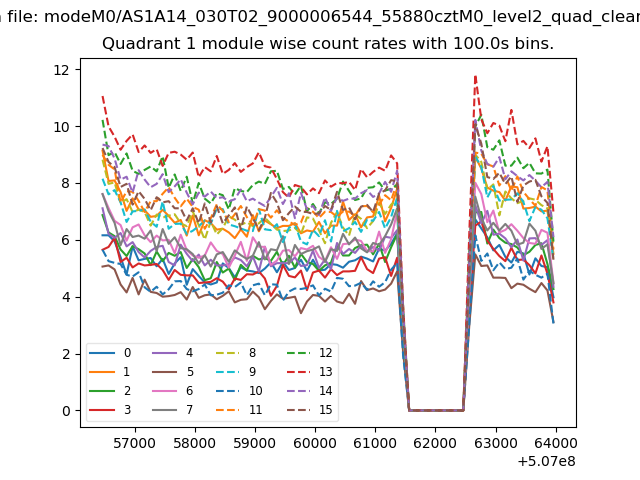
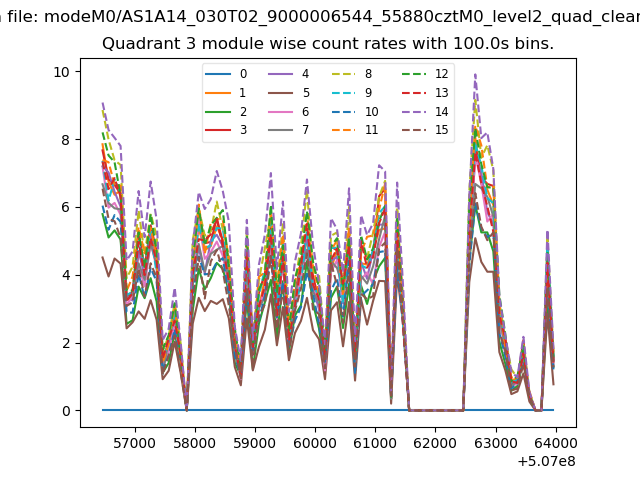
| Module-wise count rates for Quadrant A Data is divided into 100 sec bins |
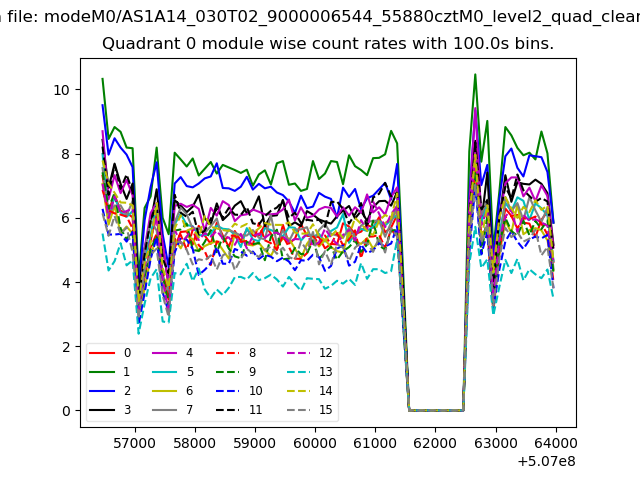 |
 |
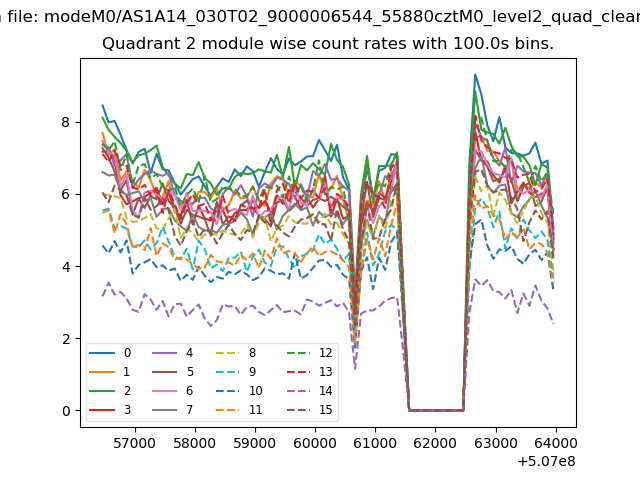
| Module-wise count rates for Quadrant B Data is divided into 100 sec bins |
 |
 |
| Module-wise count rates for Quadrant C Data is divided into 100 sec bins |
 |
 |
| Module-wise count rates for Quadrant D Data is divided into 100 sec bins |
 |
 |
| Parameter | Plot |
|---|---|
| CZT HV Monitor | 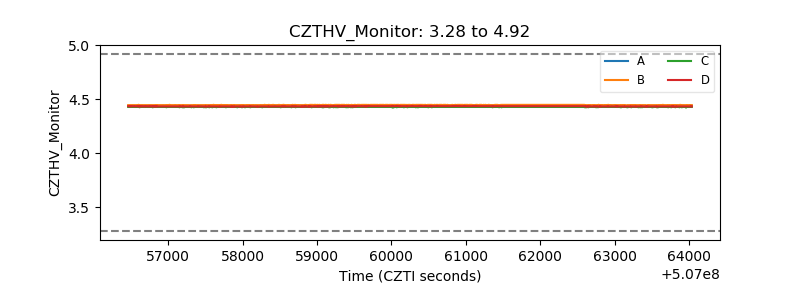 |
| D_VDD | 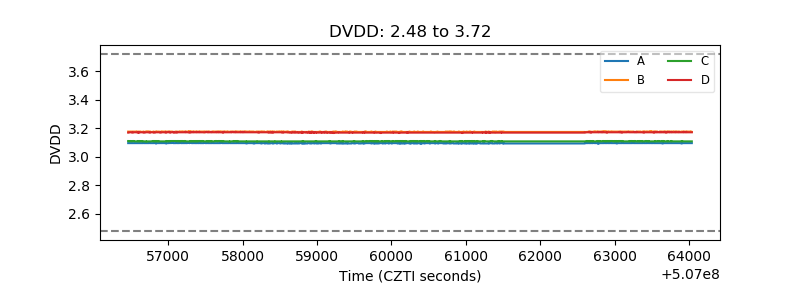 |
| Temperature 1 | 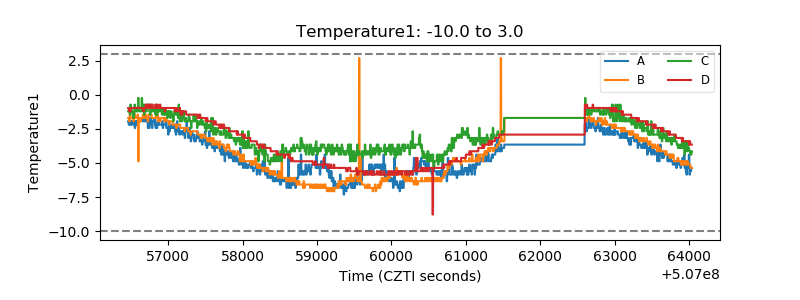 |
| Veto HV Monitor | 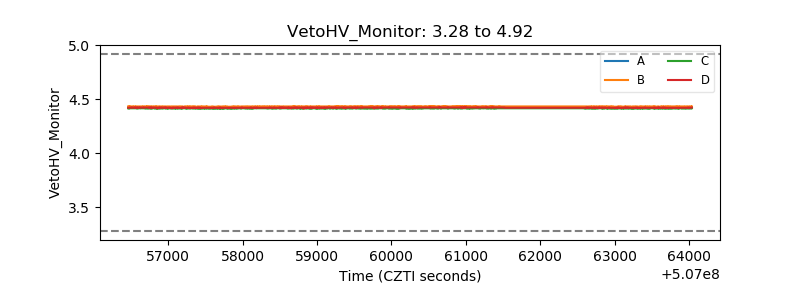 |
| Veto LLD | 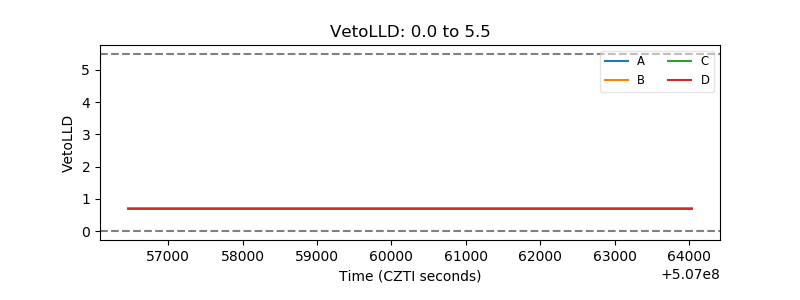 |
| Alpha Counter | 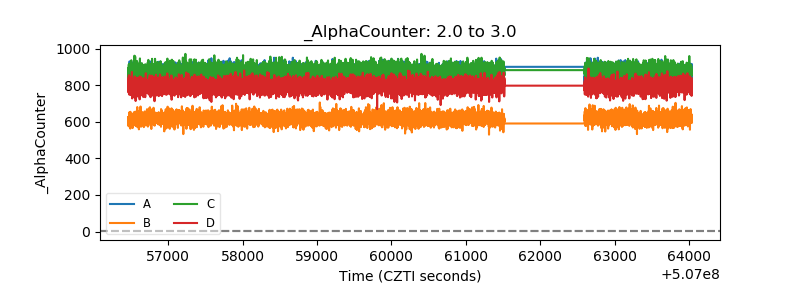 |
| _CPM_Rate | 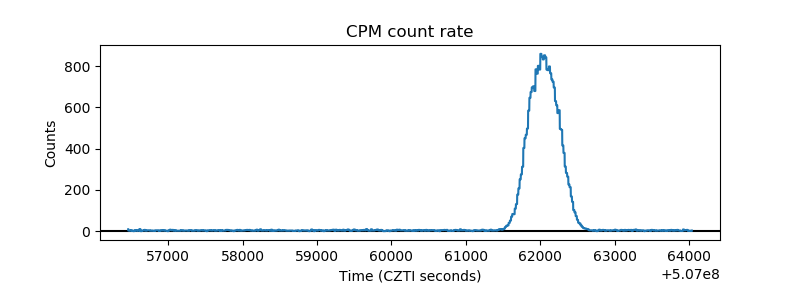 |
| CZT Counter | 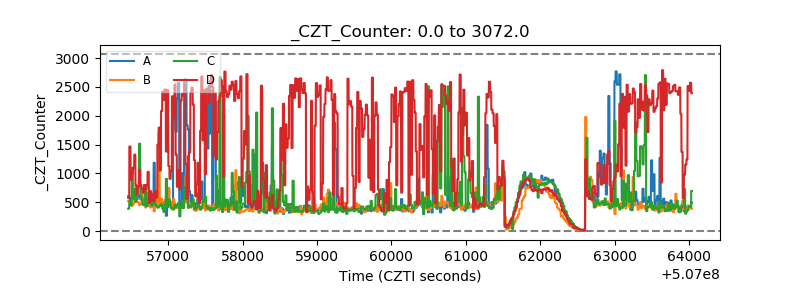 |
| +2.5 Volts monitor |  |
| +5 Volts monitor |  |
| _ROLL_ROT | 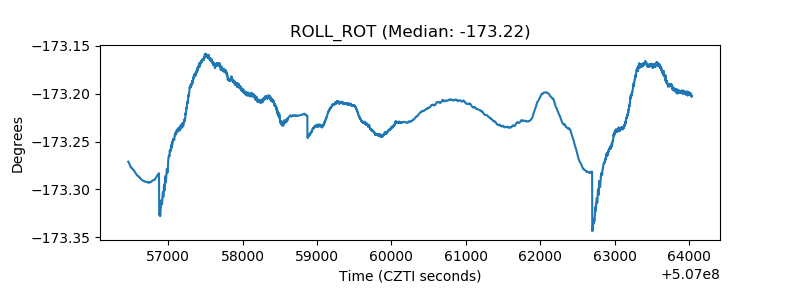 |
| _Roll_DEC | 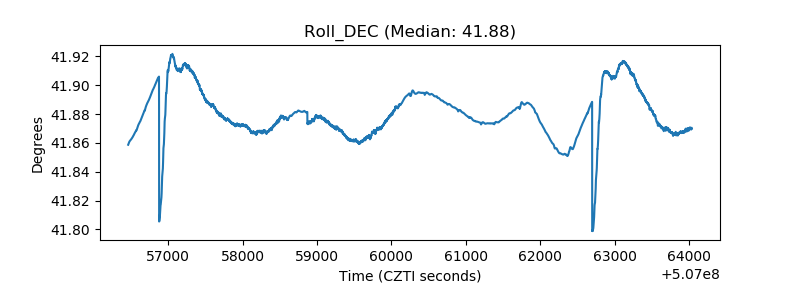 |
| _Roll_RA | 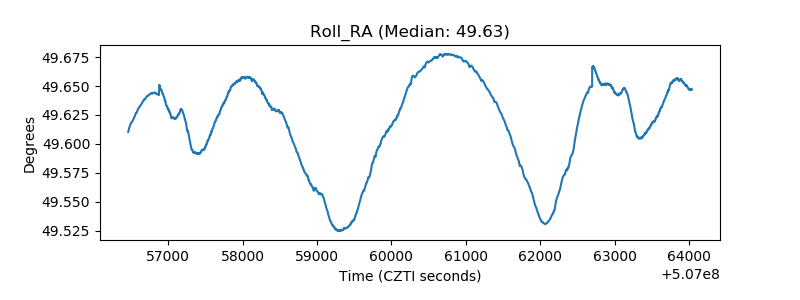 |
| Veto Counter | 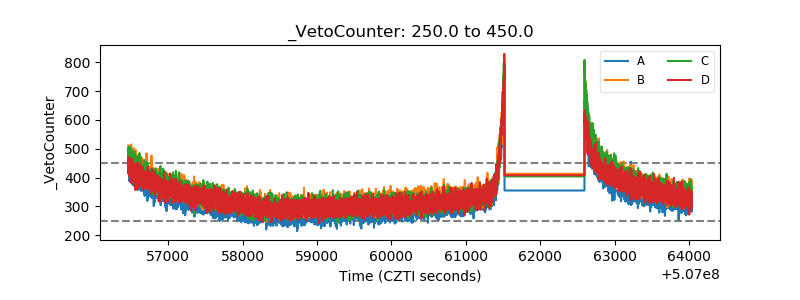 |