| Param | Original file | Final file |
|---|---|---|
| Filename | modeM0/AS1A14_030T02_9000006544_55881cztM0_level2.fits | modeM0/AS1A14_030T02_9000006544_55881cztM0_level2_quad_clean.evt |
| Size (bytes) | 533,393,280 | 91,157,760 |
| Size | 508.7 MB | 86.9 MB |
| Events in quadrant A | 3,578,306 | 620,141 |
| Events in quadrant B | 2,992,981 | 677,333 |
| Events in quadrant C | 3,859,721 | 589,599 |
| Events in quadrant D | 8,811,908 | 422,954 |
| Mode SS | |||
|---|---|---|---|
| Quadrant | BADHDUFLAG | Total packets | Discarded packets |
| A | 0 | 130 | 0 |
| B | 0 | 130 | 0 |
| C | 0 | 130 | 0 |
| D | 0 | 130 | 0 |
| Mode M9 | |||
|---|---|---|---|
| Quadrant | BADHDUFLAG | Total packets | Discarded packets |
| A | 0 | 16 | 0 |
| B | 0 | 16 | 0 |
| C | 0 | 17 | 0 |
| D | 0 | 17 | 0 |
| Mode M0 | |||
|---|---|---|---|
| Quadrant | BADHDUFLAG | Total packets | Discarded packets |
| A | 0 | 15495 | 2 |
| B | 0 | 13698 | 2 |
| C | 0 | 16039 | 2 |
| D | 0 | 30686 | 2 |
| Quadrant | Total seconds | Saturated seconds | Saturation percentage |
|---|---|---|---|
| A | 6455 | 146 | 2.261813% |
| B | 6455 | 53 | 0.821069% |
| C | 6455 | 227 | 3.516654% |
| D | 6455 | 1915 | 29.666925% |
Noise dominated data is calculated using 1-second bins in cleaned event files. If a bin has >2000 counts, and if more than 50% of those come from <1% of pixels, then it is considered to be noise-dominated and hence unusable.
| Quadrant | # 1 sec bins | Bins with >0 counts | Bins with >2000 counts | High rate bins dominated by noise | Noise dominated (total time) | Noise dominated (detector-on time) | Marked lightcurve |
|---|---|---|---|---|---|---|---|
| A | 7655 | 6456 | 106 | 106 | 1.38% | 1.64% | 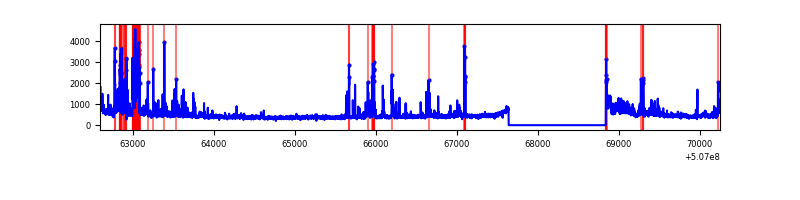 |
| B | 7655 | 6456 | 21 | 21 | 0.27% | 0.33% | 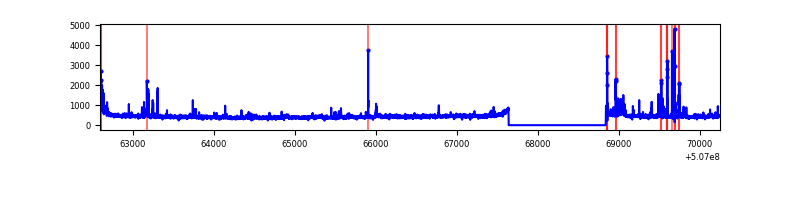 |
| C | 7655 | 6456 | 176 | 176 | 2.30% | 2.73% | 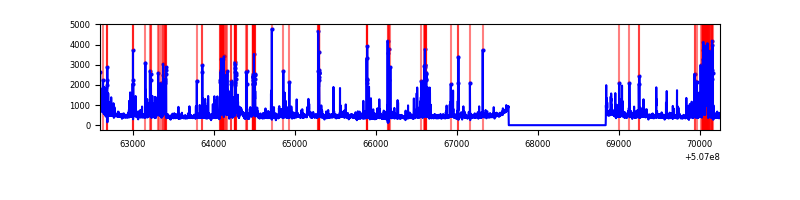 |
| D | 7655 | 6456 | 1626 | 1626 | 21.24% | 25.19% | 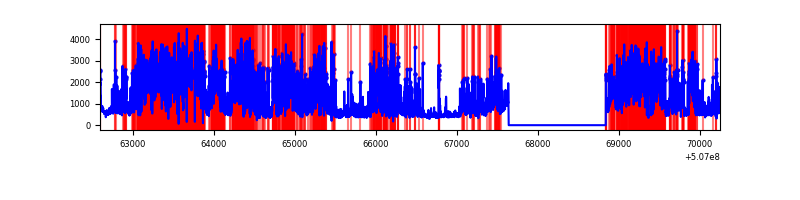 |
Top three noisy pixels from each quadrant. If the there are fewer than three noisy pixels in the level2.evt file, extra rows are filled as -1
| Pixel properties | Quadrant properties | ||||||
|---|---|---|---|---|---|---|---|
| Quadrant | DetID | PixID | Counts | Sigma | Mean | Median | Sigma |
| A | 15 | 32 | 403610 | 2441.98 | 668 | 652 | 165.0 |
| A | 12 | 115 | 194217 | 1173.03 | 668 | 652 | 165.0 |
| A | 0 | 8 | 134677 | 812.21 | 668 | 652 | 165.0 |
| B | 5 | 185 | 75589 | 518.9 | 671 | 648 | 144.4 |
| B | 0 | 153 | 51919 | 355.01 | 671 | 648 | 144.4 |
| B | 2 | 249 | 45571 | 311.05 | 671 | 648 | 144.4 |
| C | 12 | 254 | 800592 | 4478.18 | 655 | 649 | 178.6 |
| C | 13 | 3 | 230602 | 1287.3 | 655 | 649 | 178.6 |
| C | 12 | 252 | 114763 | 638.82 | 655 | 649 | 178.6 |
| D | 11 | 129 | 5510921 | 33799.61 | 574 | 550 | 163.0 |
| D | 2 | 31 | 302751 | 1853.65 | 574 | 550 | 163.0 |
| D | 2 | 62 | 248474 | 1520.72 | 574 | 550 | 163.0 |
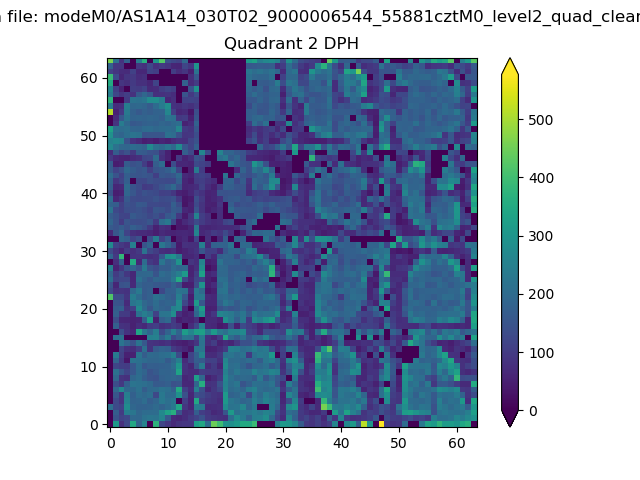
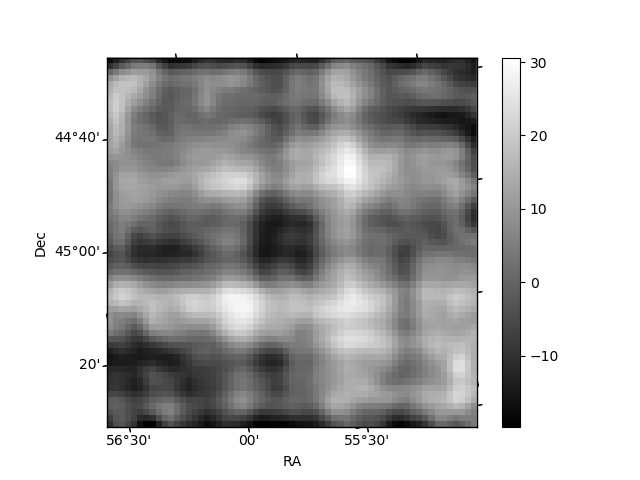
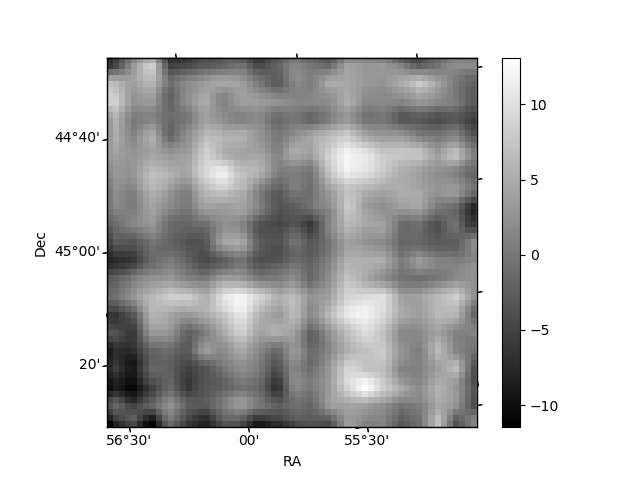
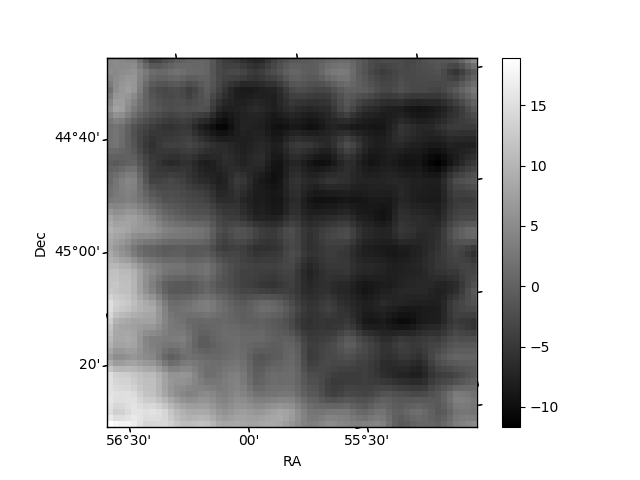
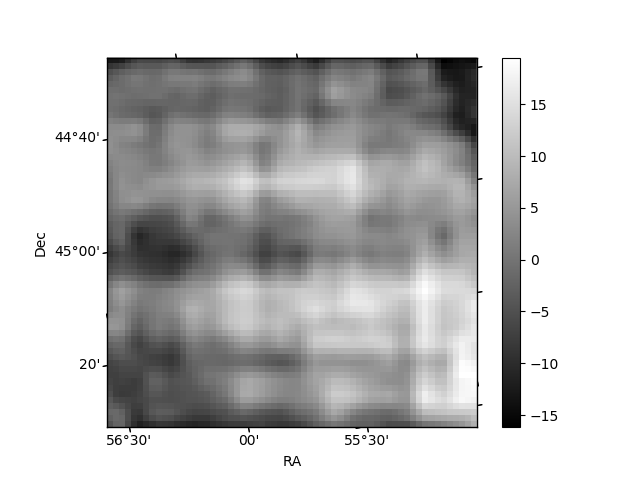
Histogram calculated using DETX and DETY for each event in the final _common_clean file
| Quadrant A | 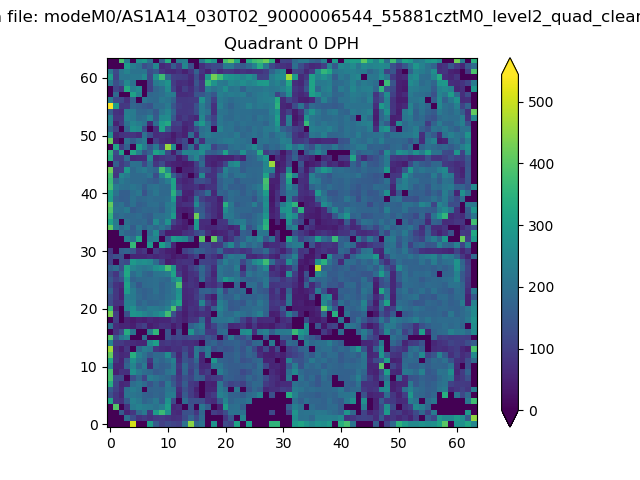 |
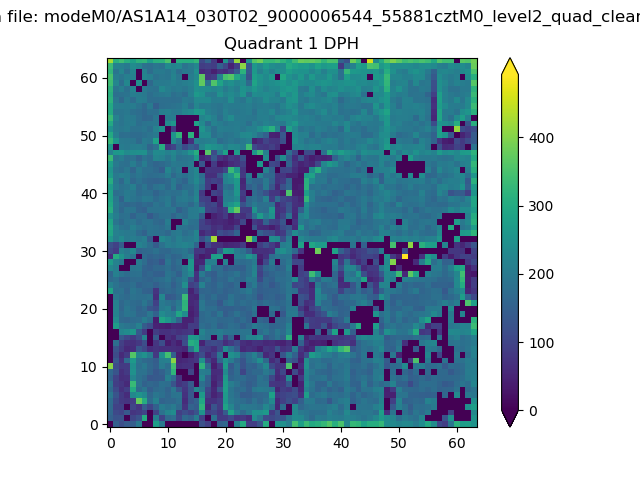 |
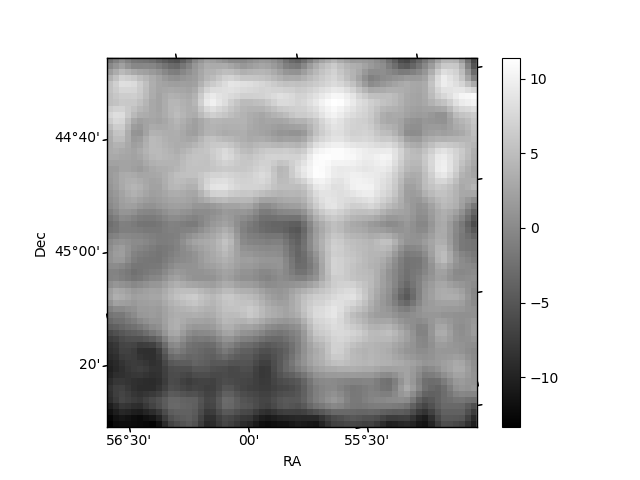
Quadrant B |
|---|---|---|---|
| Quadrant D | 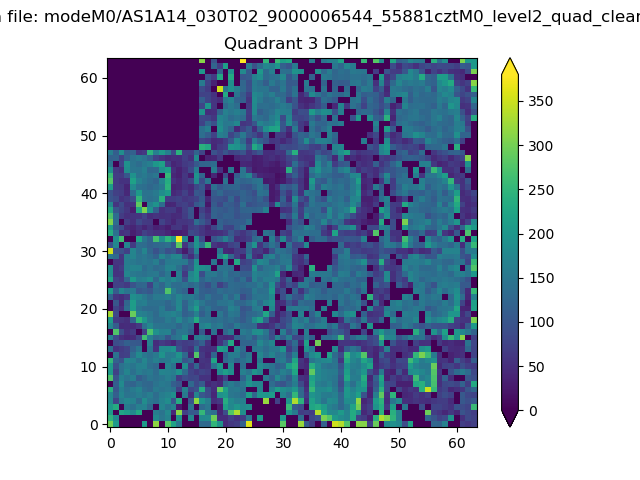 |
 |
Quadrant C |
| Plot type | Count rate plots | Images |
|---|---|---|
| Comparison with Poisson distribution Blue bars denote a histogram of data divided into 1 sec bins. Red curve is a Poisson curve with rate = median count rate of data. |
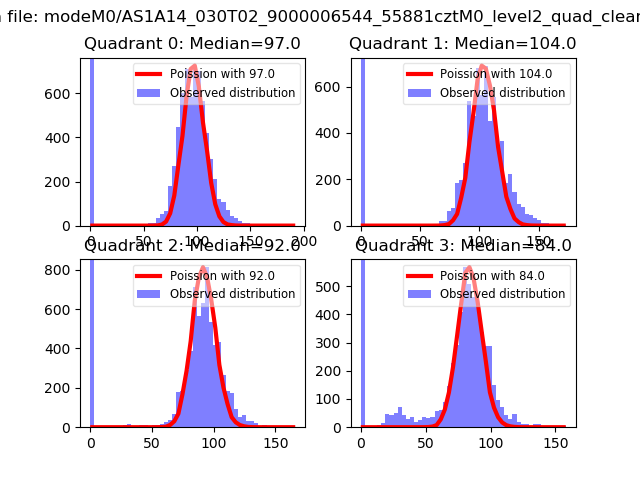 |
 |
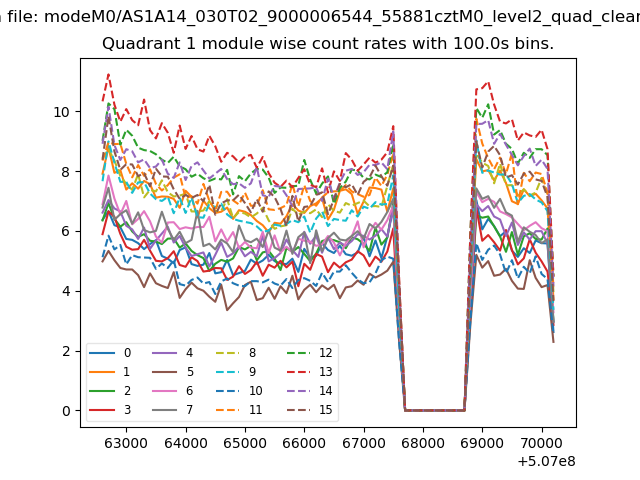
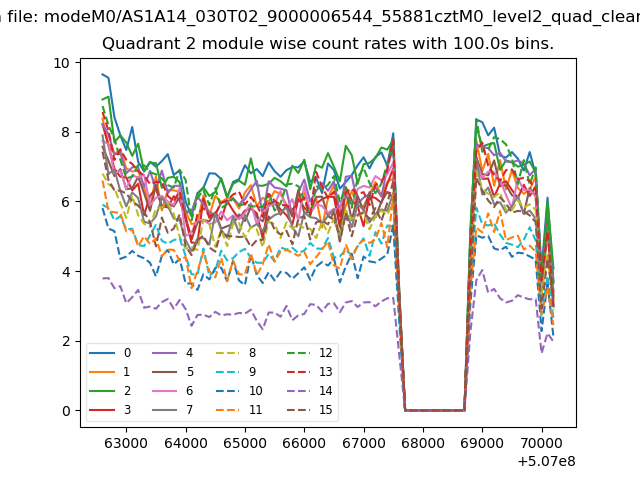
| Quadrant-wise count rates Data is divided into 100 sec bins |
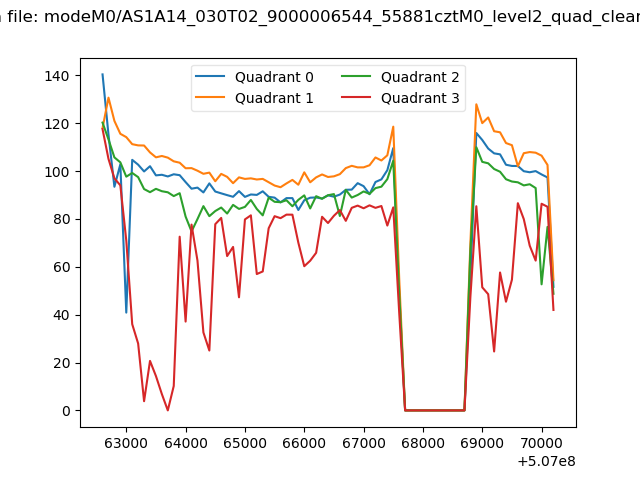 |
|
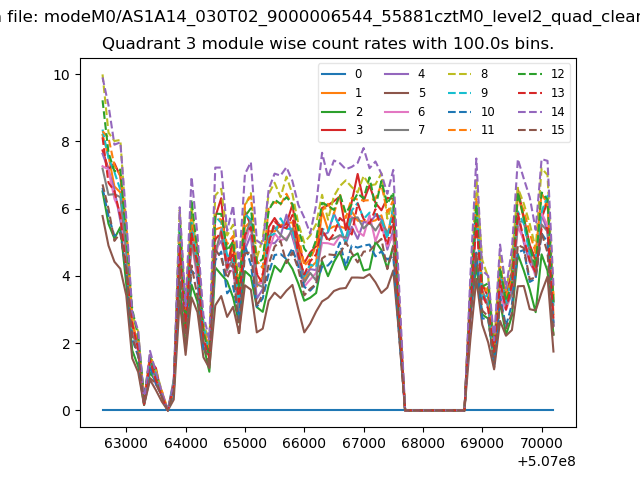
| Module-wise count rates for Quadrant A Data is divided into 100 sec bins |
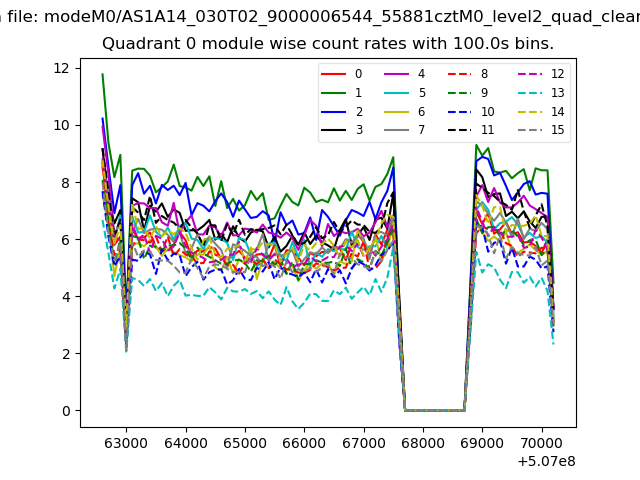 |
 |
| Module-wise count rates for Quadrant B Data is divided into 100 sec bins |
 |
 |
| Module-wise count rates for Quadrant C Data is divided into 100 sec bins |
 |
 |
| Module-wise count rates for Quadrant D Data is divided into 100 sec bins |
 |
 |
| Parameter | Plot |
|---|---|
| CZT HV Monitor | 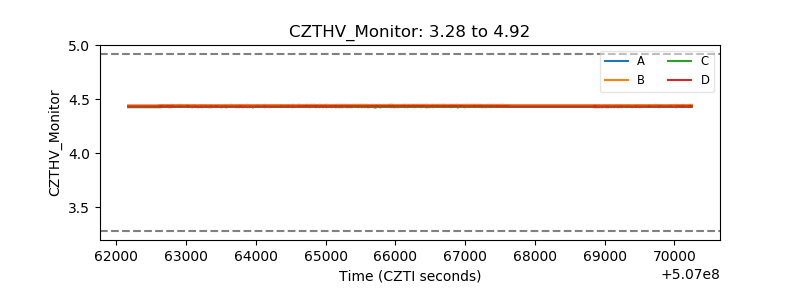 |
| D_VDD | 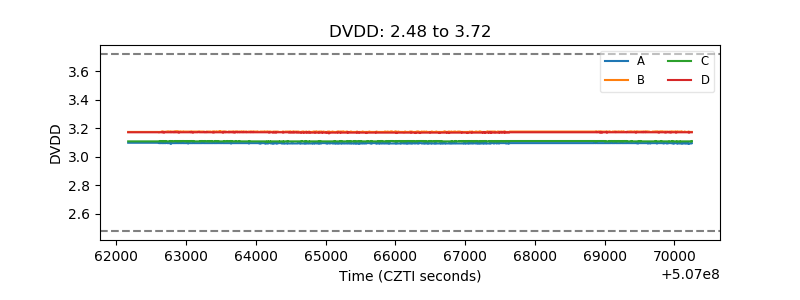 |
| Temperature 1 | 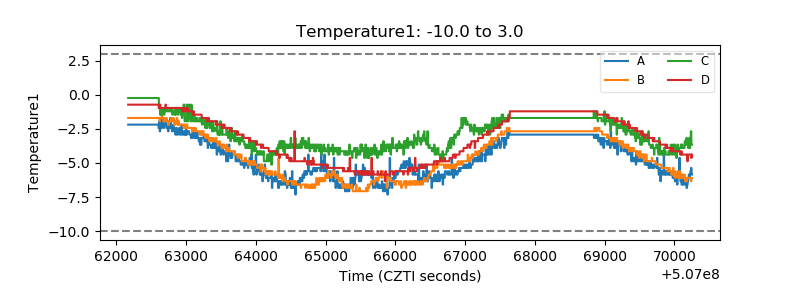 |
| Veto HV Monitor | 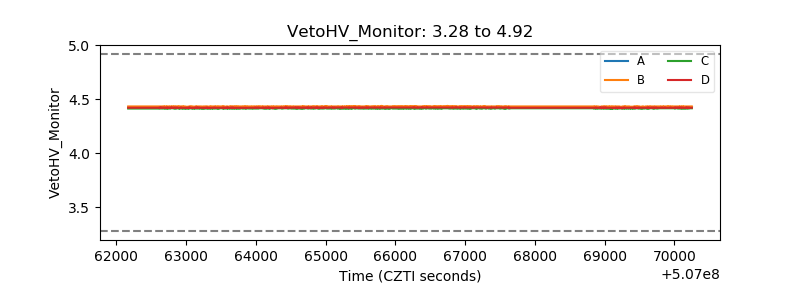 |
| Veto LLD | 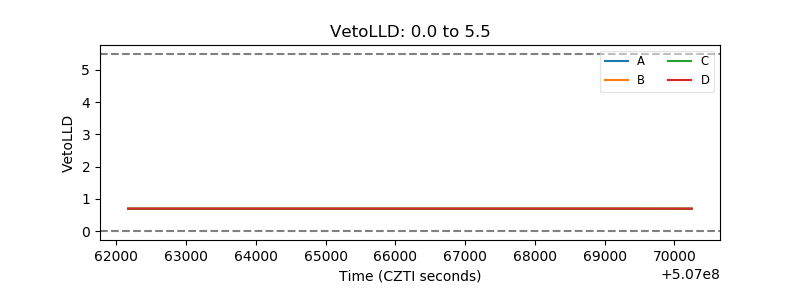 |
| Alpha Counter | 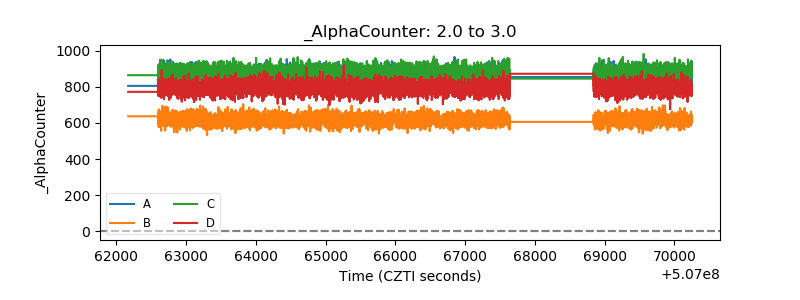 |
| _CPM_Rate | 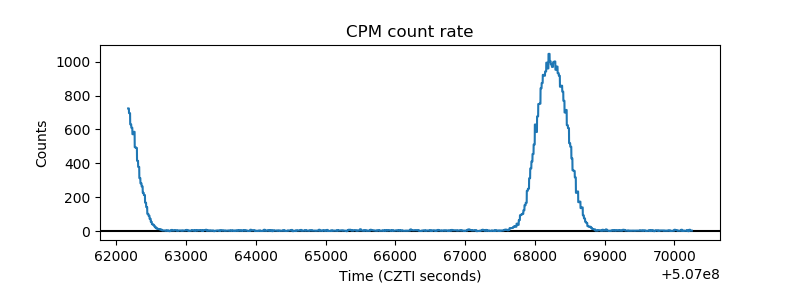 |
| CZT Counter | 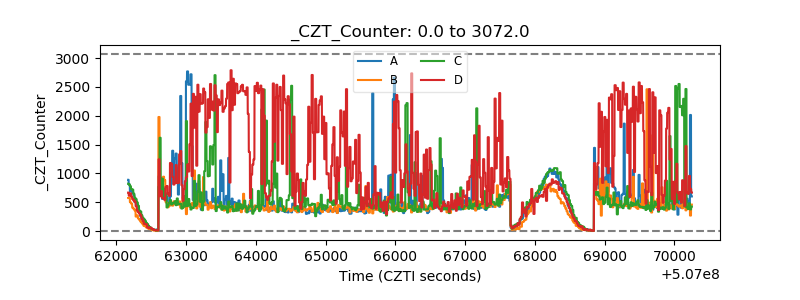 |
| +2.5 Volts monitor | 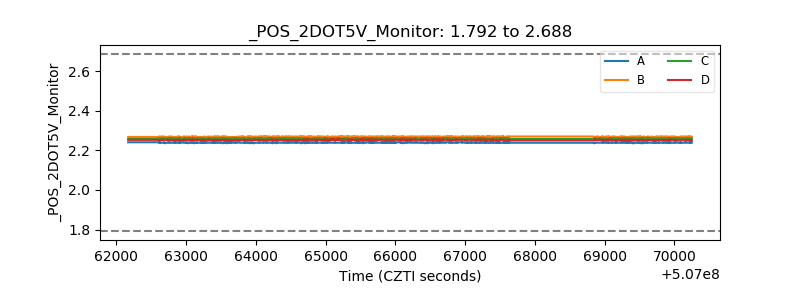 |
| +5 Volts monitor |  |
| _ROLL_ROT | 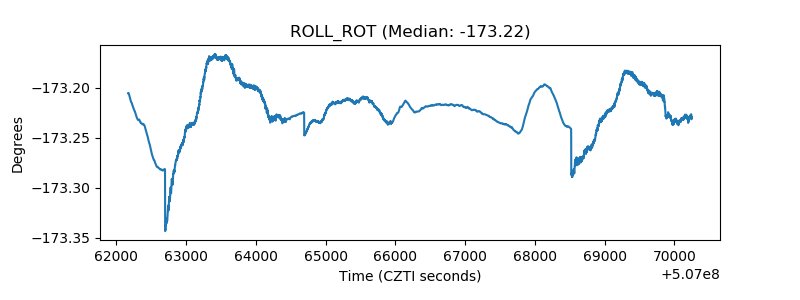 |
| _Roll_DEC | 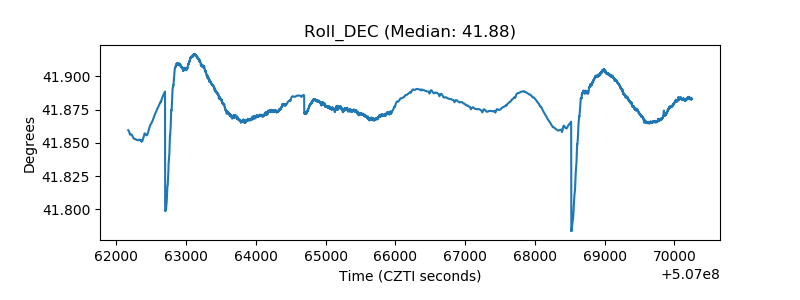 |
| _Roll_RA | 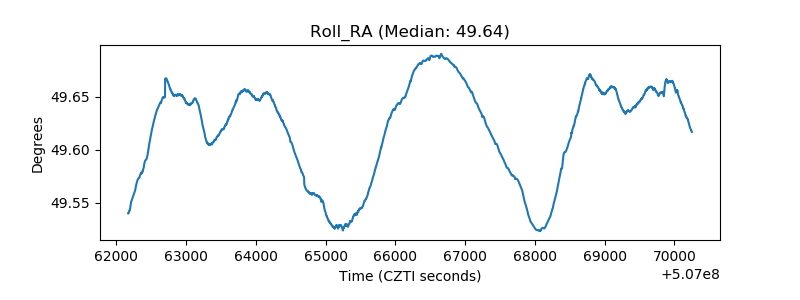 |
| Veto Counter | 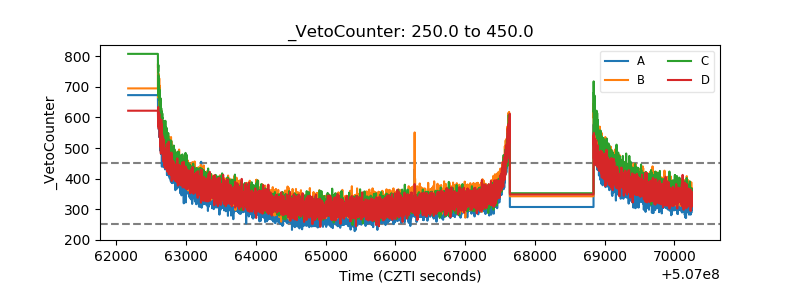 |