| Param | Original file | Final file |
|---|---|---|
| Filename | modeM0/AS1A14_030T02_9000006544_55882cztM0_level2.fits | modeM0/AS1A14_030T02_9000006544_55882cztM0_level2_quad_clean.evt |
| Size (bytes) | 2,728,059,840 | 481,259,520 |
| Size | 2.5 GB | 459.0 MB |
| Events in quadrant A | 29,544,173 | 3,030,737 |
| Events in quadrant B | 16,106,342 | 3,513,703 |
| Events in quadrant C | 28,770,795 | 2,761,714 |
| Events in quadrant D | 23,860,658 | 2,860,912 |
| Mode SS | |||
|---|---|---|---|
| Quadrant | BADHDUFLAG | Total packets | Discarded packets |
| A | 0 | 710 | 0 |
| B | 0 | 710 | 0 |
| C | 0 | 710 | 0 |
| D | 0 | 710 | 0 |
| Mode M9 | |||
|---|---|---|---|
| Quadrant | BADHDUFLAG | Total packets | Discarded packets |
| A | 0 | 47 | 0 |
| B | 0 | 47 | 0 |
| C | 0 | 48 | 0 |
| D | 0 | 48 | 0 |
| Mode M0 | |||
|---|---|---|---|
| Quadrant | BADHDUFLAG | Total packets | Discarded packets |
| A | 0 | 112364 | 5 |
| B | 0 | 73470 | 5 |
| C | 0 | 111440 | 12 |
| D | 0 | 95179 | 5 |
| Quadrant | Total seconds | Saturated seconds | Saturation percentage |
|---|---|---|---|
| A | 34987 | 2822 | 8.065853% |
| B | 34987 | 310 | 0.886043% |
| C | 34985 | 4883 | 13.957410% |
| D | 34986 | 1370 | 3.915852% |
Noise dominated data is calculated using 1-second bins in cleaned event files. If a bin has >2000 counts, and if more than 50% of those come from <1% of pixels, then it is considered to be noise-dominated and hence unusable.
| Quadrant | # 1 sec bins | Bins with >0 counts | Bins with >2000 counts | High rate bins dominated by noise | Noise dominated (total time) | Noise dominated (detector-on time) | Marked lightcurve |
|---|---|---|---|---|---|---|---|
| A | 38887 | 34991 | 2502 | 2502 | 6.43% | 7.15% | 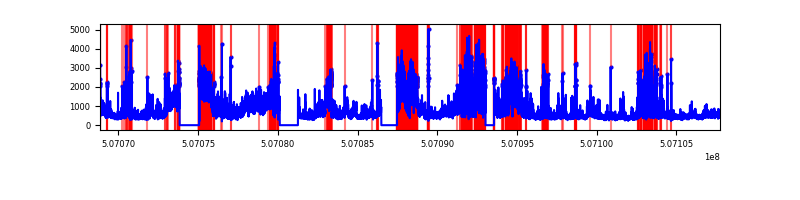 |
| B | 38887 | 34991 | 37 | 37 | 0.10% | 0.11% | 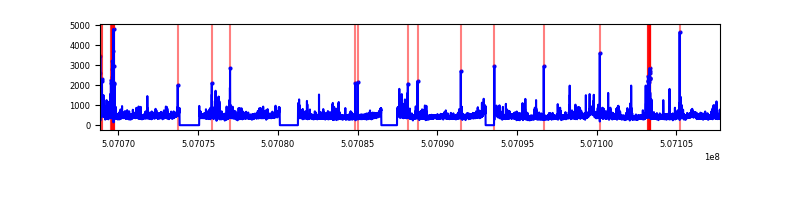 |
| C | 38886 | 34990 | 4017 | 4017 | 10.33% | 11.48% | 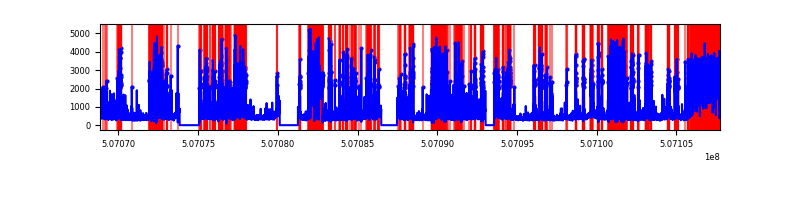 |
| D | 38886 | 34990 | 1189 | 1189 | 3.06% | 3.40% | 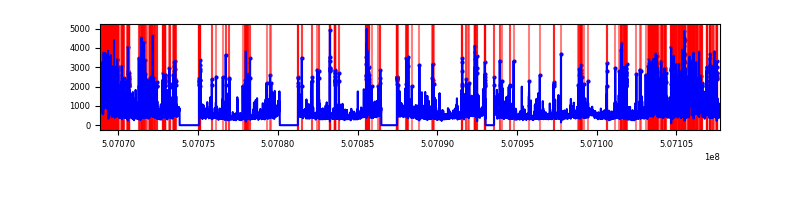 |
Top three noisy pixels from each quadrant. If the there are fewer than three noisy pixels in the level2.evt file, extra rows are filled as -1
| Pixel properties | Quadrant properties | ||||||
|---|---|---|---|---|---|---|---|
| Quadrant | DetID | PixID | Counts | Sigma | Mean | Median | Sigma |
| A | 12 | 115 | 10838675 | 12558.58 | 3533 | 3446 | 862.8 |
| A | 15 | 32 | 2126942 | 2461.24 | 3533 | 3446 | 862.8 |
| A | 3 | 14 | 1282863 | 1482.91 | 3533 | 3446 | 862.8 |
| B | 0 | 199 | 525435 | 682.56 | 3609 | 3475 | 764.7 |
| B | 0 | 197 | 267488 | 345.25 | 3609 | 3475 | 764.7 |
| B | 2 | 249 | 250484 | 323.01 | 3609 | 3475 | 764.7 |
| C | 15 | 199 | 6765589 | 7518.28 | 3305 | 3281 | 899.4 |
| C | 12 | 254 | 5439252 | 6043.67 | 3305 | 3281 | 899.4 |
| C | 13 | 3 | 2642345 | 2934.09 | 3305 | 3281 | 899.4 |
| D | 11 | 129 | 3764485 | 3862.71 | 3473 | 3325 | 973.7 |
| D | 2 | 62 | 2598063 | 2664.79 | 3473 | 3325 | 973.7 |
| D | 3 | 12 | 721935 | 738.01 | 3473 | 3325 | 973.7 |
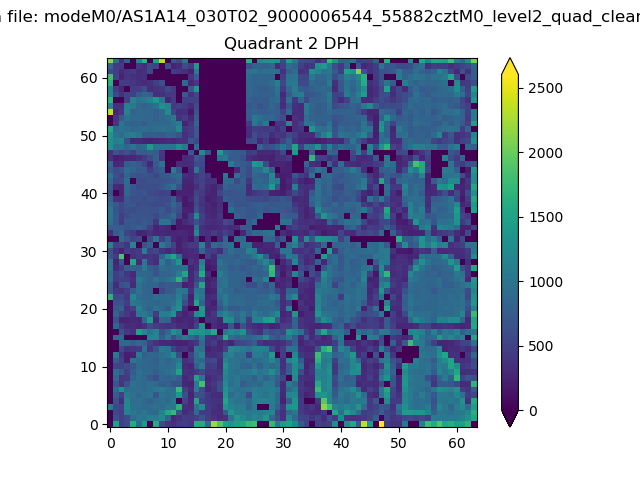
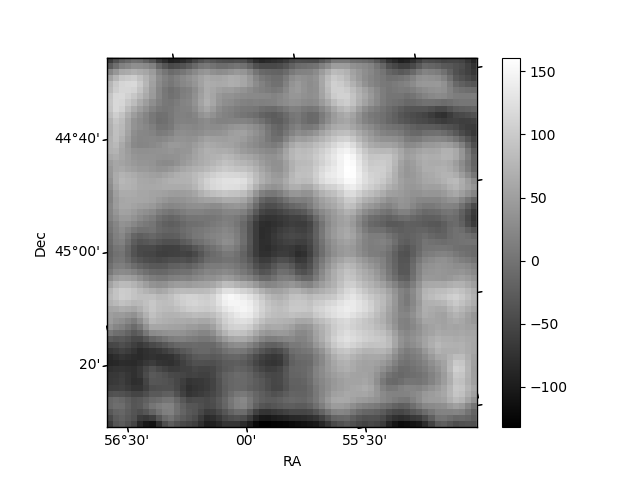
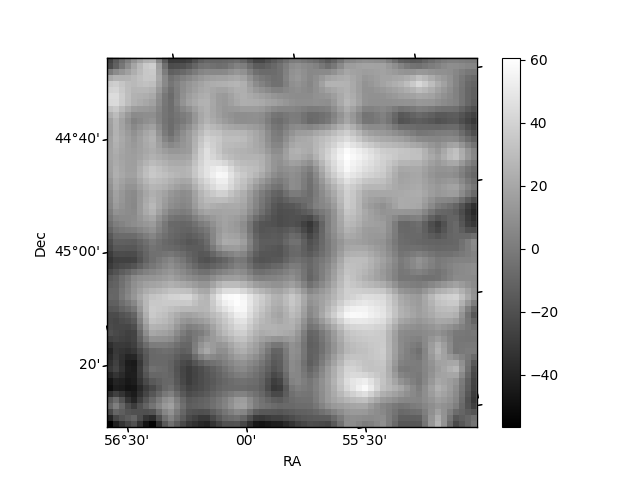
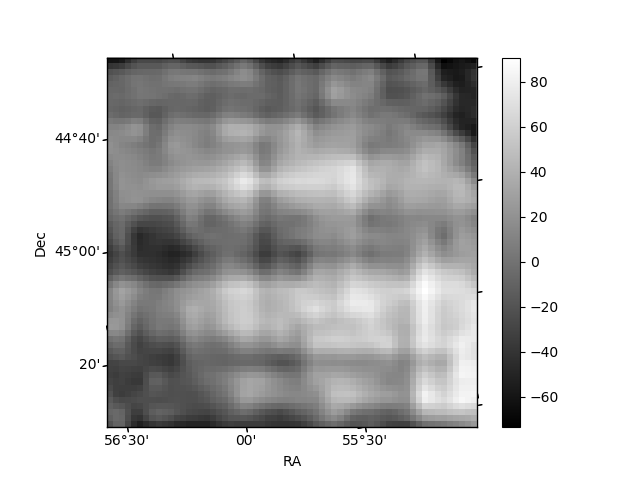
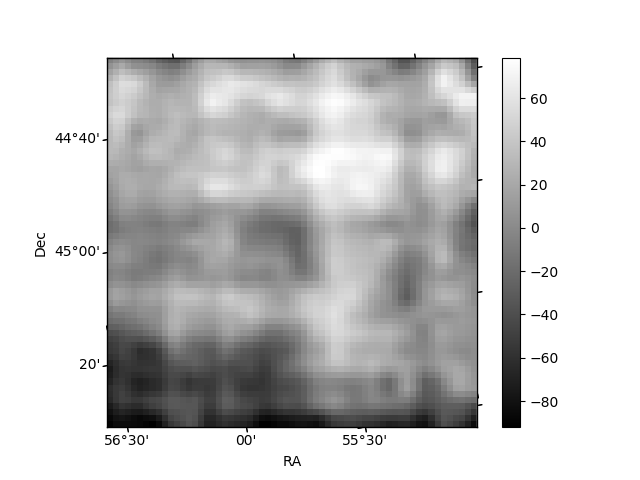
Histogram calculated using DETX and DETY for each event in the final _common_clean file
| Quadrant A | 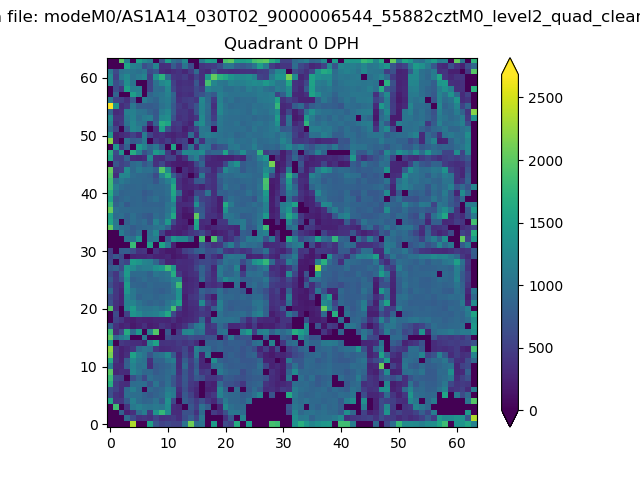 |
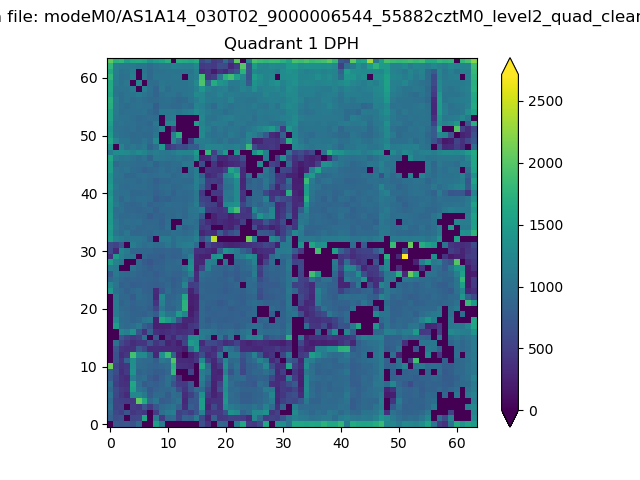 |
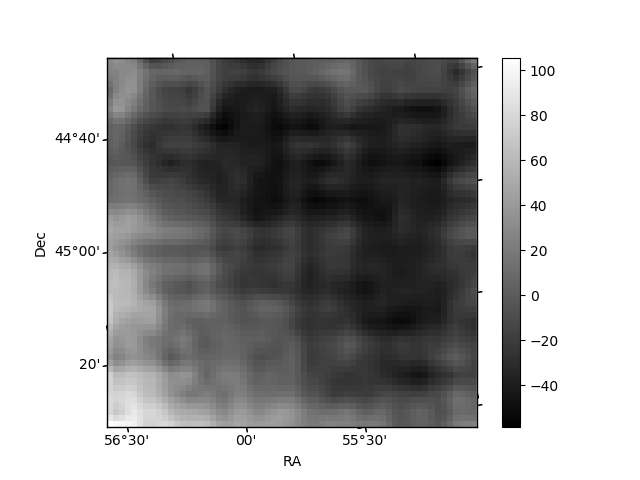
Quadrant B |
|---|---|---|---|
| Quadrant D | 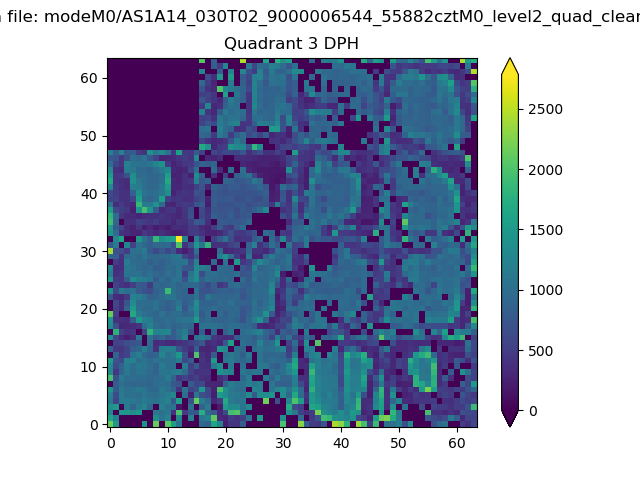 |
 |
Quadrant C |
| Plot type | Count rate plots | Images |
|---|---|---|
| Comparison with Poisson distribution Blue bars denote a histogram of data divided into 1 sec bins. Red curve is a Poisson curve with rate = median count rate of data. |
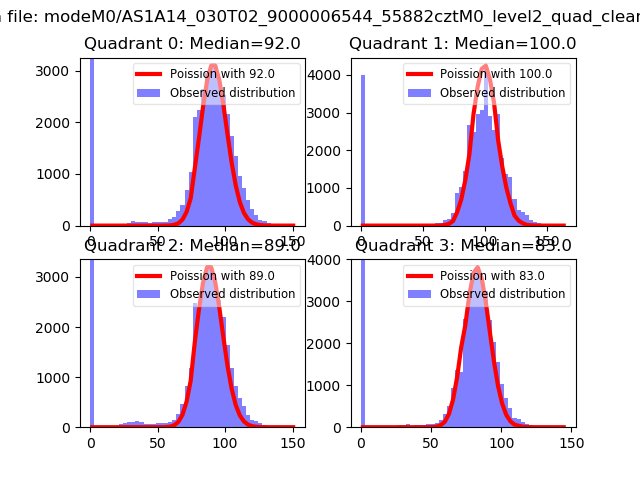 |
 |
| Quadrant-wise count rates Data is divided into 100 sec bins |
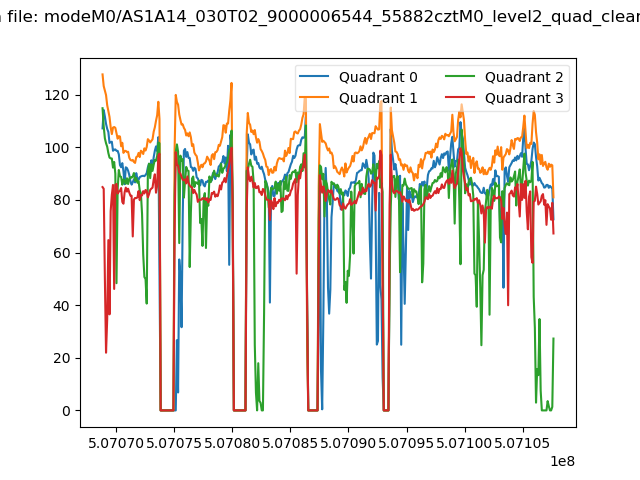 |
|
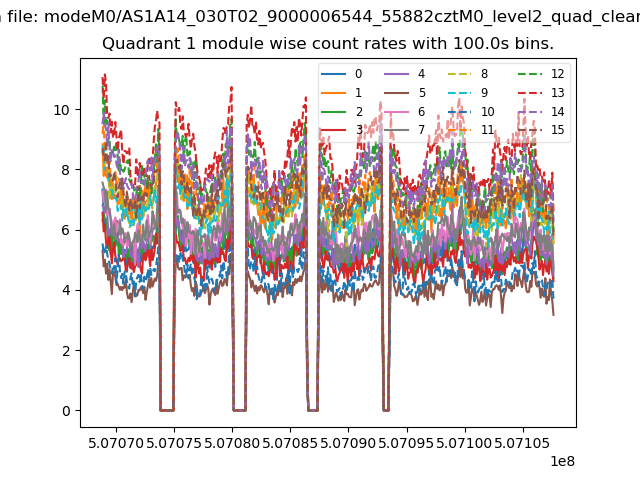
| Module-wise count rates for Quadrant A Data is divided into 100 sec bins |
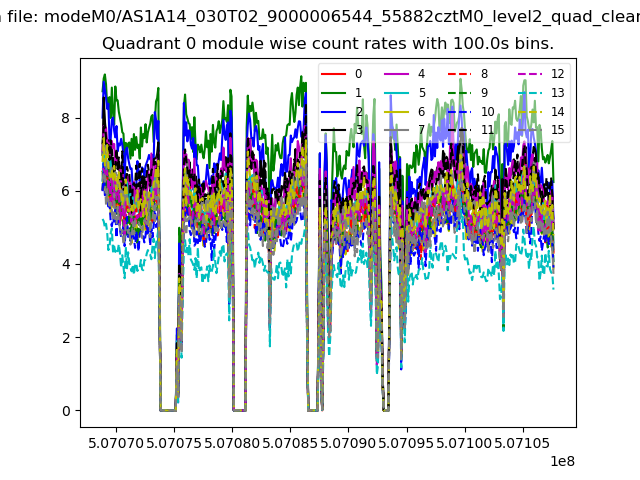 |
 |
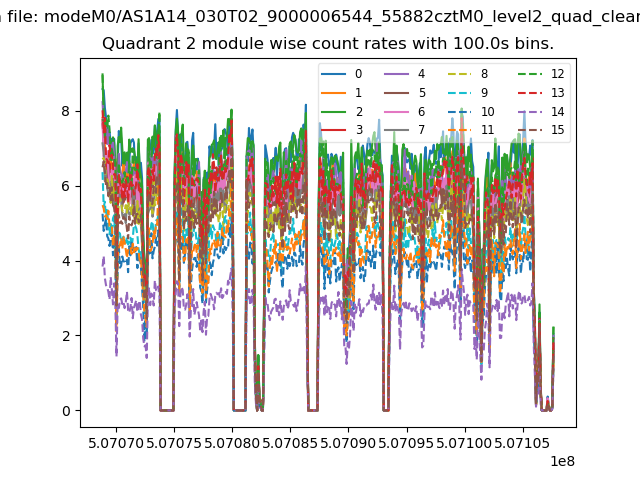
| Module-wise count rates for Quadrant B Data is divided into 100 sec bins |
 |
 |
| Module-wise count rates for Quadrant C Data is divided into 100 sec bins |
 |
 |
| Module-wise count rates for Quadrant D Data is divided into 100 sec bins |
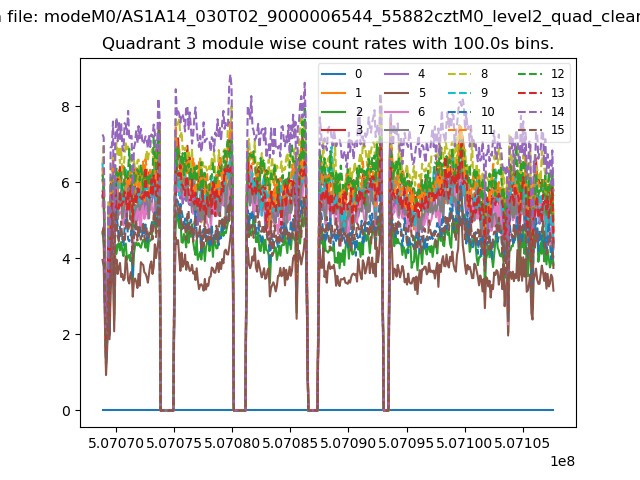 |
 |
| Parameter | Plot |
|---|---|
| CZT HV Monitor | 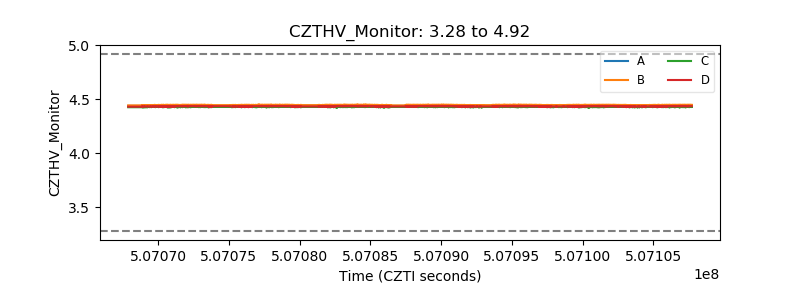 |
| D_VDD | 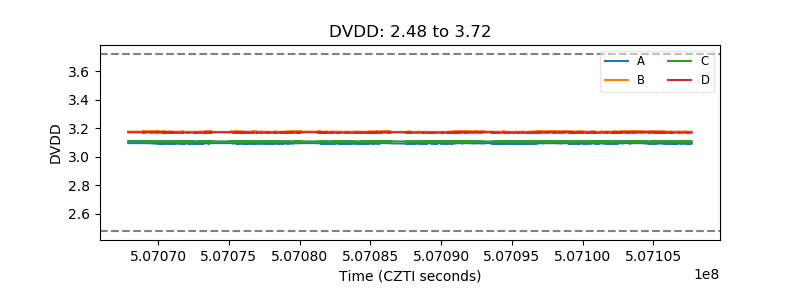 |
| Temperature 1 | 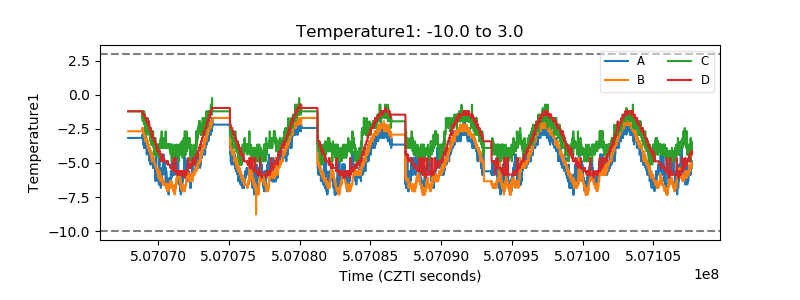 |
| Veto HV Monitor | 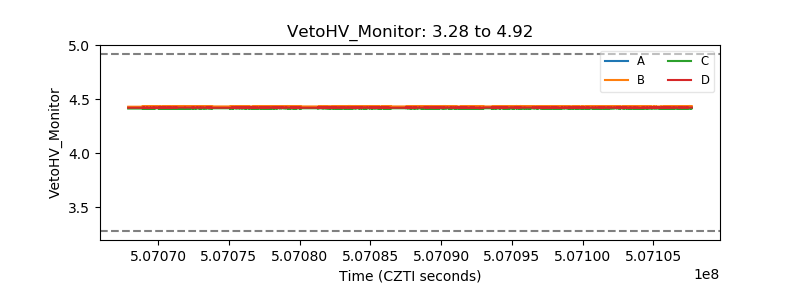 |
| Veto LLD | 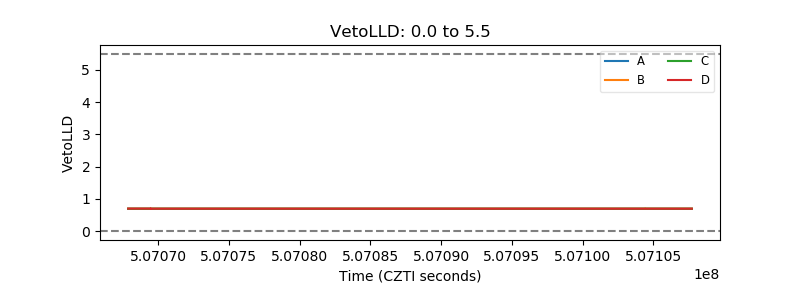 |
| Alpha Counter | 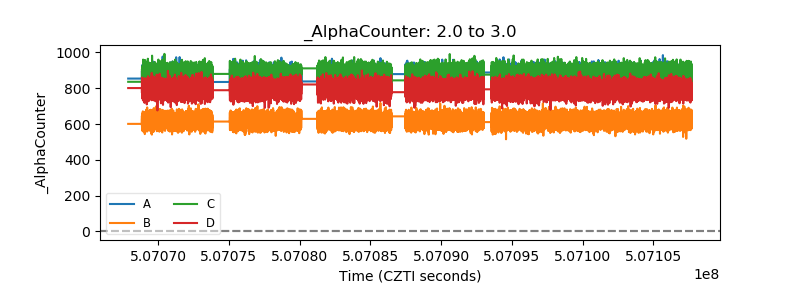 |
| _CPM_Rate | 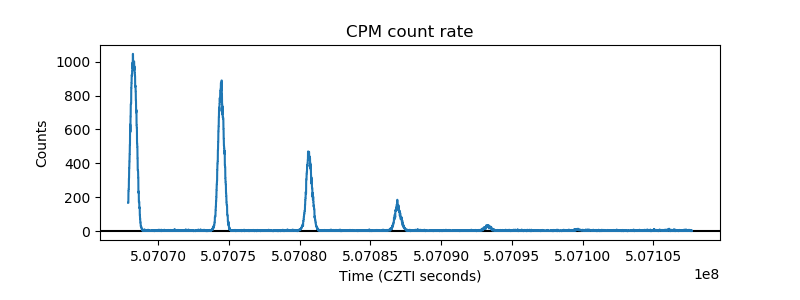 |
| CZT Counter | 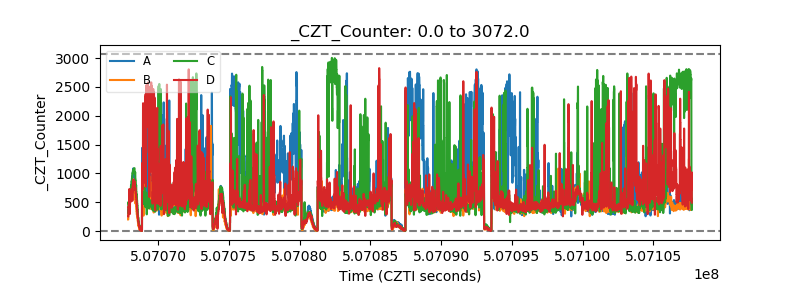 |
| +2.5 Volts monitor |  |
| +5 Volts monitor |  |
| _ROLL_ROT | 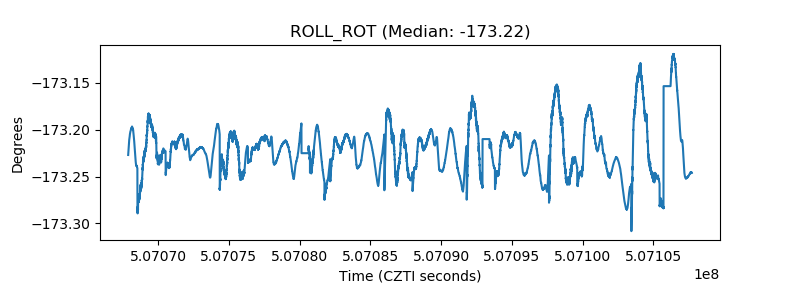 |
| _Roll_DEC | 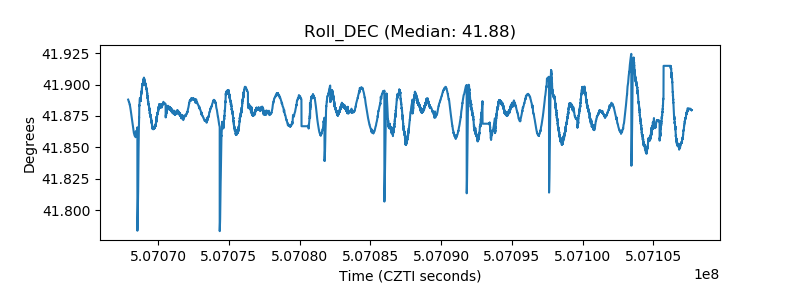 |
| _Roll_RA | 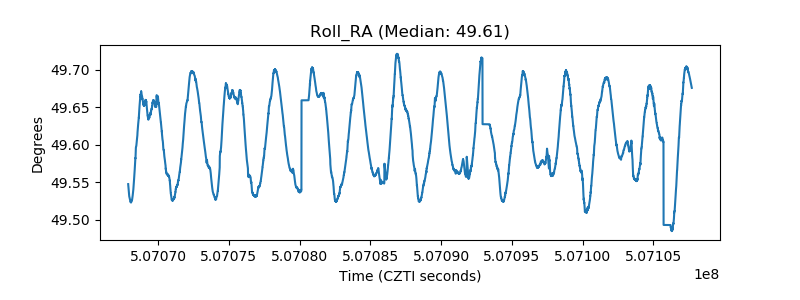 |
| Veto Counter | 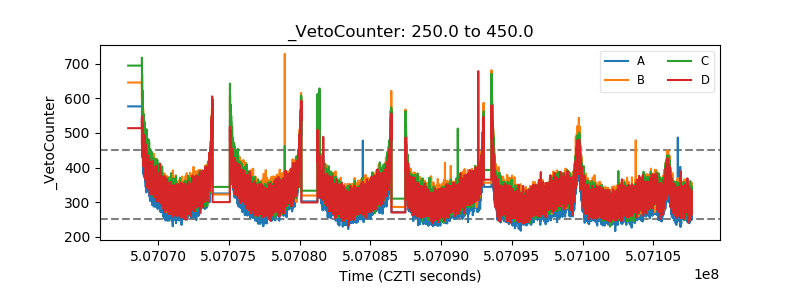 |