| Param | Original file | Final file |
|---|---|---|
| Filename | modeM0/AS1A14_030T02_9000006544_55885cztM0_level2.fits | modeM0/AS1A14_030T02_9000006544_55885cztM0_level2_quad_clean.evt |
| Size (bytes) | 650,312,640 | 106,986,240 |
| Size | 620.2 MB | 102.0 MB |
| Events in quadrant A | 9,436,787 | 600,098 |
| Events in quadrant B | 3,698,452 | 778,945 |
| Events in quadrant C | 5,679,684 | 656,054 |
| Events in quadrant D | 4,646,677 | 656,425 |
| Mode SS | |||
|---|---|---|---|
| Quadrant | BADHDUFLAG | Total packets | Discarded packets |
| A | 0 | 162 | 0 |
| B | 0 | 162 | 0 |
| C | 0 | 162 | 0 |
| D | 0 | 162 | 0 |
| Mode M9 | |||
|---|---|---|---|
| Quadrant | BADHDUFLAG | Total packets | Discarded packets |
| A | 0 | 15 | 0 |
| B | 0 | 15 | 0 |
| C | 0 | 15 | 0 |
| D | 0 | 15 | 0 |
| Mode M0 | |||
|---|---|---|---|
| Quadrant | BADHDUFLAG | Total packets | Discarded packets |
| A | 0 | 33512 | 2 |
| B | 0 | 16583 | 2 |
| C | 0 | 22695 | 2 |
| D | 0 | 19236 | 2 |
| Quadrant | Total seconds | Saturated seconds | Saturation percentage |
|---|---|---|---|
| A | 7875 | 1590 | 20.190476% |
| B | 7876 | 150 | 1.904520% |
| C | 7876 | 718 | 9.116303% |
| D | 7876 | 135 | 1.714068% |
Noise dominated data is calculated using 1-second bins in cleaned event files. If a bin has >2000 counts, and if more than 50% of those come from <1% of pixels, then it is considered to be noise-dominated and hence unusable.
| Quadrant | # 1 sec bins | Bins with >0 counts | Bins with >2000 counts | High rate bins dominated by noise | Noise dominated (total time) | Noise dominated (detector-on time) | Marked lightcurve |
|---|---|---|---|---|---|---|---|
| A | 9400 | 7877 | 1427 | 1427 | 15.18% | 18.12% | 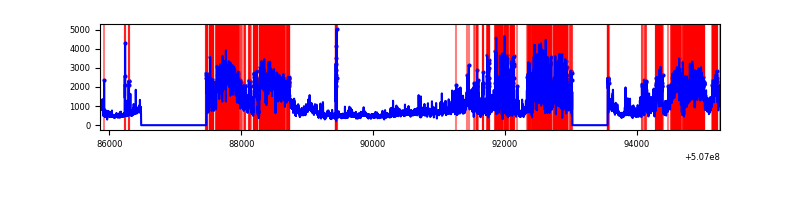 |
| B | 9401 | 7878 | 4 | 4 | 0.04% | 0.05% |  |
| C | 9401 | 7878 | 433 | 433 | 4.61% | 5.50% | 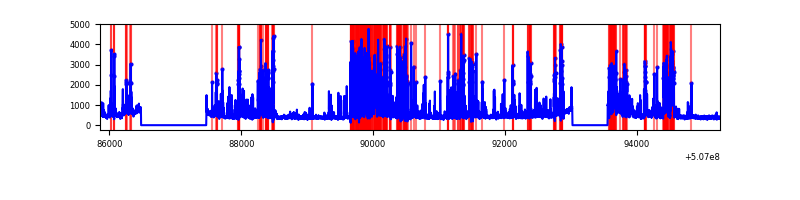 |
| D | 9401 | 7878 | 73 | 73 | 0.78% | 0.93% |  |
Top three noisy pixels from each quadrant. If the there are fewer than three noisy pixels in the level2.evt file, extra rows are filled as -1
| Pixel properties | Quadrant properties | ||||||
|---|---|---|---|---|---|---|---|
| Quadrant | DetID | PixID | Counts | Sigma | Mean | Median | Sigma |
| A | 12 | 115 | 4186142 | 21719.13 | 783 | 760 | 192.7 |
| A | 15 | 32 | 1316263 | 6826.52 | 783 | 760 | 192.7 |
| A | 7 | 64 | 375726 | 1945.8 | 783 | 760 | 192.7 |
| B | 0 | 197 | 101506 | 561.62 | 833 | 800 | 179.3 |
| B | 0 | 199 | 89120 | 492.54 | 833 | 800 | 179.3 |
| B | 7 | 0 | 86857 | 479.92 | 833 | 800 | 179.3 |
| C | 12 | 254 | 2241558 | 10439.79 | 789 | 783 | 214.6 |
| C | 12 | 252 | 150689 | 698.41 | 789 | 783 | 214.6 |
| C | 15 | 199 | 101635 | 469.87 | 789 | 783 | 214.6 |
| D | 2 | 62 | 609872 | 2667.84 | 808 | 770 | 228.3 |
| D | 3 | 12 | 142726 | 621.76 | 808 | 770 | 228.3 |
| D | 2 | 31 | 138584 | 603.62 | 808 | 770 | 228.3 |
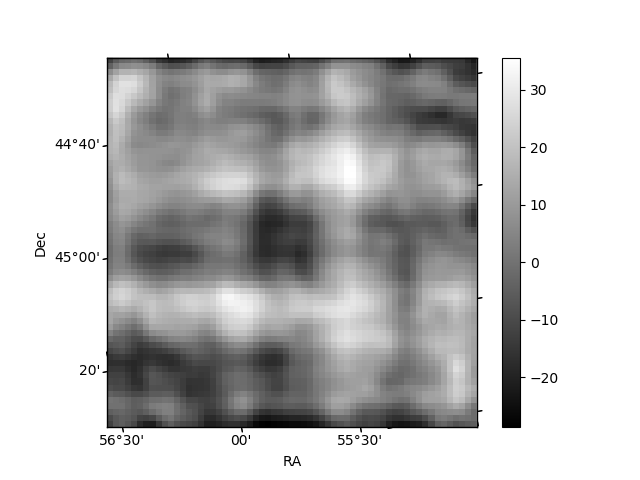
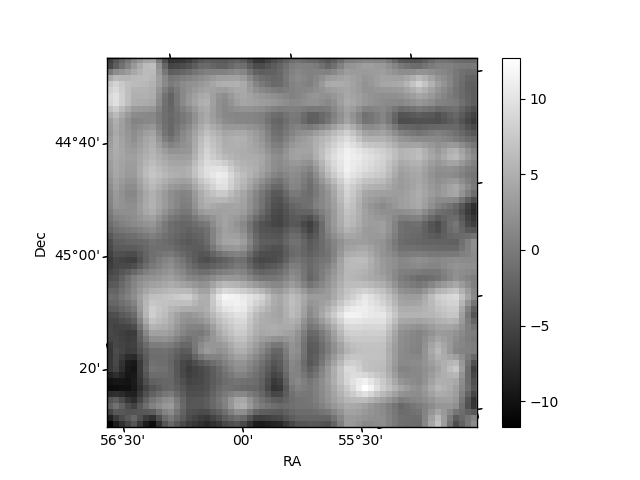
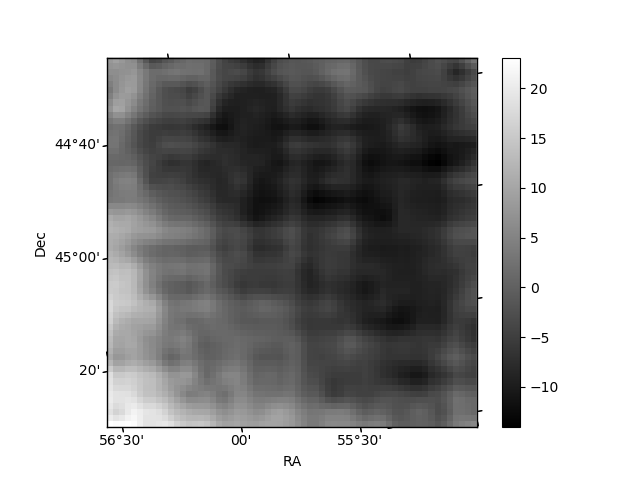
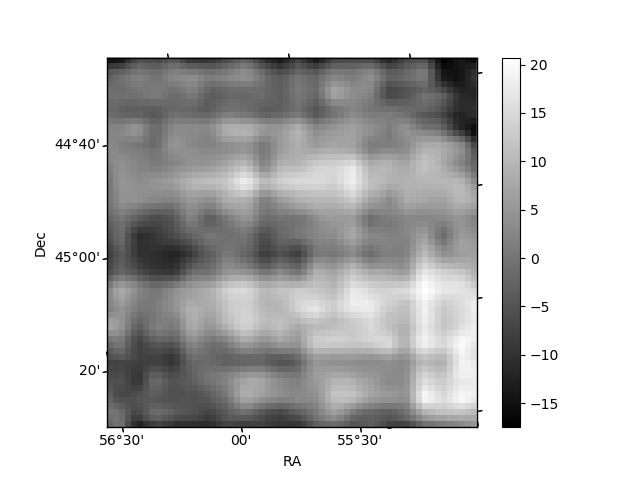
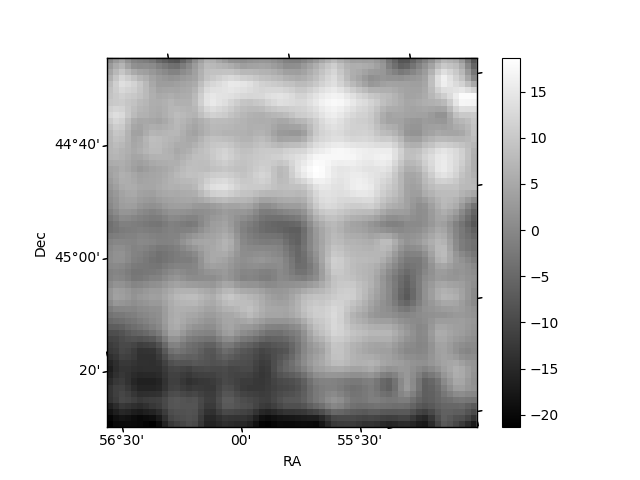
Histogram calculated using DETX and DETY for each event in the final _common_clean file
| Quadrant A | 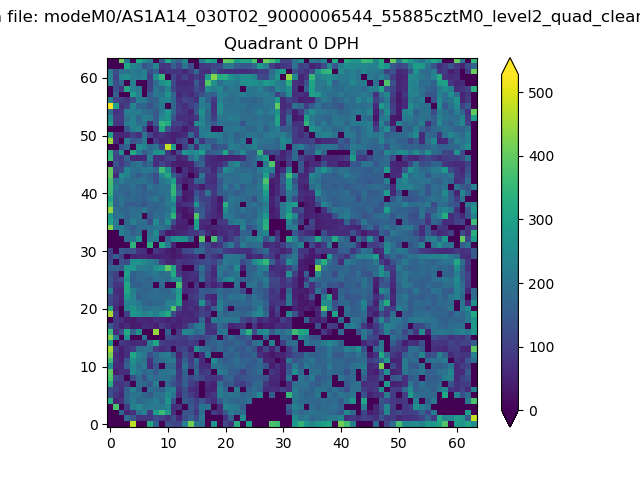 |
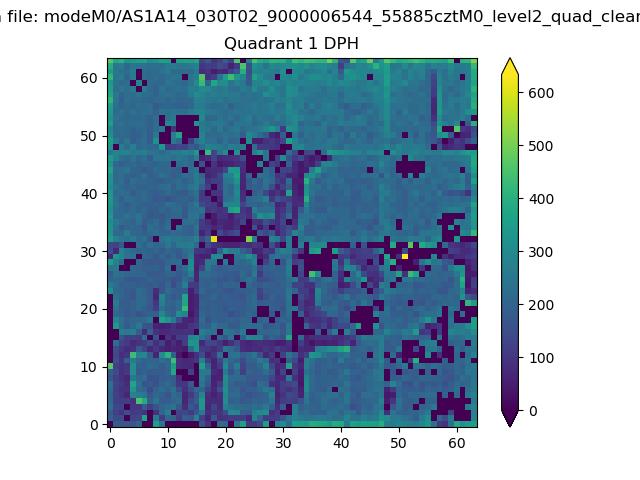 |
Quadrant B |
|---|---|---|---|
| Quadrant D | 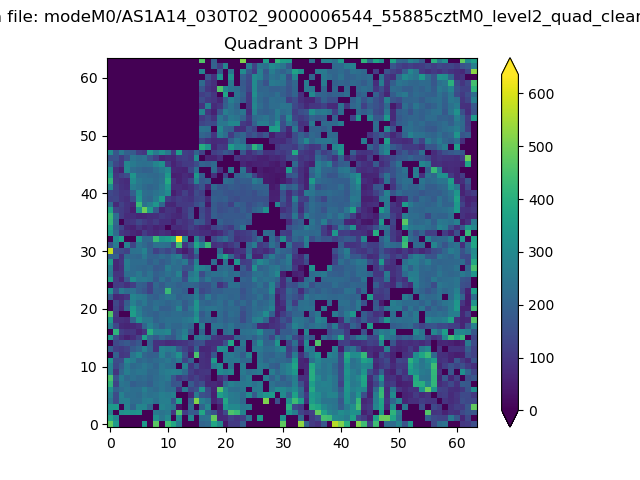 |
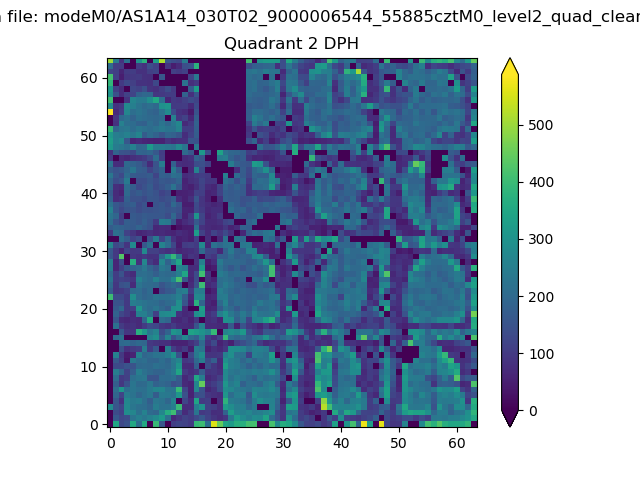 |
Quadrant C |
| Plot type | Count rate plots | Images |
|---|---|---|
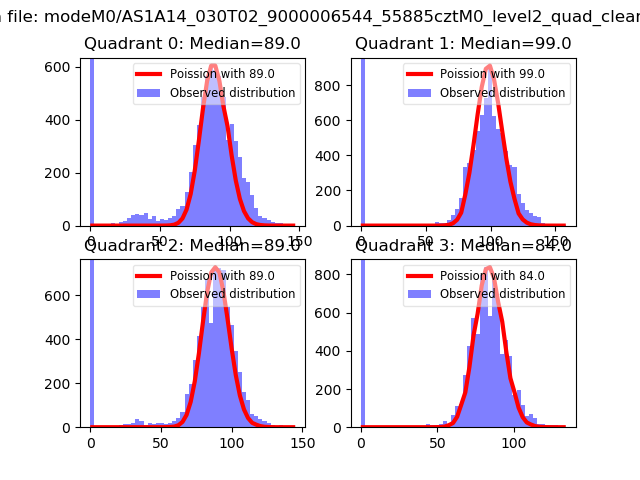
| Comparison with Poisson distribution Blue bars denote a histogram of data divided into 1 sec bins. Red curve is a Poisson curve with rate = median count rate of data. |
 |
 |
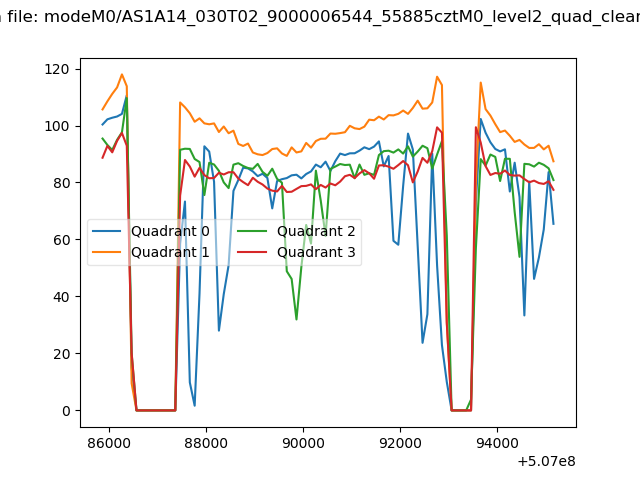
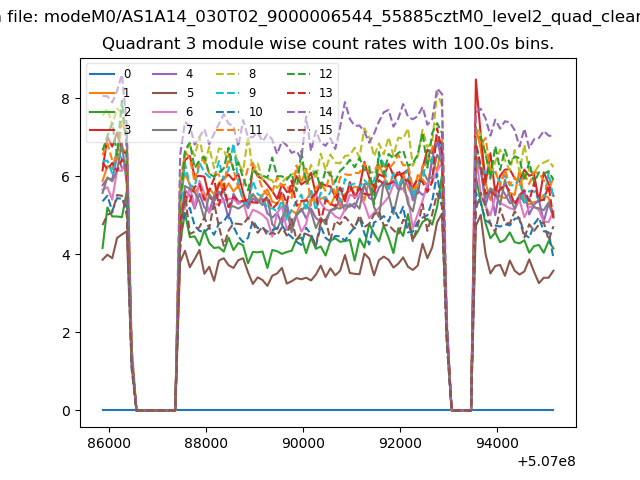
| Quadrant-wise count rates Data is divided into 100 sec bins |
 |
|
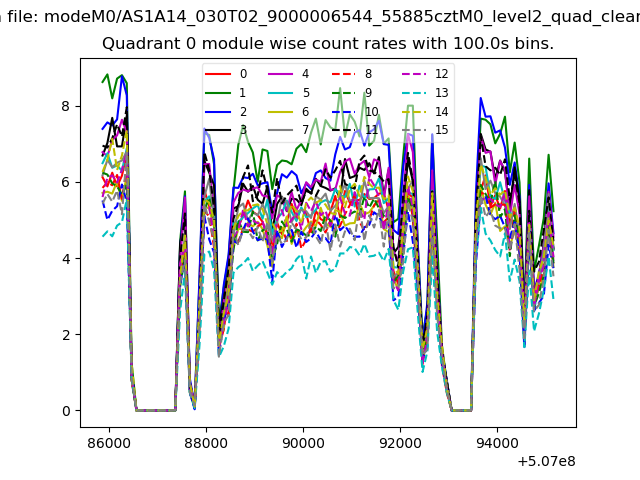
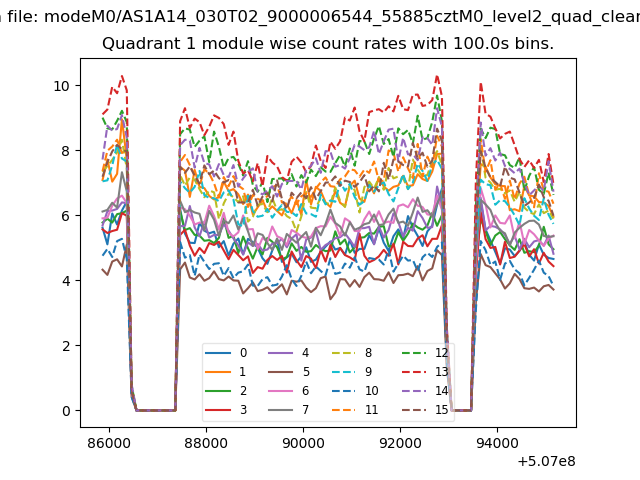
| Module-wise count rates for Quadrant A Data is divided into 100 sec bins |
 |
 |
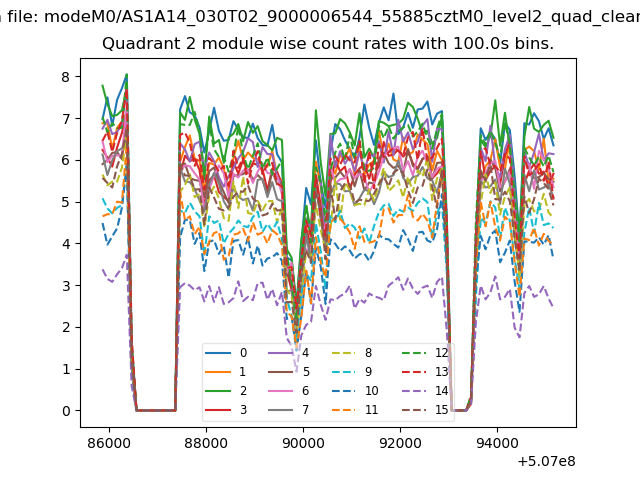
| Module-wise count rates for Quadrant B Data is divided into 100 sec bins |
 |
 |
| Module-wise count rates for Quadrant C Data is divided into 100 sec bins |
 |
 |
| Module-wise count rates for Quadrant D Data is divided into 100 sec bins |
 |
 |
| Parameter | Plot |
|---|---|
| CZT HV Monitor | 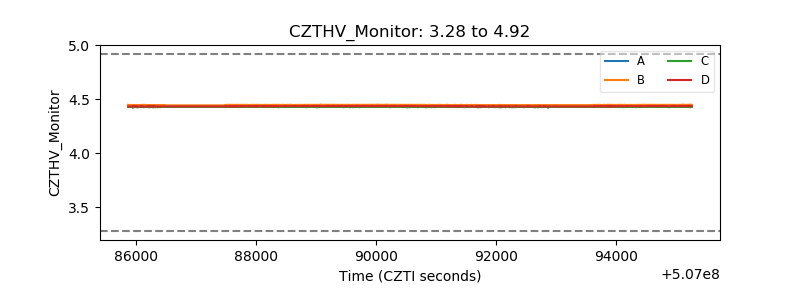 |
| D_VDD | 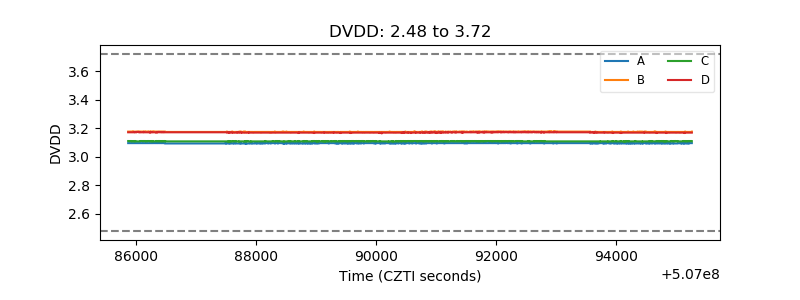 |
| Temperature 1 | 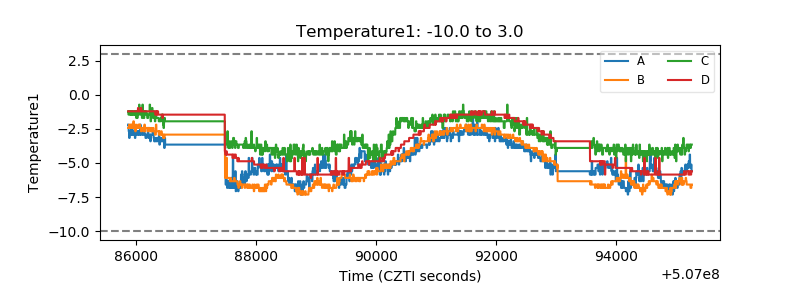 |
| Veto HV Monitor | 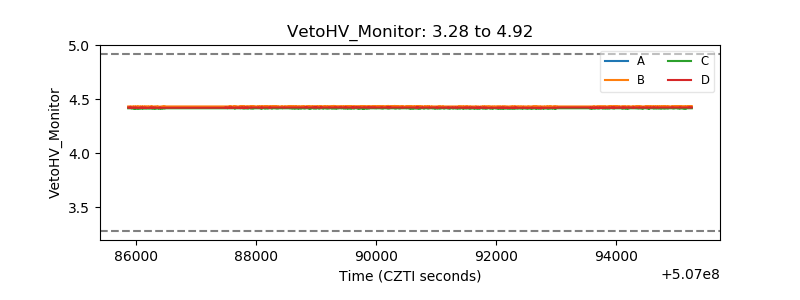 |
| Veto LLD | 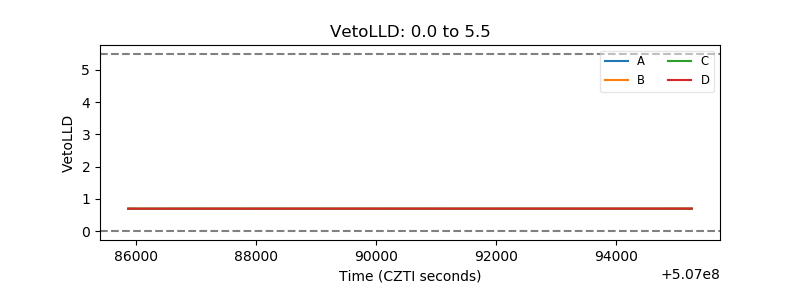 |
| Alpha Counter | 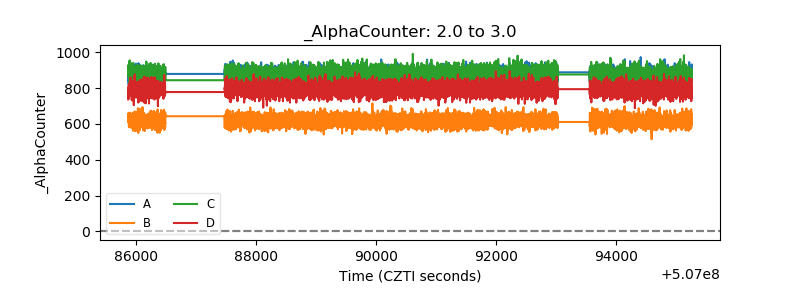 |
| _CPM_Rate | 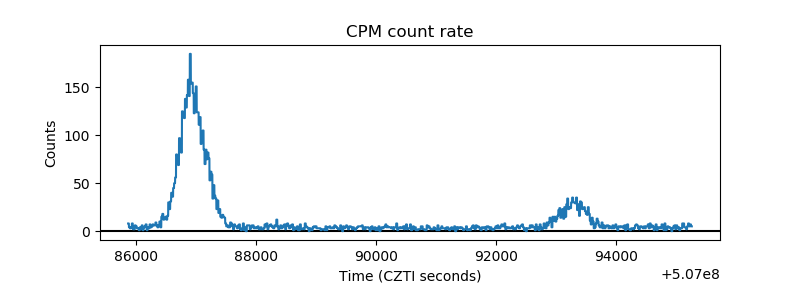 |
| CZT Counter | 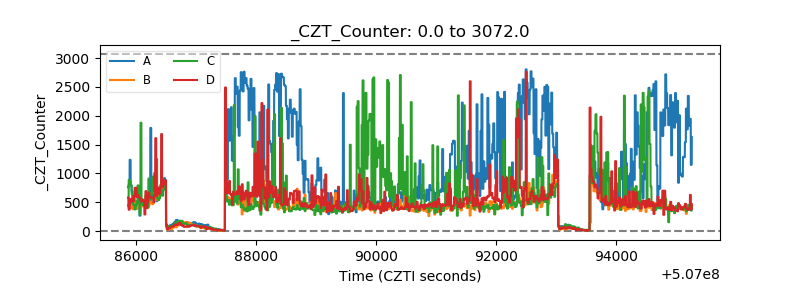 |
| +2.5 Volts monitor |  |
| +5 Volts monitor |  |
| _ROLL_ROT | 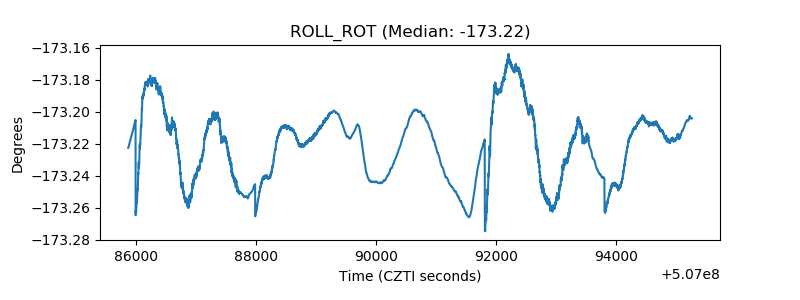 |
| _Roll_DEC | 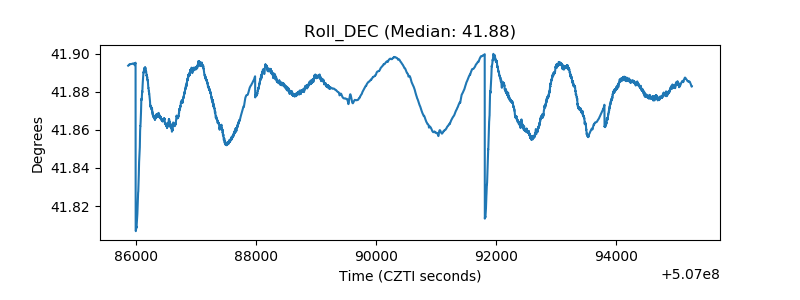 |
| _Roll_RA | 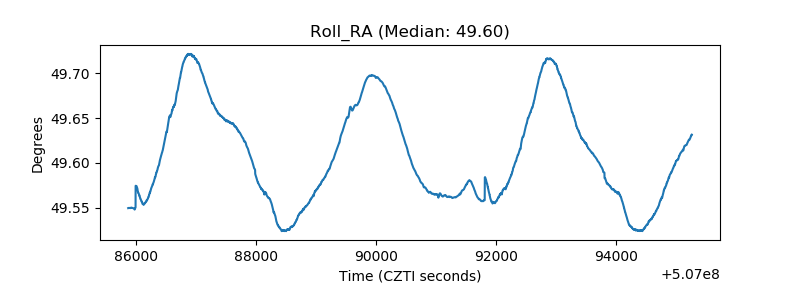 |
| Veto Counter | 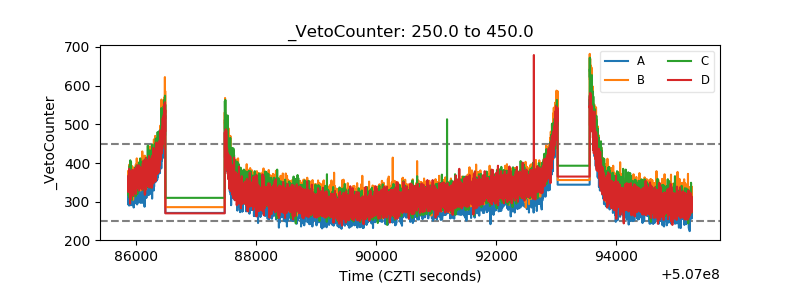 |