| Param | Original file | Final file |
|---|---|---|
| Filename | modeM0/AS1A14_030T02_9000006544_55886cztM0_level2.fits | modeM0/AS1A14_030T02_9000006544_55886cztM0_level2_quad_clean.evt |
| Size (bytes) | 505,111,680 | 106,790,400 |
| Size | 481.7 MB | 101.8 MB |
| Events in quadrant A | 5,545,409 | 674,516 |
| Events in quadrant B | 3,465,164 | 756,304 |
| Events in quadrant C | 5,135,941 | 630,551 |
| Events in quadrant D | 3,952,760 | 636,783 |
| Mode SS | |||
|---|---|---|---|
| Quadrant | BADHDUFLAG | Total packets | Discarded packets |
| A | 0 | 154 | 0 |
| B | 0 | 154 | 0 |
| C | 0 | 154 | 0 |
| D | 0 | 154 | 0 |
| Mode M0 | |||
|---|---|---|---|
| Quadrant | BADHDUFLAG | Total packets | Discarded packets |
| A | 0 | 21998 | 0 |
| B | 0 | 16122 | 0 |
| C | 0 | 21167 | 1 |
| D | 0 | 17111 | 0 |
| Quadrant | Total seconds | Saturated seconds | Saturation percentage |
|---|---|---|---|
| A | 7698 | 376 | 4.884386% |
| B | 7698 | 50 | 0.649519% |
| C | 7698 | 663 | 8.612627% |
| D | 7698 | 33 | 0.428683% |
Noise dominated data is calculated using 1-second bins in cleaned event files. If a bin has >2000 counts, and if more than 50% of those come from <1% of pixels, then it is considered to be noise-dominated and hence unusable.
| Quadrant | # 1 sec bins | Bins with >0 counts | Bins with >2000 counts | High rate bins dominated by noise | Noise dominated (total time) | Noise dominated (detector-on time) | Marked lightcurve |
|---|---|---|---|---|---|---|---|
| A | 7698 | 7698 | 416 | 416 | 5.40% | 5.40% | 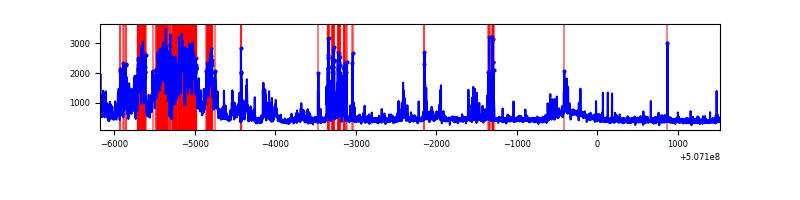 |
| B | 7698 | 7698 | 2 | 2 | 0.03% | 0.03% | 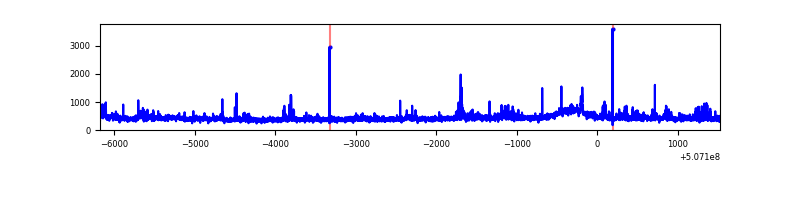 |
| C | 7698 | 7698 | 490 | 490 | 6.37% | 6.37% | 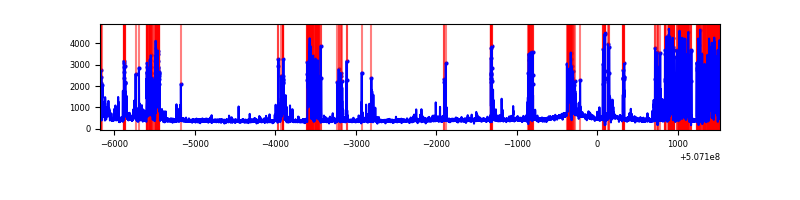 |
| D | 7698 | 7698 | 32 | 32 | 0.42% | 0.42% | 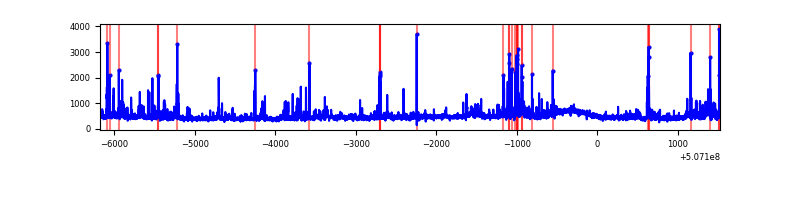 |
Top three noisy pixels from each quadrant. If the there are fewer than three noisy pixels in the level2.evt file, extra rows are filled as -1
| Pixel properties | Quadrant properties | ||||||
|---|---|---|---|---|---|---|---|
| Quadrant | DetID | PixID | Counts | Sigma | Mean | Median | Sigma |
| A | 12 | 115 | 1767391 | 9144.2 | 787 | 766 | 193.2 |
| A | 3 | 14 | 315713 | 1630.19 | 787 | 766 | 193.2 |
| A | 15 | 32 | 154747 | 797.02 | 787 | 766 | 193.2 |
| B | 0 | 199 | 148065 | 862.47 | 792 | 763 | 170.8 |
| B | 5 | 185 | 41650 | 239.4 | 792 | 763 | 170.8 |
| B | 2 | 249 | 41585 | 239.02 | 792 | 763 | 170.8 |
| C | 15 | 199 | 1522357 | 7497.02 | 748 | 741 | 203.0 |
| C | 12 | 254 | 406378 | 1998.58 | 748 | 741 | 203.0 |
| C | 6 | 223 | 95603 | 467.39 | 748 | 741 | 203.0 |
| D | 2 | 62 | 303517 | 1384.78 | 772 | 736 | 218.6 |
| D | 3 | 12 | 128748 | 585.47 | 772 | 736 | 218.6 |
| D | 2 | 31 | 112684 | 512.0 | 772 | 736 | 218.6 |
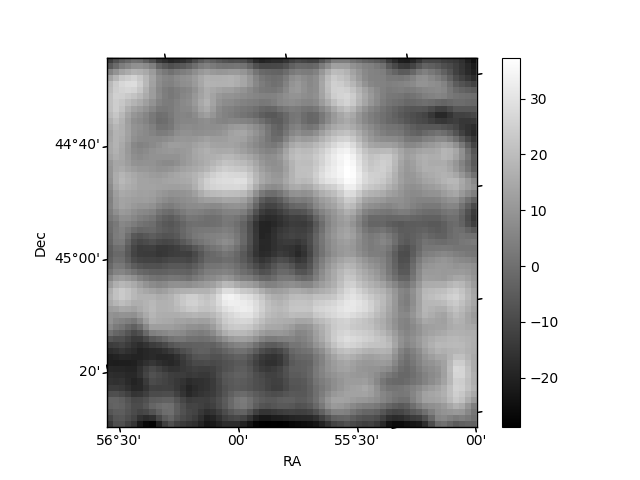
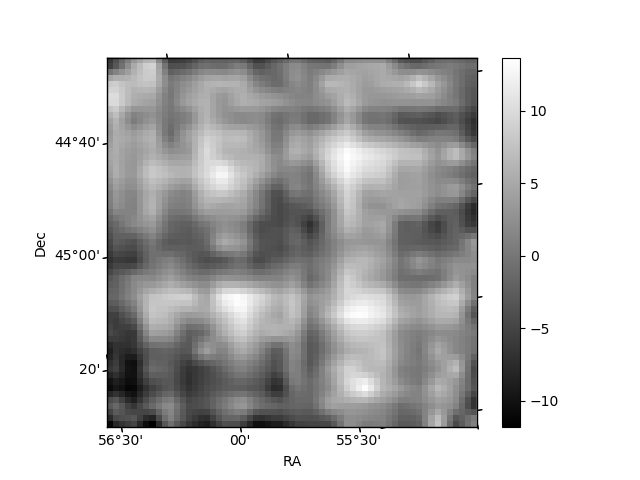
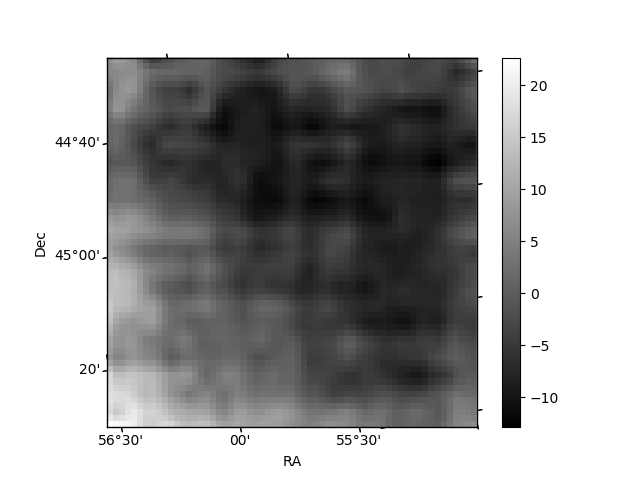
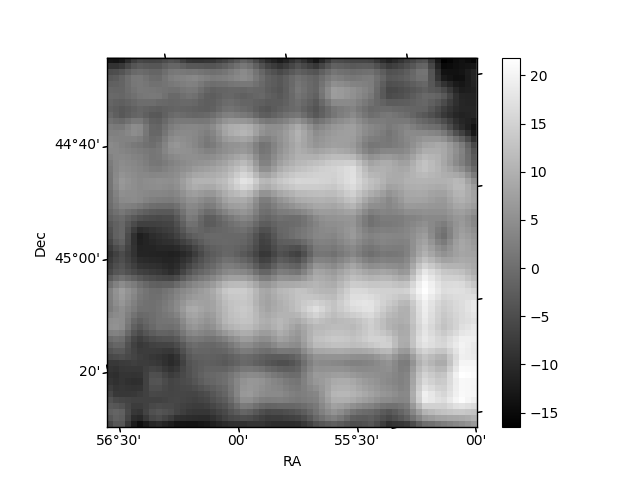
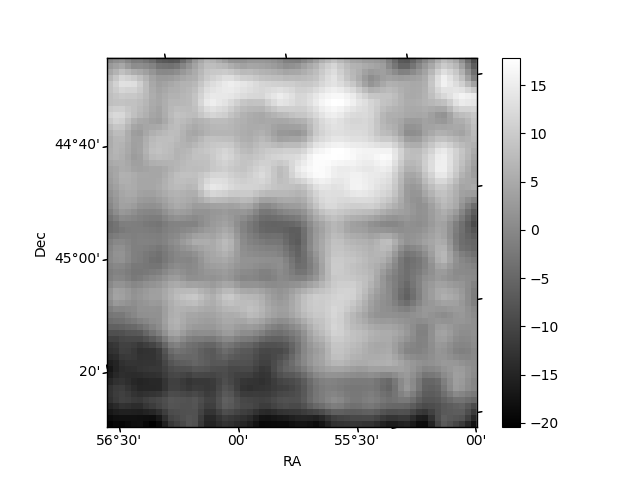
Histogram calculated using DETX and DETY for each event in the final _common_clean file
| Quadrant A | 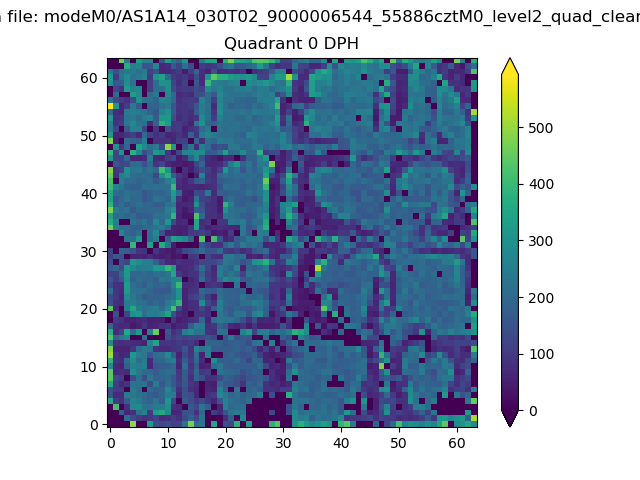 |
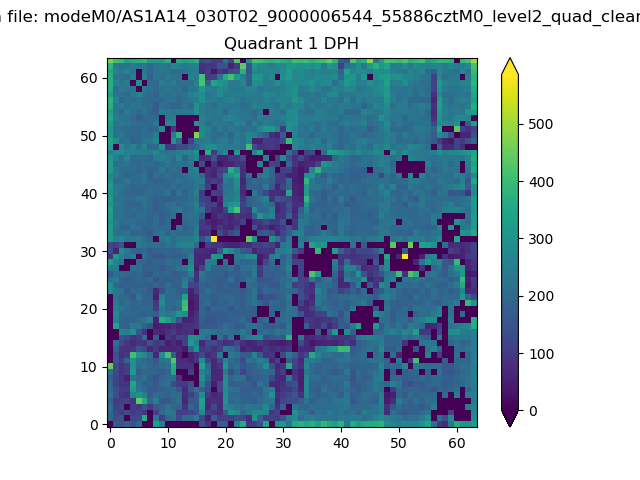 |
Quadrant B |
|---|---|---|---|
| Quadrant D | 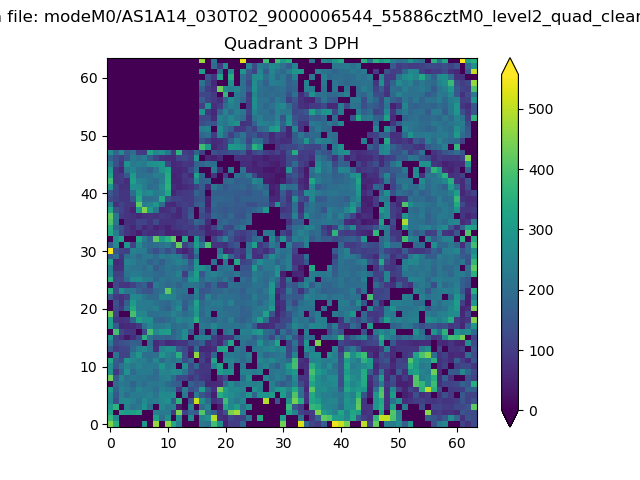 |
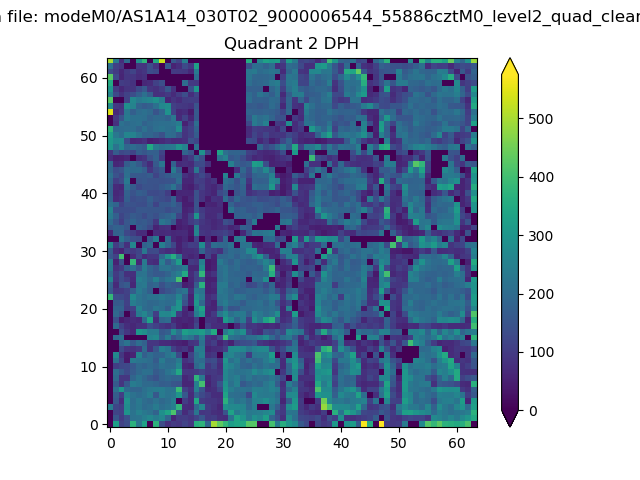 |
Quadrant C |
| Plot type | Count rate plots | Images |
|---|---|---|
| Comparison with Poisson distribution Blue bars denote a histogram of data divided into 1 sec bins. Red curve is a Poisson curve with rate = median count rate of data. |
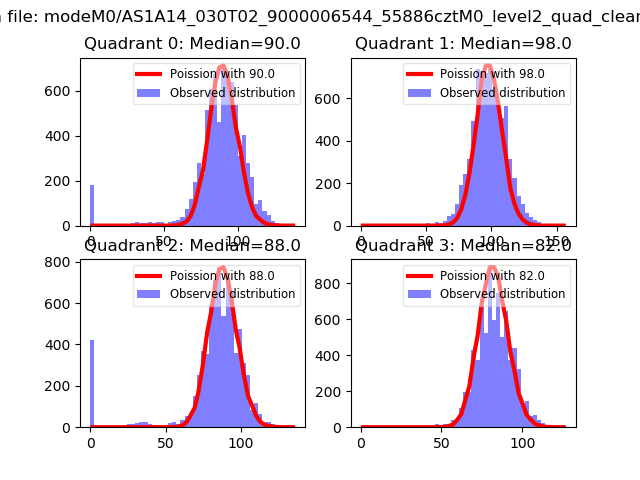 |
 |
| Quadrant-wise count rates Data is divided into 100 sec bins |
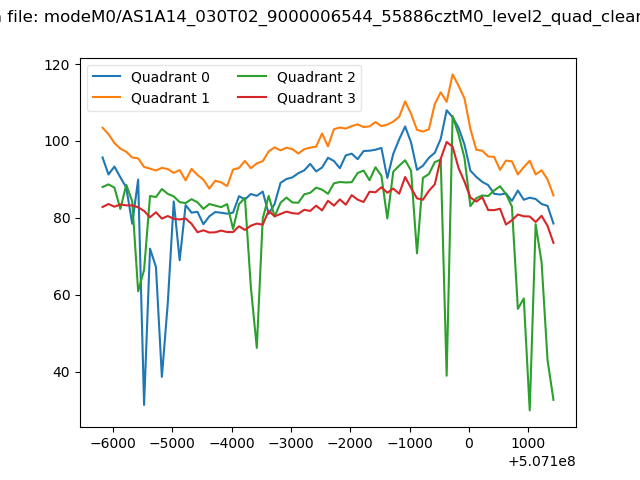 |
|
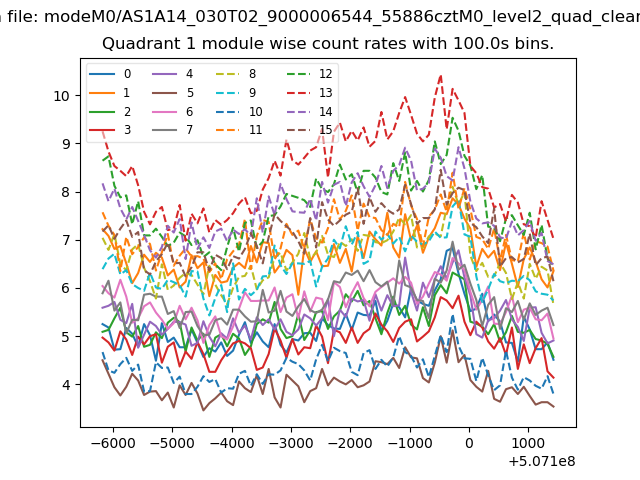
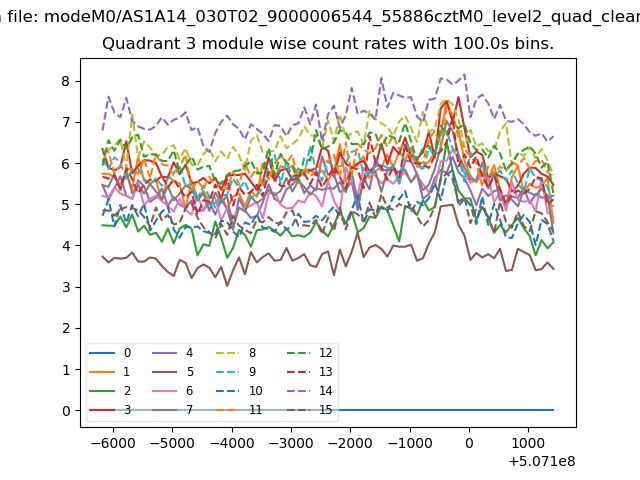
| Module-wise count rates for Quadrant A Data is divided into 100 sec bins |
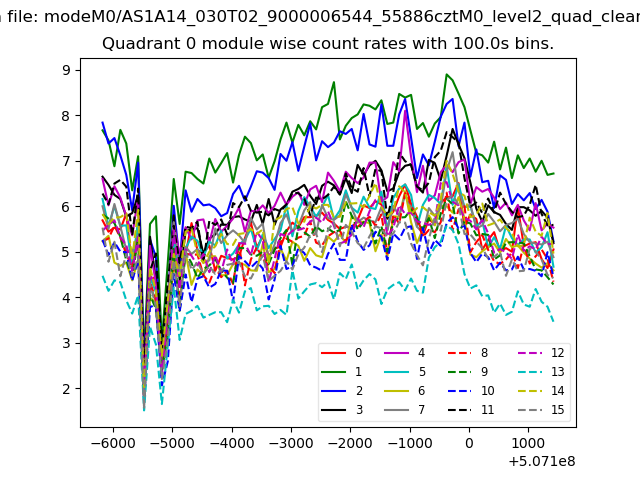 |
 |
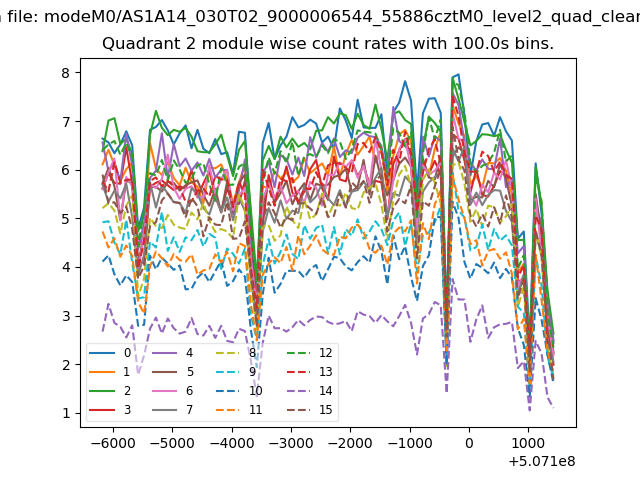
| Module-wise count rates for Quadrant B Data is divided into 100 sec bins |
 |
 |
| Module-wise count rates for Quadrant C Data is divided into 100 sec bins |
 |
 |
| Module-wise count rates for Quadrant D Data is divided into 100 sec bins |
 |
 |
| Parameter | Plot |
|---|---|
| CZT HV Monitor | 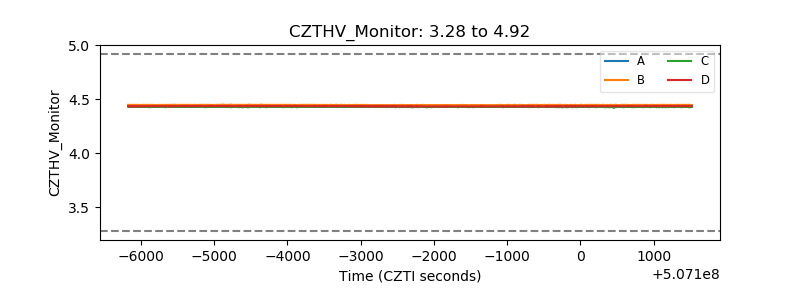 |
| D_VDD | 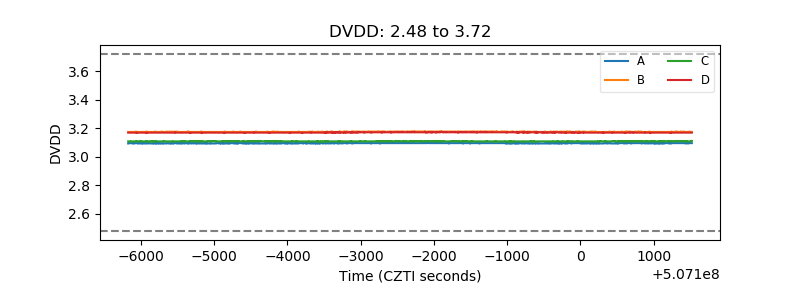 |
| Temperature 1 | 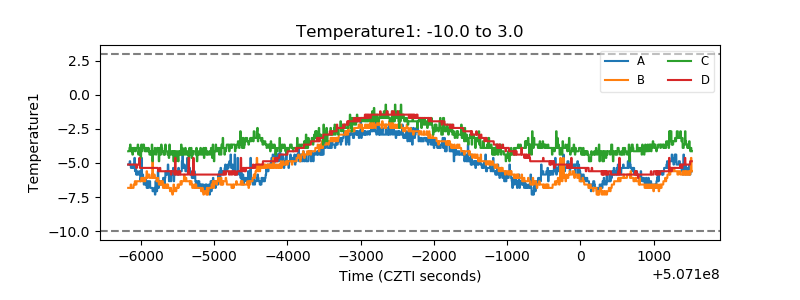 |
| Veto HV Monitor | 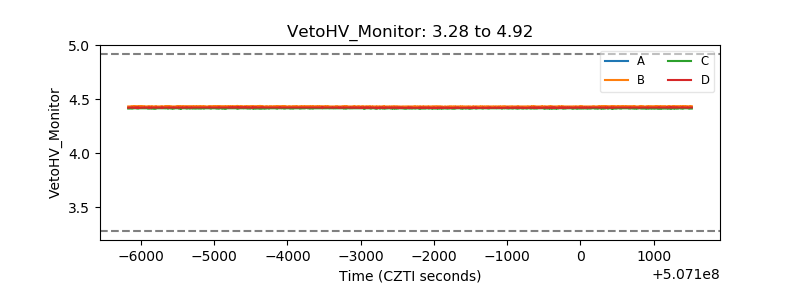 |
| Veto LLD | 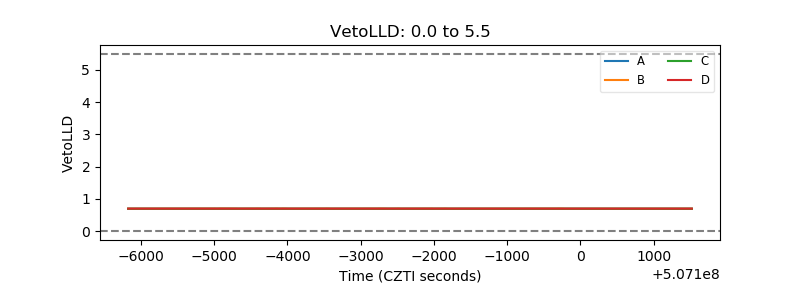 |
| Alpha Counter | 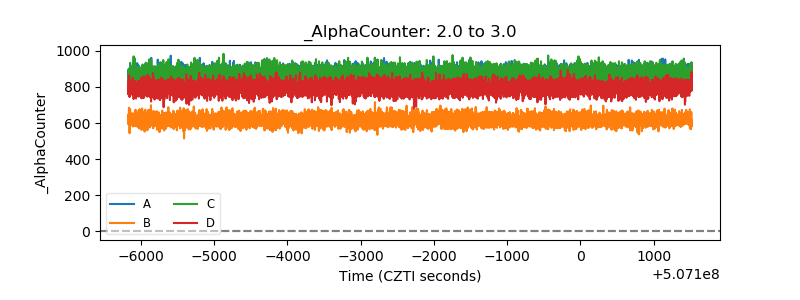 |
| _CPM_Rate | 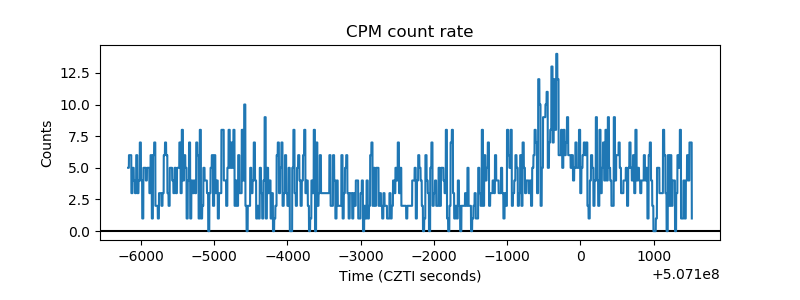 |
| CZT Counter | 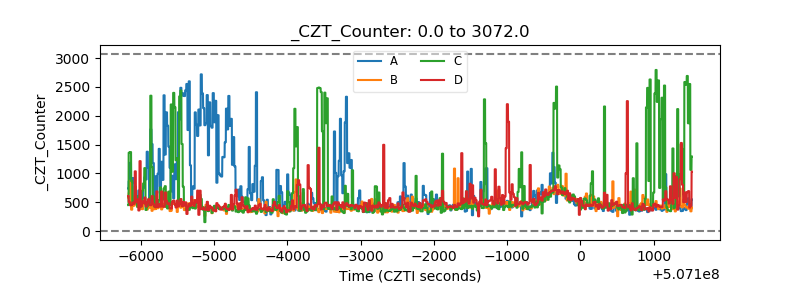 |
| +2.5 Volts monitor |  |
| +5 Volts monitor |  |
| _ROLL_ROT | 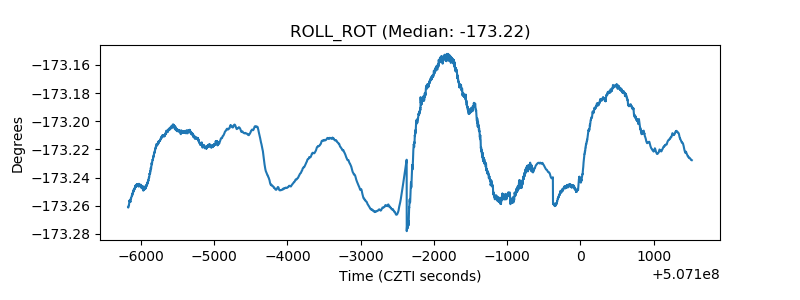 |
| _Roll_DEC | 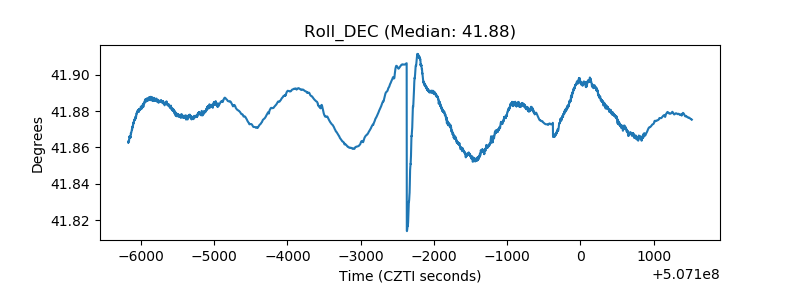 |
| _Roll_RA | 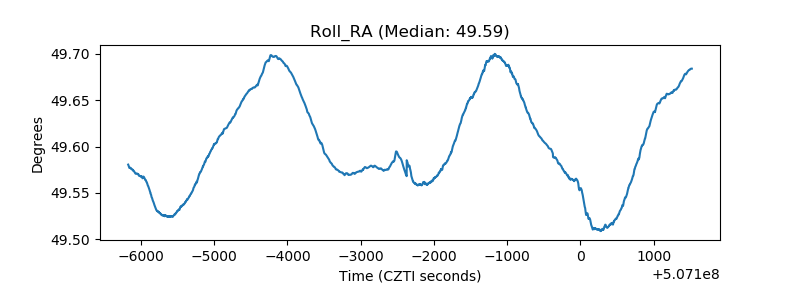 |
| Veto Counter | 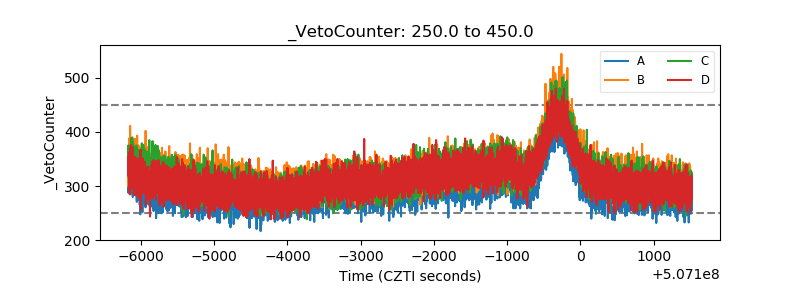 |