| Param | Original file | Final file |
|---|---|---|
| Filename | modeM0/AS1A14_030T02_9000006544_55887cztM0_level2.fits | modeM0/AS1A14_030T02_9000006544_55887cztM0_level2_quad_clean.evt |
| Size (bytes) | 637,968,960 | 100,667,520 |
| Size | 608.4 MB | 96.0 MB |
| Events in quadrant A | 4,409,580 | 679,922 |
| Events in quadrant B | 3,478,519 | 748,808 |
| Events in quadrant C | 8,848,825 | 482,374 |
| Events in quadrant D | 6,282,547 | 602,716 |
| Mode SS | |||
|---|---|---|---|
| Quadrant | BADHDUFLAG | Total packets | Discarded packets |
| A | 0 | 154 | 0 |
| B | 0 | 154 | 0 |
| C | 0 | 154 | 0 |
| D | 0 | 154 | 0 |
| Mode M0 | |||
|---|---|---|---|
| Quadrant | BADHDUFLAG | Total packets | Discarded packets |
| A | 0 | 18601 | 0 |
| B | 0 | 16100 | 0 |
| C | 0 | 31848 | 0 |
| D | 0 | 23997 | 0 |
| Quadrant | Total seconds | Saturated seconds | Saturation percentage |
|---|---|---|---|
| A | 7678 | 174 | 2.266215% |
| B | 7679 | 27 | 0.351608% |
| C | 7678 | 2283 | 29.734306% |
| D | 7678 | 486 | 6.329773% |
Noise dominated data is calculated using 1-second bins in cleaned event files. If a bin has >2000 counts, and if more than 50% of those come from <1% of pixels, then it is considered to be noise-dominated and hence unusable.
| Quadrant | # 1 sec bins | Bins with >0 counts | Bins with >2000 counts | High rate bins dominated by noise | Noise dominated (total time) | Noise dominated (detector-on time) | Marked lightcurve |
|---|---|---|---|---|---|---|---|
| A | 7678 | 7678 | 151 | 151 | 1.97% | 1.97% | 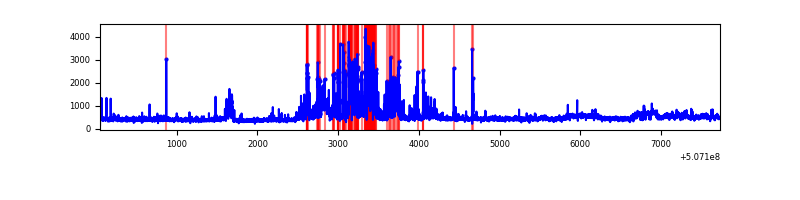 |
| B | 7679 | 7679 | 12 | 12 | 0.16% | 0.16% | 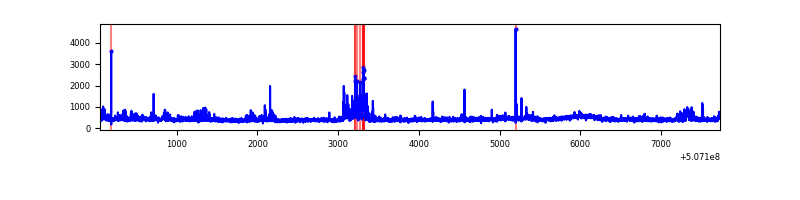 |
| C | 7678 | 7678 | 1955 | 1955 | 25.46% | 25.46% | 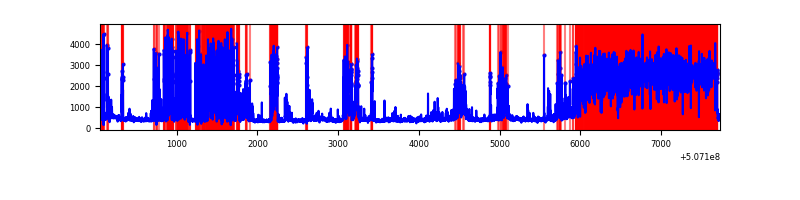 |
| D | 7678 | 7678 | 409 | 409 | 5.33% | 5.33% | 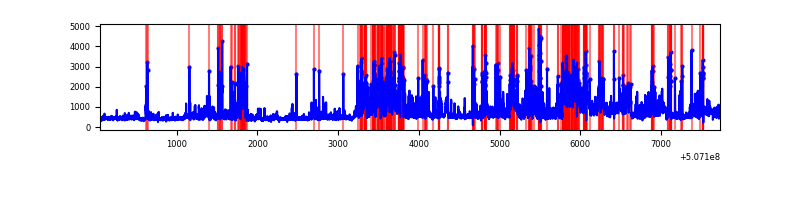 |
Top three noisy pixels from each quadrant. If the there are fewer than three noisy pixels in the level2.evt file, extra rows are filled as -1
| Pixel properties | Quadrant properties | ||||||
|---|---|---|---|---|---|---|---|
| Quadrant | DetID | PixID | Counts | Sigma | Mean | Median | Sigma |
| A | 3 | 14 | 602124 | 3140.23 | 774 | 756 | 191.5 |
| A | 15 | 32 | 325834 | 1697.49 | 774 | 756 | 191.5 |
| A | 12 | 115 | 250164 | 1302.36 | 774 | 756 | 191.5 |
| B | 5 | 185 | 157336 | 936.41 | 776 | 747 | 167.2 |
| B | 0 | 199 | 151137 | 899.34 | 776 | 747 | 167.2 |
| B | 2 | 249 | 42722 | 251.01 | 776 | 747 | 167.2 |
| C | 15 | 199 | 6055900 | 34157.69 | 646 | 640 | 177.3 |
| C | 12 | 252 | 80064 | 448.03 | 646 | 640 | 177.3 |
| C | 14 | 80 | 56101 | 312.86 | 646 | 640 | 177.3 |
| D | 11 | 129 | 1438251 | 6946.74 | 738 | 705 | 206.9 |
| D | 2 | 62 | 1017035 | 4911.27 | 738 | 705 | 206.9 |
| D | 8 | 160 | 326039 | 1572.13 | 738 | 705 | 206.9 |
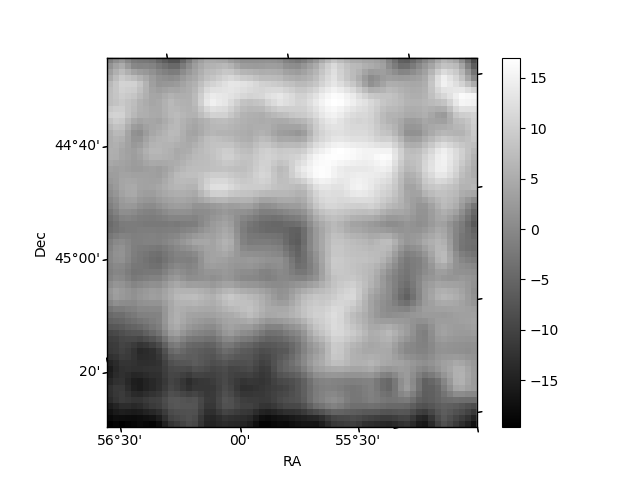
Histogram calculated using DETX and DETY for each event in the final _common_clean file
| Quadrant A | 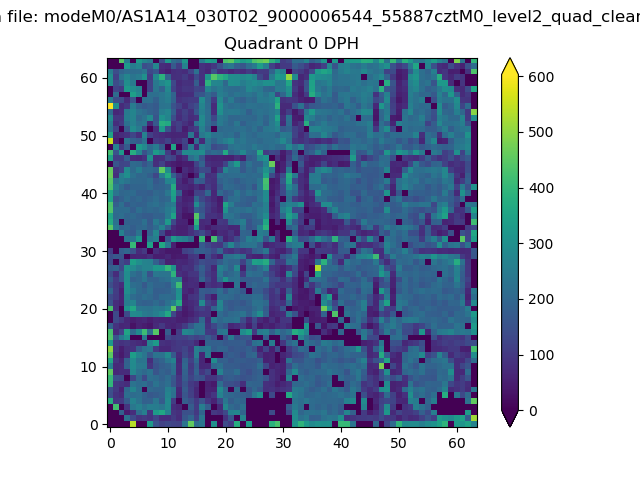 |
 |
Quadrant B |
|---|---|---|---|
| Quadrant D | 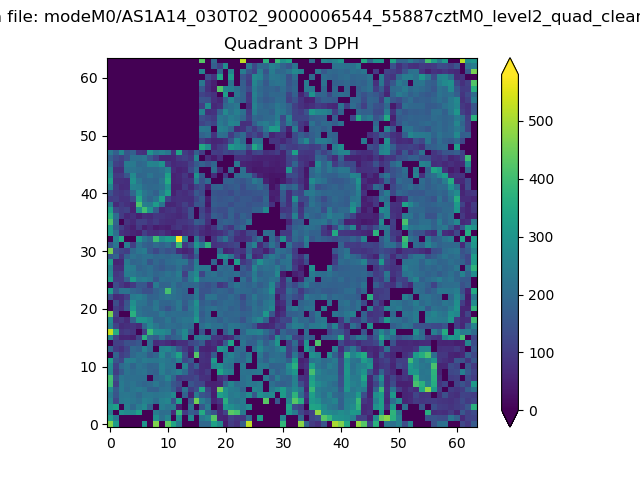 |
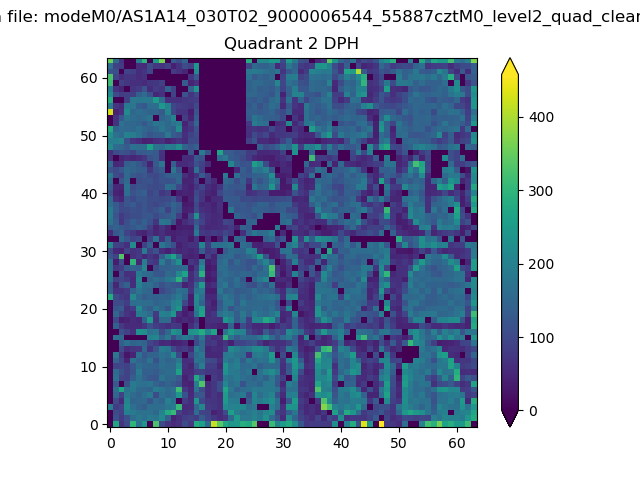 |
Quadrant C |
| Plot type | Count rate plots | Images |
|---|---|---|
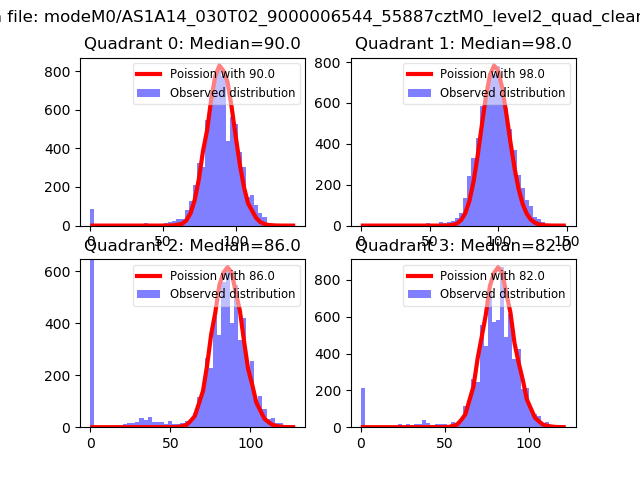
| Comparison with Poisson distribution Blue bars denote a histogram of data divided into 1 sec bins. Red curve is a Poisson curve with rate = median count rate of data. |
 |
 |
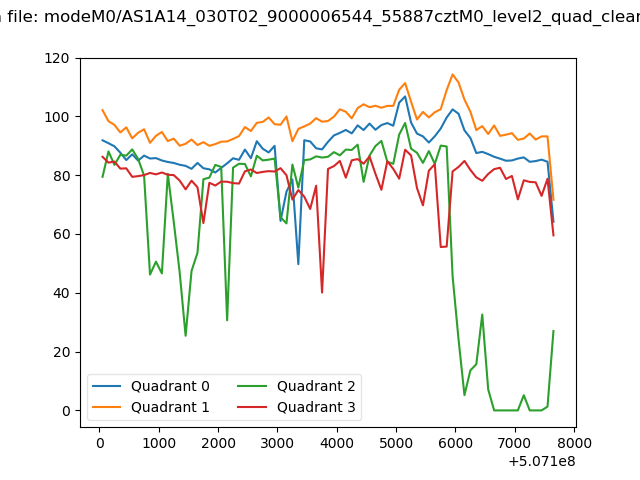
| Quadrant-wise count rates Data is divided into 100 sec bins |
 |
|
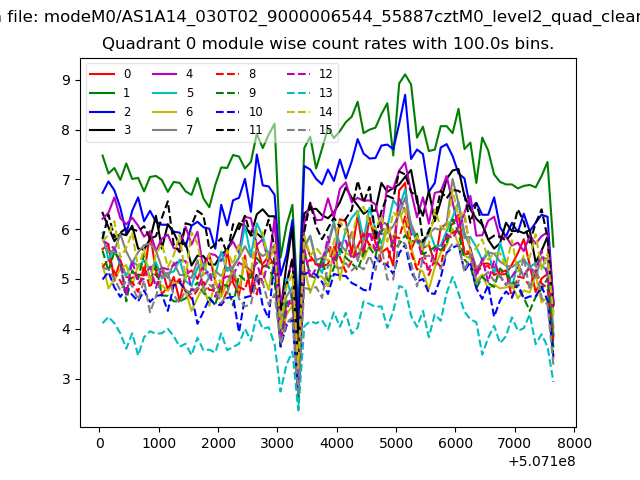
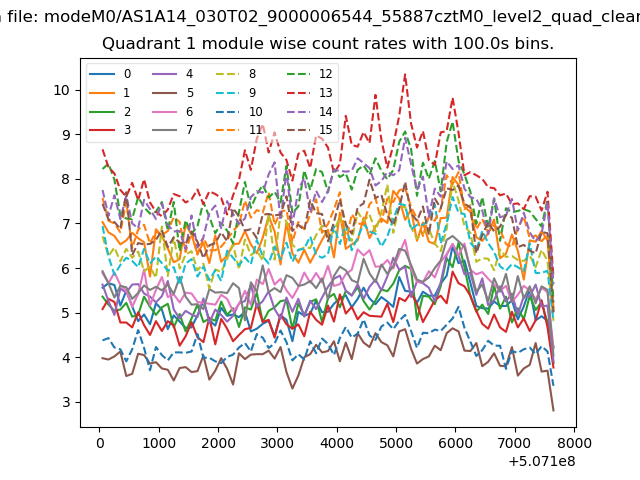
| Module-wise count rates for Quadrant A Data is divided into 100 sec bins |
 |
 |
| Module-wise count rates for Quadrant B Data is divided into 100 sec bins |
 |
 |
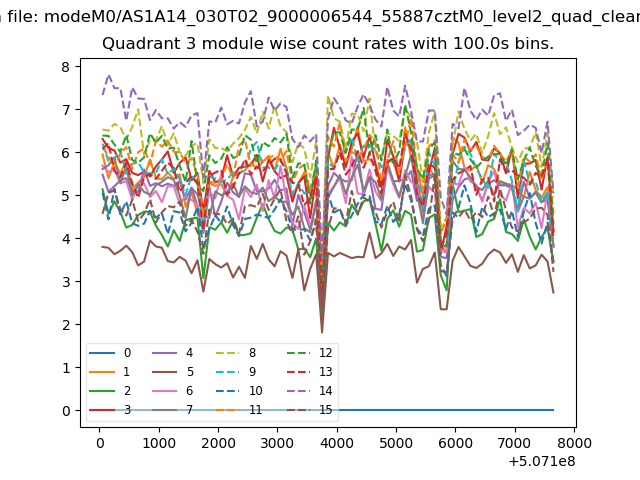
| Module-wise count rates for Quadrant C Data is divided into 100 sec bins |
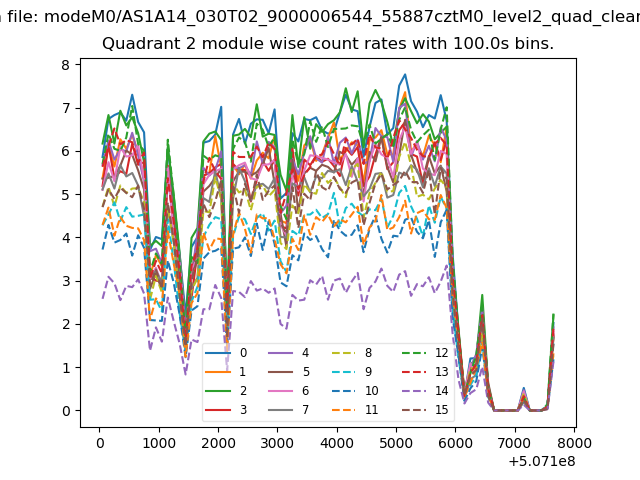 |
 |
| Module-wise count rates for Quadrant D Data is divided into 100 sec bins |
 |
 |
| Parameter | Plot |
|---|---|
| CZT HV Monitor | 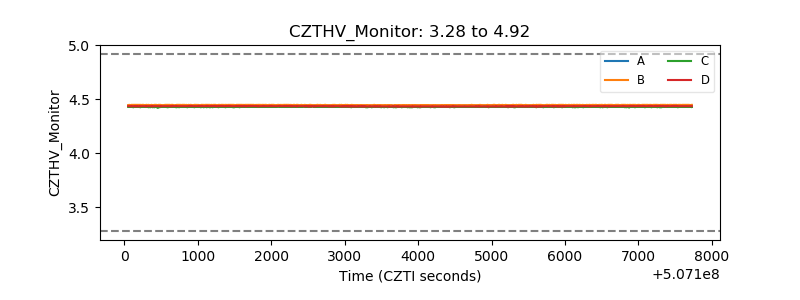 |
| D_VDD | 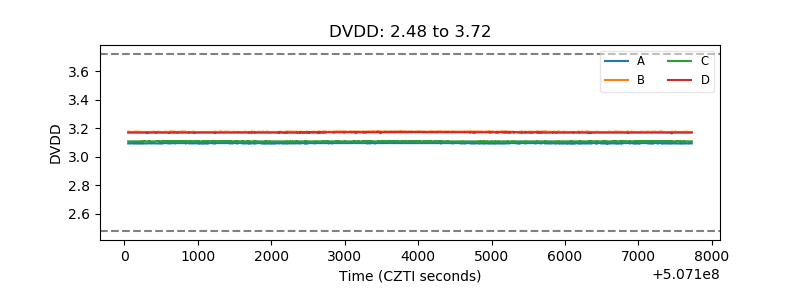 |
| Temperature 1 | 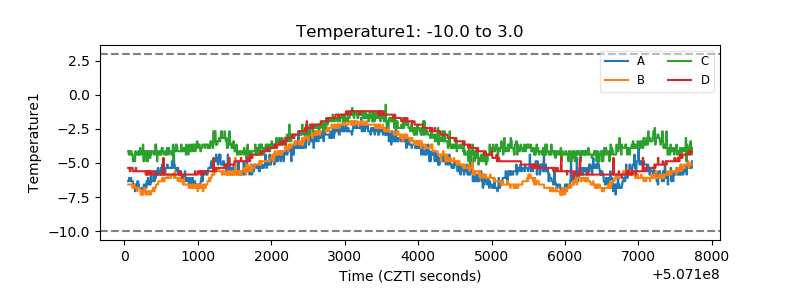 |
| Veto HV Monitor | 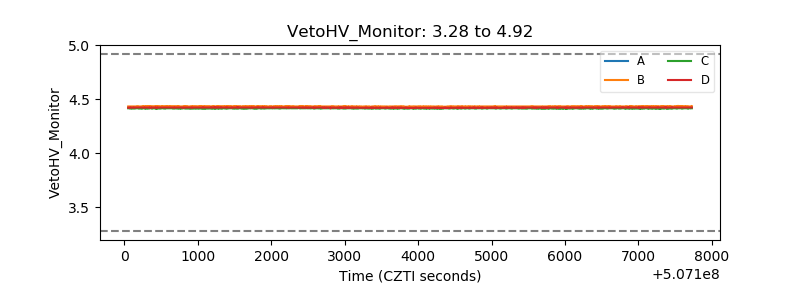 |
| Veto LLD | 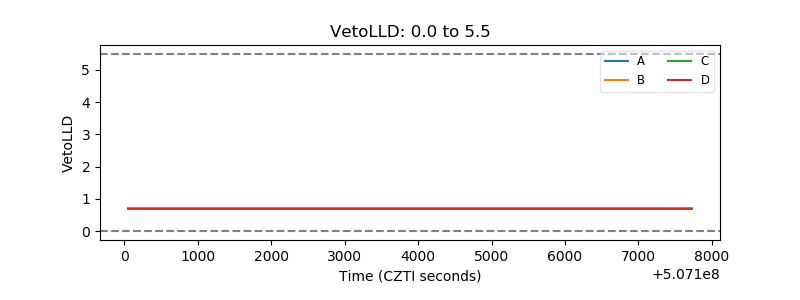 |
| Alpha Counter | 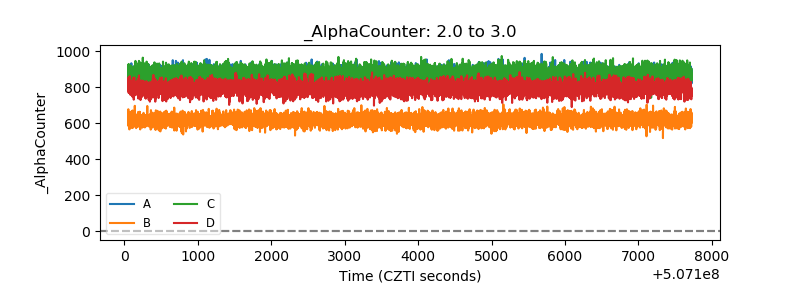 |
| _CPM_Rate | 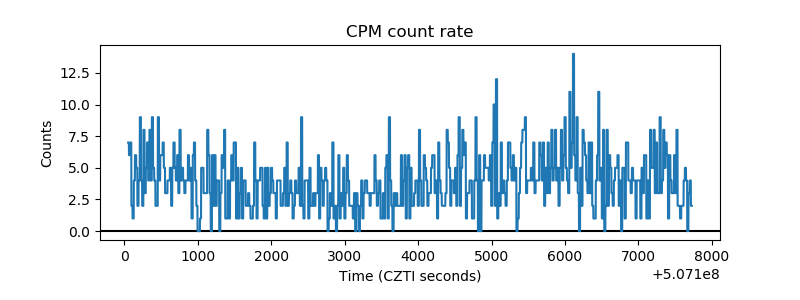 |
| CZT Counter | 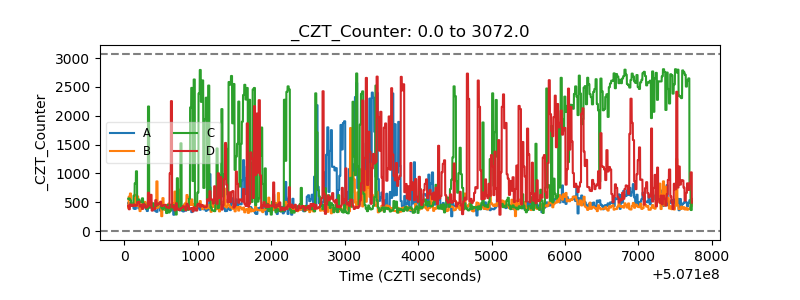 |
| +2.5 Volts monitor |  |
| +5 Volts monitor |  |
| _ROLL_ROT | 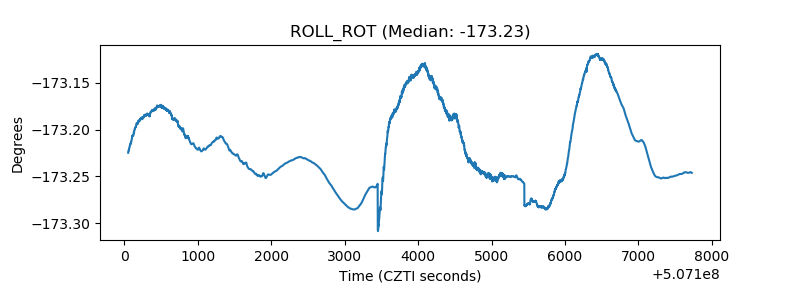 |
| _Roll_DEC | 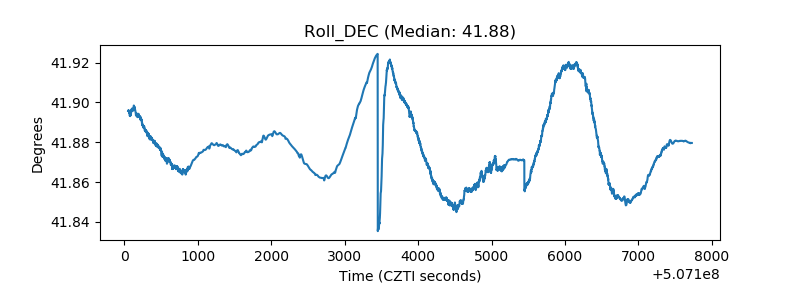 |
| _Roll_RA | 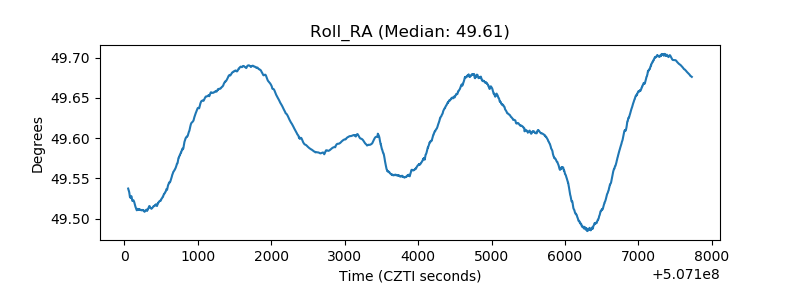 |
| Veto Counter | 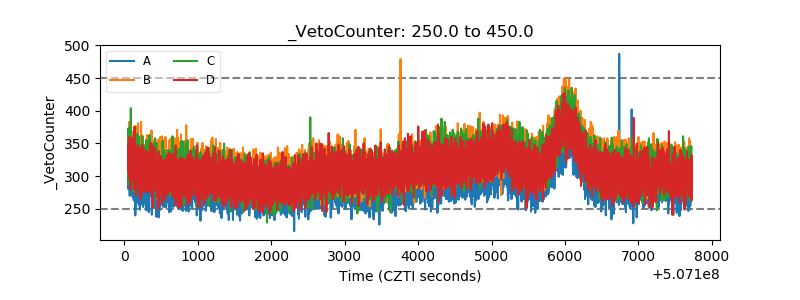 |