| Param | Original file | Final file |
|---|---|---|
| Filename | modeM0/AS1A14_030T02_9000006544_55890cztM0_level2.fits | modeM0/AS1A14_030T02_9000006544_55890cztM0_level2_quad_clean.evt |
| Size (bytes) | 795,283,200 | 127,912,320 |
| Size | 758.4 MB | 122.0 MB |
| Events in quadrant A | 6,155,249 | 862,533 |
| Events in quadrant B | 4,490,172 | 957,000 |
| Events in quadrant C | 11,757,749 | 576,883 |
| Events in quadrant D | 6,274,205 | 796,147 |
| Mode SS | |||
|---|---|---|---|
| Quadrant | BADHDUFLAG | Total packets | Discarded packets |
| A | 0 | 196 | 0 |
| B | 0 | 196 | 0 |
| C | 0 | 196 | 0 |
| D | 0 | 196 | 0 |
| Mode M0 | |||
|---|---|---|---|
| Quadrant | BADHDUFLAG | Total packets | Discarded packets |
| A | 0 | 24926 | 0 |
| B | 0 | 20857 | 0 |
| C | 0 | 42279 | 0 |
| D | 0 | 25578 | 0 |
| Quadrant | Total seconds | Saturated seconds | Saturation percentage |
|---|---|---|---|
| A | 9815 | 320 | 3.260316% |
| B | 9816 | 100 | 1.018745% |
| C | 9816 | 3273 | 33.343521% |
| D | 9816 | 159 | 1.619804% |
Noise dominated data is calculated using 1-second bins in cleaned event files. If a bin has >2000 counts, and if more than 50% of those come from <1% of pixels, then it is considered to be noise-dominated and hence unusable.
| Quadrant | # 1 sec bins | Bins with >0 counts | Bins with >2000 counts | High rate bins dominated by noise | Noise dominated (total time) | Noise dominated (detector-on time) | Marked lightcurve |
|---|---|---|---|---|---|---|---|
| A | 9815 | 9815 | 281 | 281 | 2.86% | 2.86% | 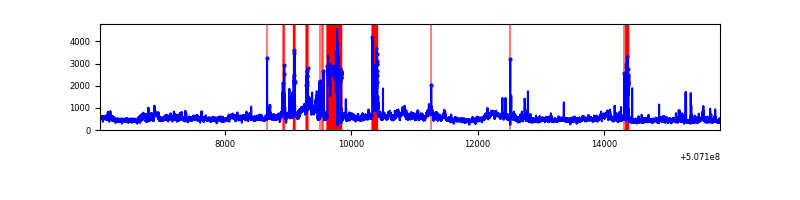 |
| B | 9816 | 9816 | 37 | 37 | 0.38% | 0.38% | 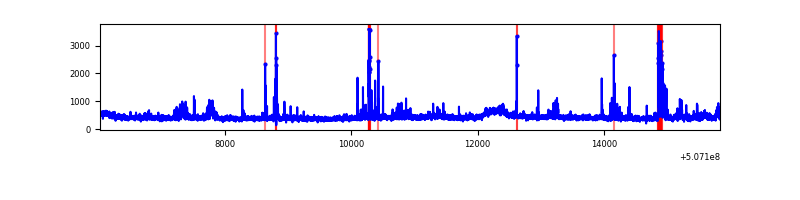 |
| C | 9816 | 9816 | 2976 | 2976 | 30.32% | 30.32% | 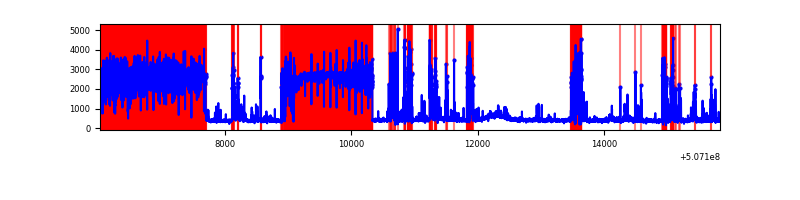 |
| D | 9816 | 9816 | 139 | 139 | 1.42% | 1.42% | 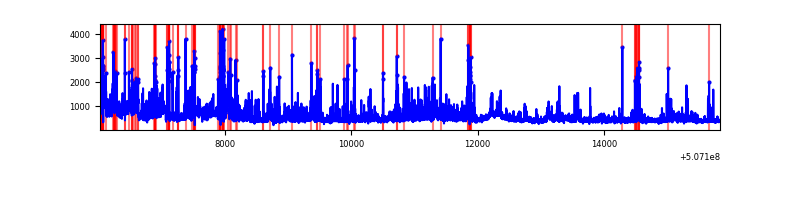 |
Top three noisy pixels from each quadrant. If the there are fewer than three noisy pixels in the level2.evt file, extra rows are filled as -1
| Pixel properties | Quadrant properties | ||||||
|---|---|---|---|---|---|---|---|
| Quadrant | DetID | PixID | Counts | Sigma | Mean | Median | Sigma |
| A | 12 | 115 | 1091726 | 4489.02 | 985 | 961 | 243.0 |
| A | 7 | 64 | 742525 | 3051.89 | 985 | 961 | 243.0 |
| A | 15 | 32 | 350683 | 1439.27 | 985 | 961 | 243.0 |
| B | 0 | 199 | 149822 | 694.69 | 997 | 961 | 214.3 |
| B | 0 | 153 | 139933 | 648.54 | 997 | 961 | 214.3 |
| B | 7 | 0 | 73242 | 337.31 | 997 | 961 | 214.3 |
| C | 15 | 199 | 7991760 | 37072.01 | 787 | 780 | 215.6 |
| C | 14 | 80 | 282096 | 1305.09 | 787 | 780 | 215.6 |
| C | 15 | 147 | 175138 | 808.89 | 787 | 780 | 215.6 |
| D | 2 | 62 | 763195 | 2814.31 | 969 | 927 | 270.9 |
| D | 11 | 129 | 572041 | 2108.56 | 969 | 927 | 270.9 |
| D | 7 | 96 | 232807 | 856.1 | 969 | 927 | 270.9 |
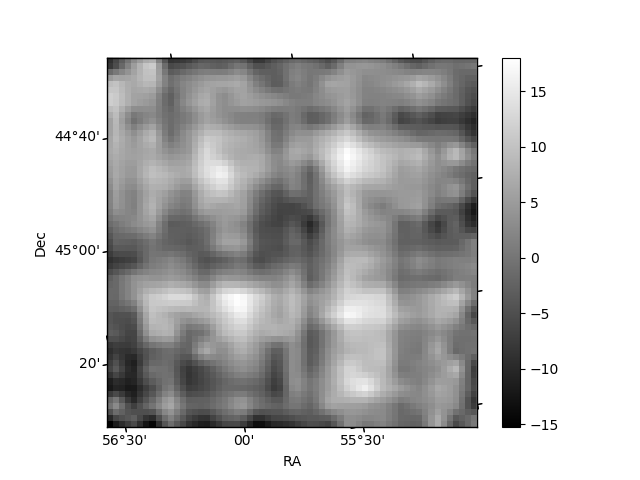
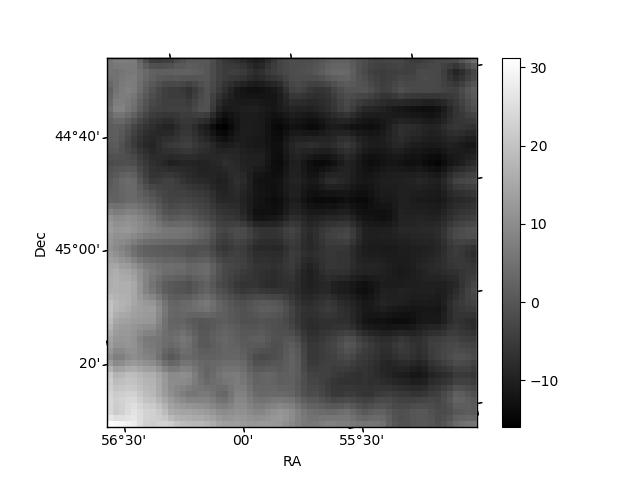
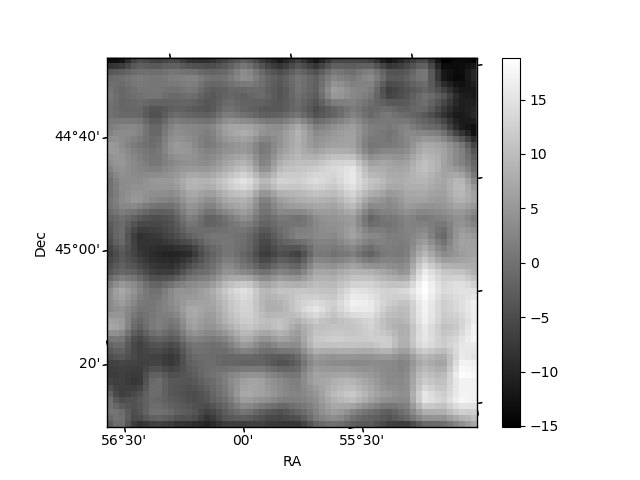
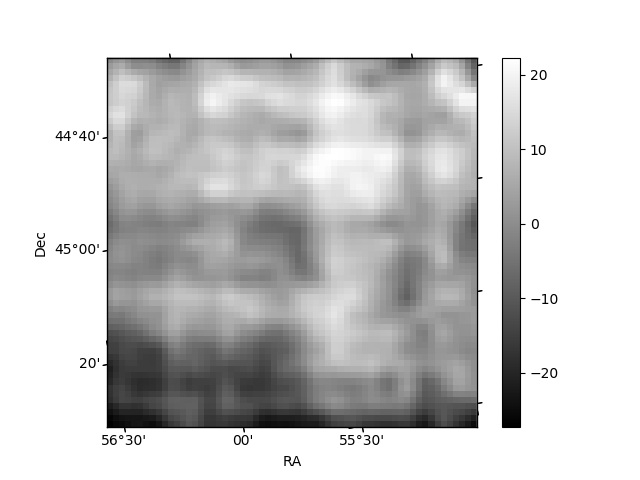
Histogram calculated using DETX and DETY for each event in the final _common_clean file
| Quadrant A | 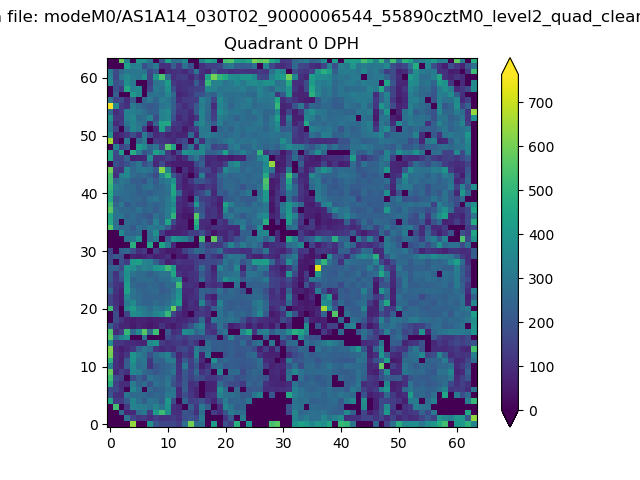 |
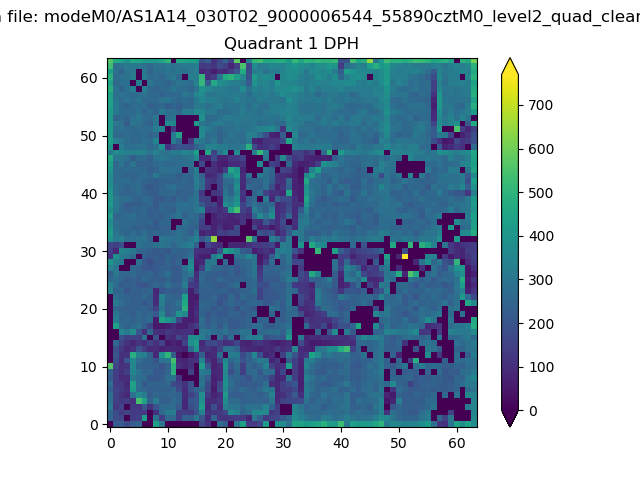 |
Quadrant B |
|---|---|---|---|
| Quadrant D | 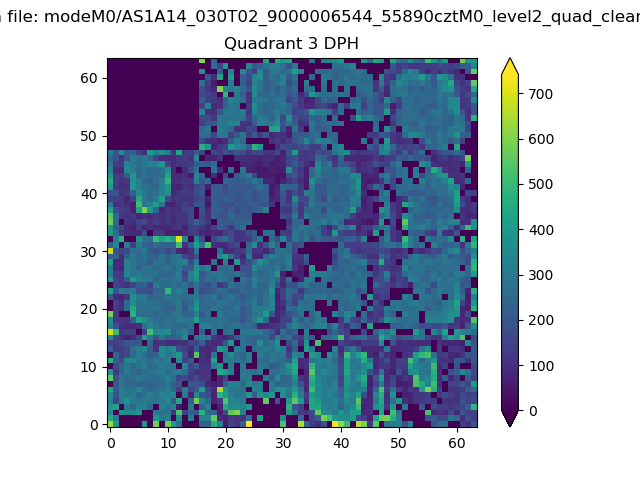 |
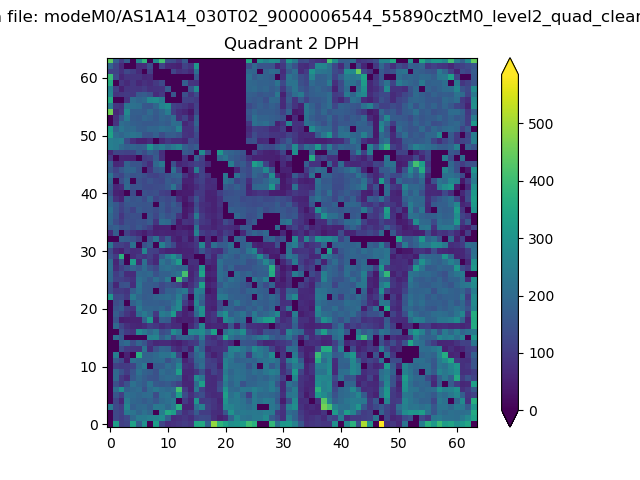 |
Quadrant C |
| Plot type | Count rate plots | Images |
|---|---|---|
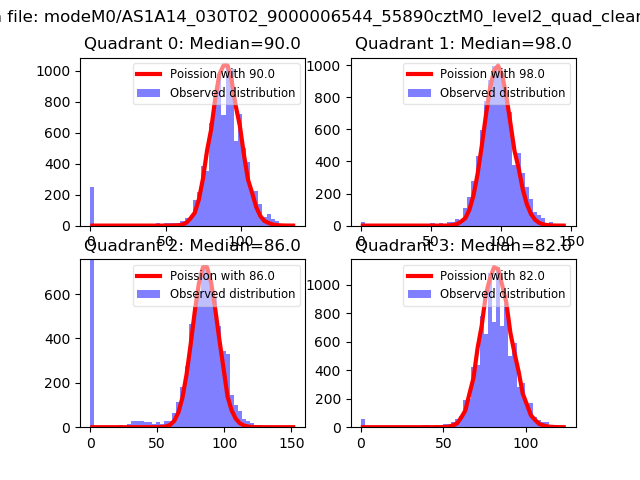
| Comparison with Poisson distribution Blue bars denote a histogram of data divided into 1 sec bins. Red curve is a Poisson curve with rate = median count rate of data. |
 |
 |
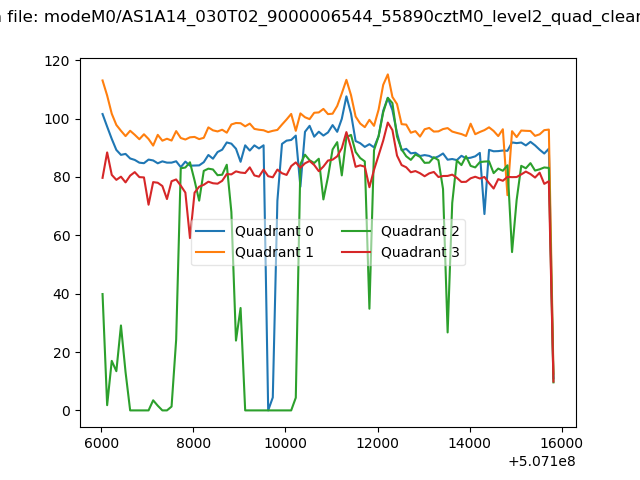
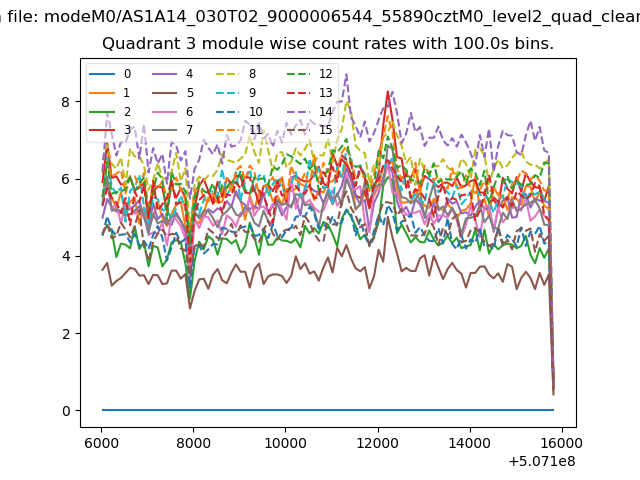
| Quadrant-wise count rates Data is divided into 100 sec bins |
 |
|
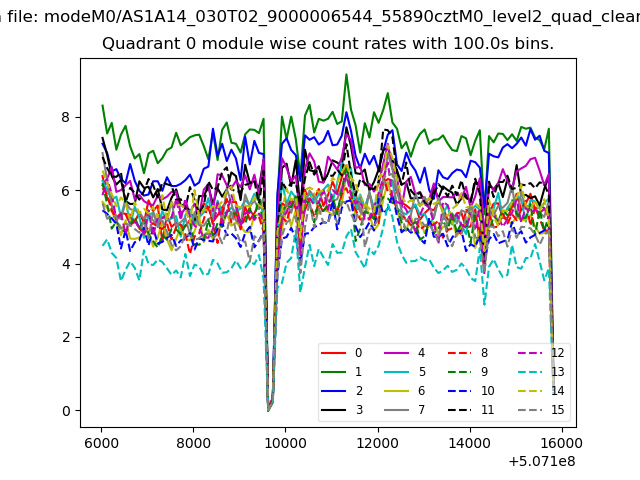
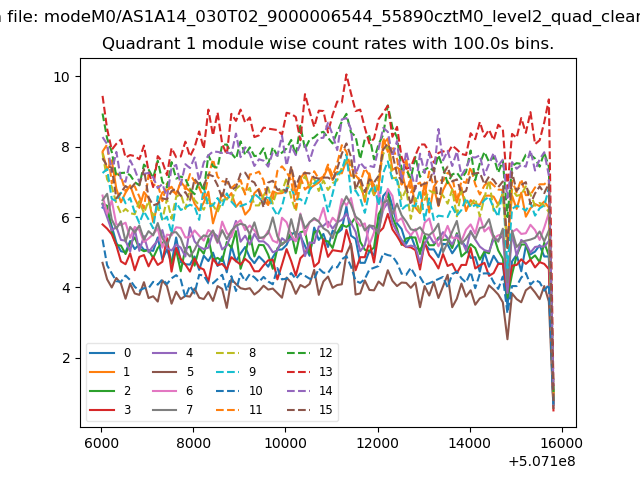
| Module-wise count rates for Quadrant A Data is divided into 100 sec bins |
 |
 |
| Module-wise count rates for Quadrant B Data is divided into 100 sec bins |
 |
 |
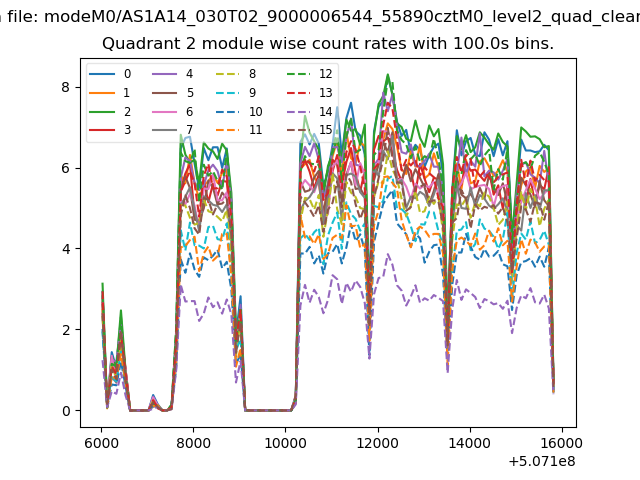
| Module-wise count rates for Quadrant C Data is divided into 100 sec bins |
 |
 |
| Module-wise count rates for Quadrant D Data is divided into 100 sec bins |
 |
 |
| Parameter | Plot |
|---|---|
| CZT HV Monitor | 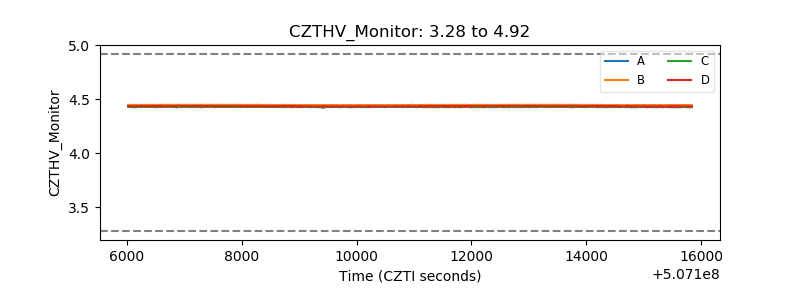 |
| D_VDD | 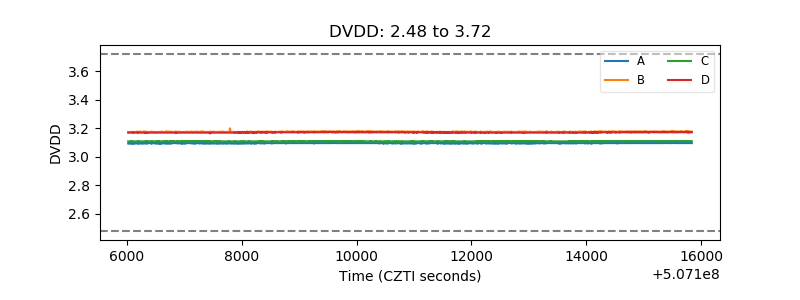 |
| Temperature 1 | 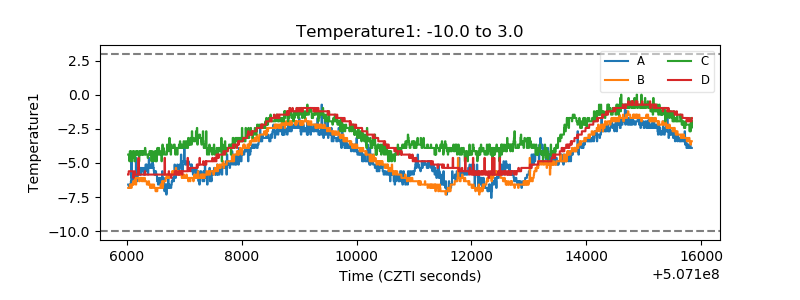 |
| Veto HV Monitor | 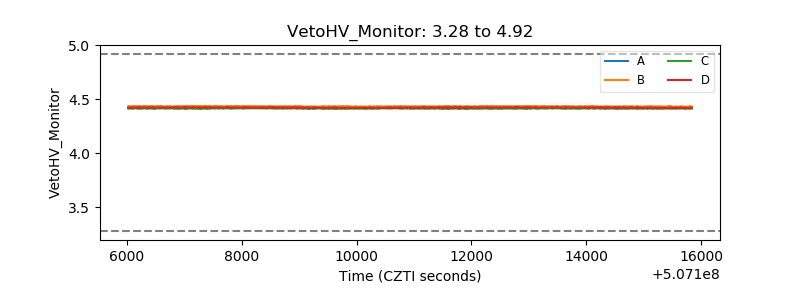 |
| Veto LLD | 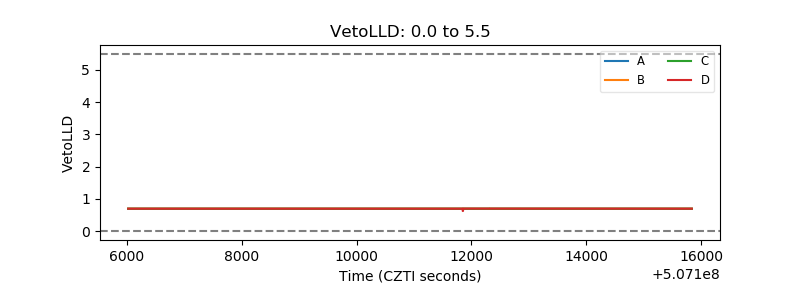 |
| Alpha Counter | 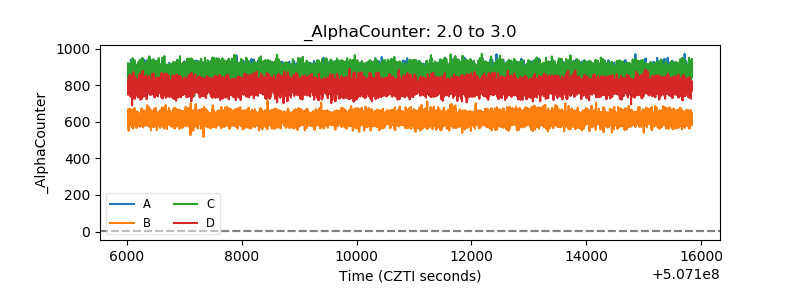 |
| _CPM_Rate | 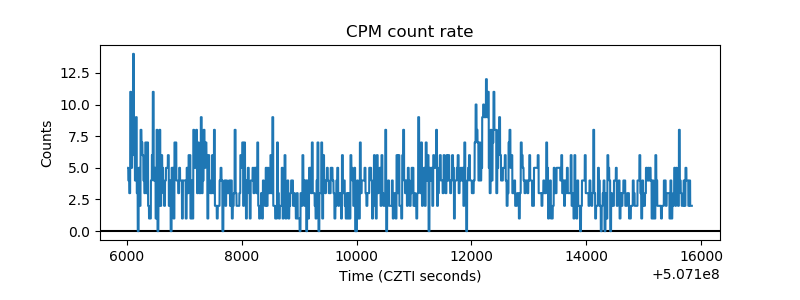 |
| CZT Counter | 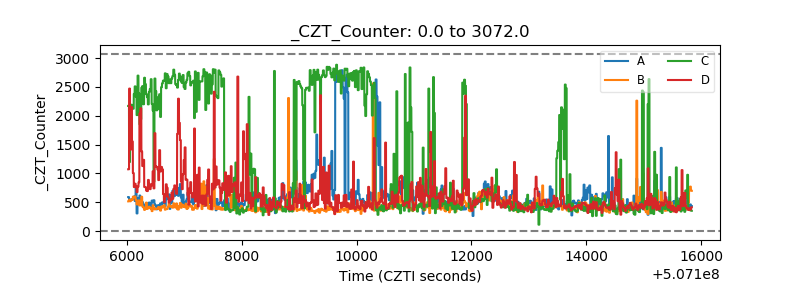 |
| +2.5 Volts monitor |  |
| +5 Volts monitor |  |
| _ROLL_ROT | 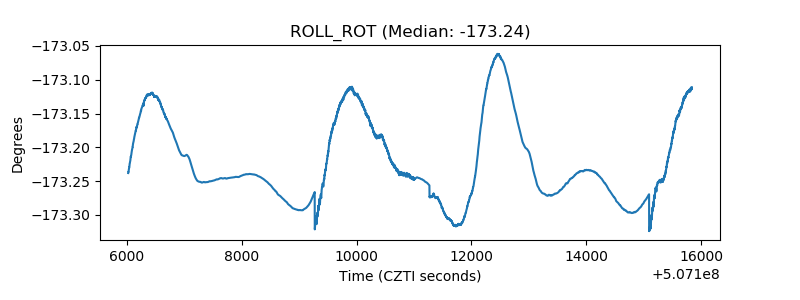 |
| _Roll_DEC | 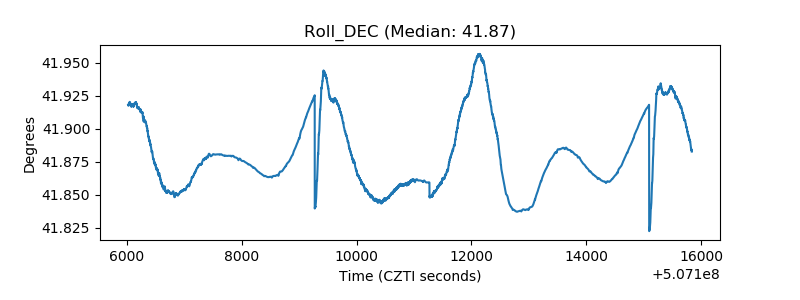 |
| _Roll_RA | 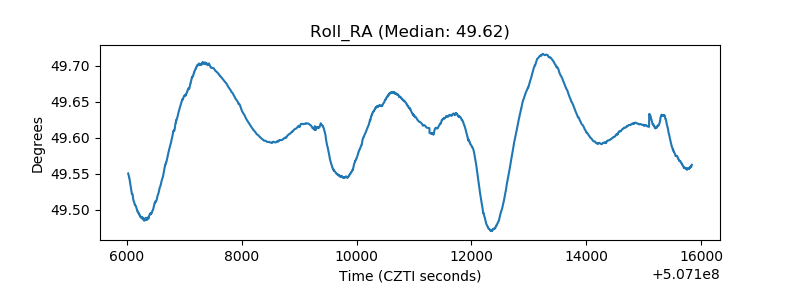 |
| Veto Counter | 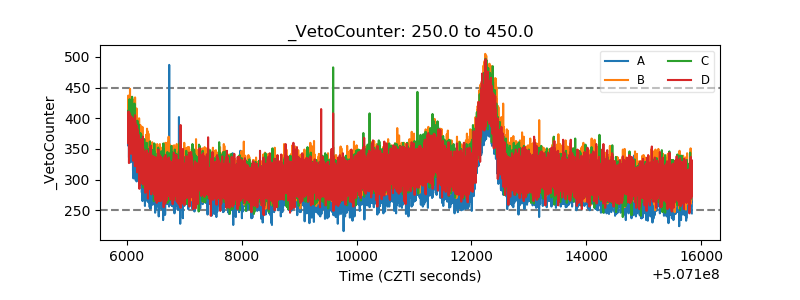 |