| Param | Original file | Final file |
|---|---|---|
| Filename | modeM0/AS1A14_030T02_9000006544_55891cztM0_level2.fits | modeM0/AS1A14_030T02_9000006544_55891cztM0_level2_quad_clean.evt |
| Size (bytes) | 789,963,840 | 179,501,760 |
| Size | 753.4 MB | 171.2 MB |
| Events in quadrant A | 12,042,584 | 1,436,037 |
| Events in quadrant B | 7,864,492 | 1,637,526 |
| Events in quadrant C | 8,337,551 | 1,462,523 |
| Events in quadrant D | 9,775 | 94 |
| Mode SS | |||
|---|---|---|---|
| Quadrant | BADHDUFLAG | Total packets | Discarded packets |
| A | 0 | 342 | 0 |
| B | 0 | 342 | 0 |
| C | 0 | 342 | 0 |
| D | 0 | 342 | 0 |
| Mode M9 | |||
|---|---|---|---|
| Quadrant | BADHDUFLAG | Total packets | Discarded packets |
| A | 0 | 13 | 0 |
| B | 0 | 13 | 0 |
| C | 0 | 13 | 0 |
| D | 0 | 13 | 0 |
| Mode M0 | |||
|---|---|---|---|
| Quadrant | BADHDUFLAG | Total packets | Discarded packets |
| A | 0 | 47964 | 6 |
| B | 0 | 36202 | 3 |
| C | 0 | 38115 | 3 |
| D | 0 | 48 | 0 |
| Quadrant | Total seconds | Saturated seconds | Saturation percentage |
|---|---|---|---|
| A | 16972 | 1163 | 6.852463% |
| B | 16973 | 457 | 2.692512% |
| C | 16973 | 451 | 2.657161% |
| D | 24 | 0 | 0.000000% |
Noise dominated data is calculated using 1-second bins in cleaned event files. If a bin has >2000 counts, and if more than 50% of those come from <1% of pixels, then it is considered to be noise-dominated and hence unusable.
| Quadrant | # 1 sec bins | Bins with >0 counts | Bins with >2000 counts | High rate bins dominated by noise | Noise dominated (total time) | Noise dominated (detector-on time) | Marked lightcurve |
|---|---|---|---|---|---|---|---|
| A | 18167 | 16976 | 759 | 759 | 4.18% | 4.47% | 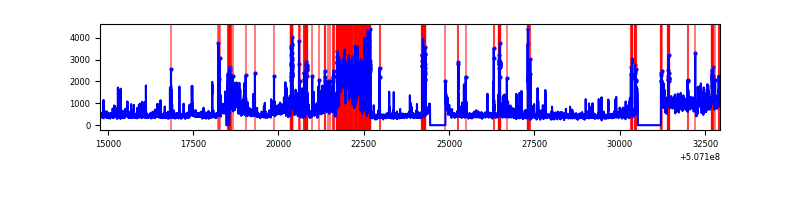 |
| B | 18168 | 16977 | 35 | 35 | 0.19% | 0.21% | 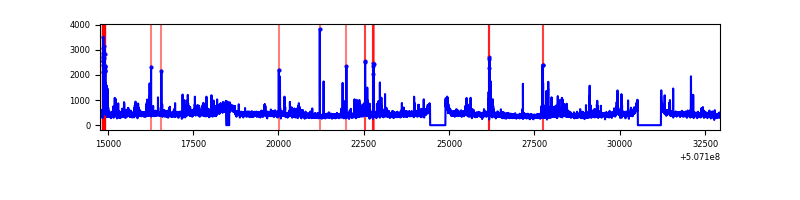 |
| C | 18168 | 16977 | 192 | 192 | 1.06% | 1.13% | 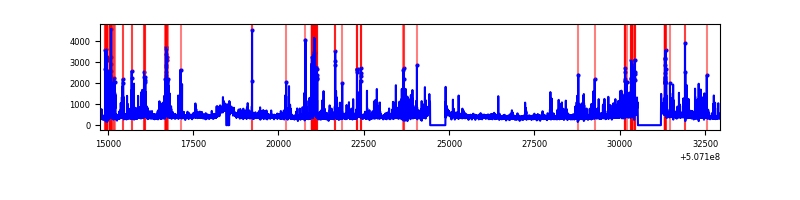 |
| D | 24 | 24 | 0 | 0 | 0.00% | 0.00% |  |
Top three noisy pixels from each quadrant. If the there are fewer than three noisy pixels in the level2.evt file, extra rows are filled as -1
| Pixel properties | Quadrant properties | ||||||
|---|---|---|---|---|---|---|---|
| Quadrant | DetID | PixID | Counts | Sigma | Mean | Median | Sigma |
| A | 7 | 64 | 1696829 | 3898.68 | 1762 | 1715 | 434.8 |
| A | 3 | 14 | 1219155 | 2800.06 | 1762 | 1715 | 434.8 |
| A | 12 | 115 | 1064403 | 2444.13 | 1762 | 1715 | 434.8 |
| B | 0 | 199 | 295601 | 771.84 | 1764 | 1694 | 380.8 |
| B | 7 | 0 | 200536 | 522.19 | 1764 | 1694 | 380.8 |
| B | 0 | 153 | 178650 | 464.71 | 1764 | 1694 | 380.8 |
| C | 12 | 252 | 623361 | 1318.3 | 1737 | 1716 | 471.5 |
| C | 15 | 199 | 581886 | 1230.35 | 1737 | 1716 | 471.5 |
| C | 15 | 147 | 191430 | 402.32 | 1737 | 1716 | 471.5 |
| D | 5 | 173 | 233 | 175.98 | 2 | 2 | 1.3 |
| D | 5 | 113 | 202 | 152.36 | 2 | 2 | 1.3 |
| D | 7 | 129 | 182 | 137.12 | 2 | 2 | 1.3 |
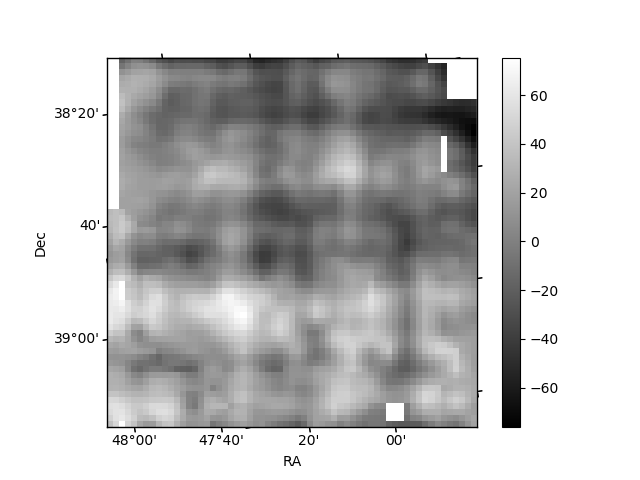
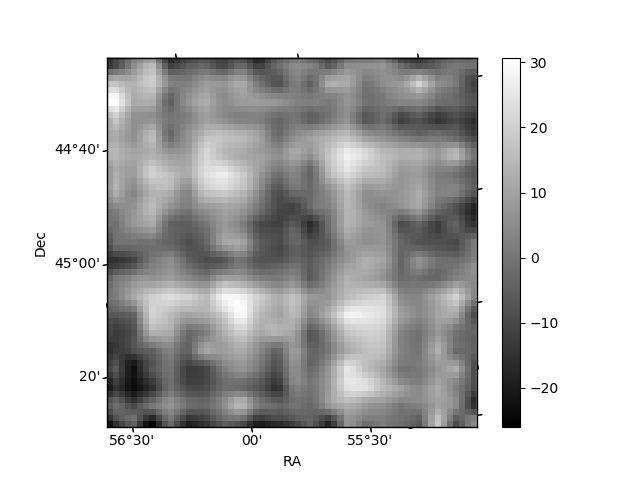
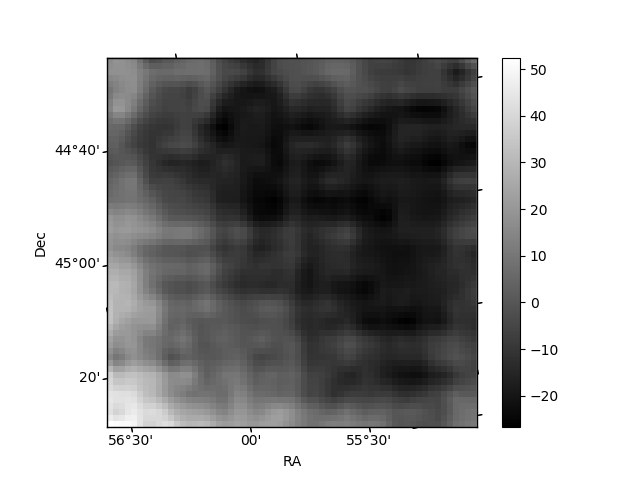
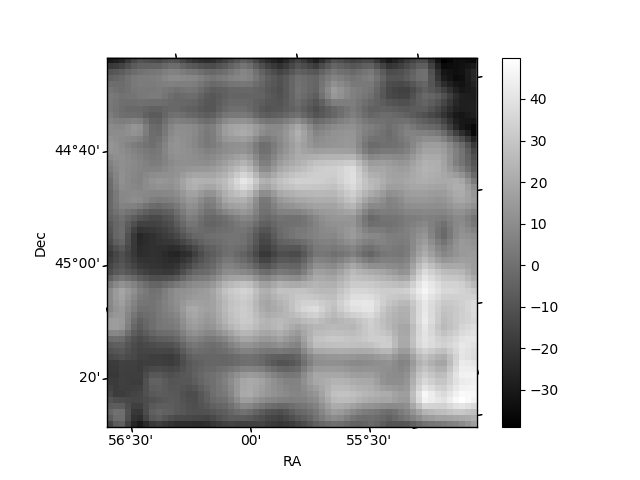
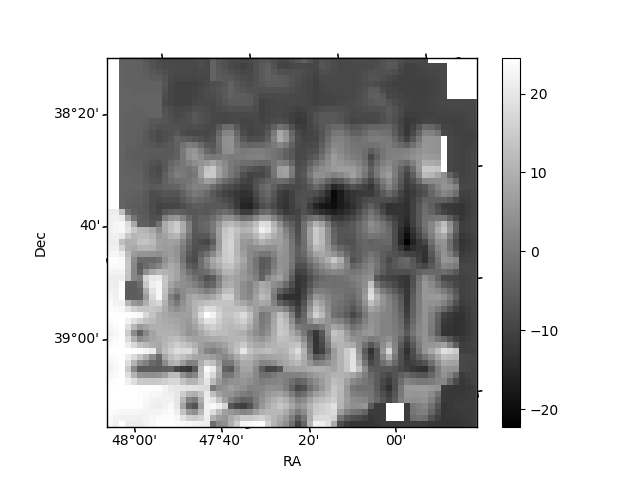
Histogram calculated using DETX and DETY for each event in the final _common_clean file
| Quadrant A | 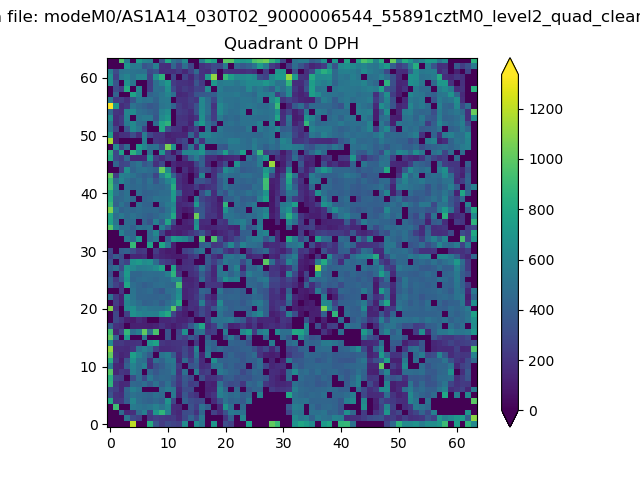 |
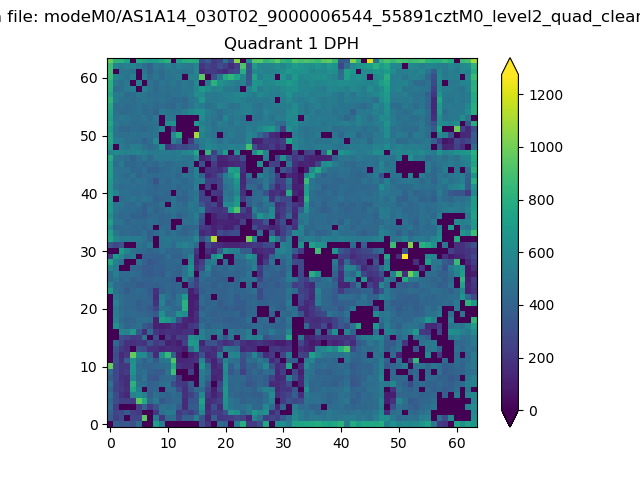 |
Quadrant B |
|---|---|---|---|
| Quadrant D | 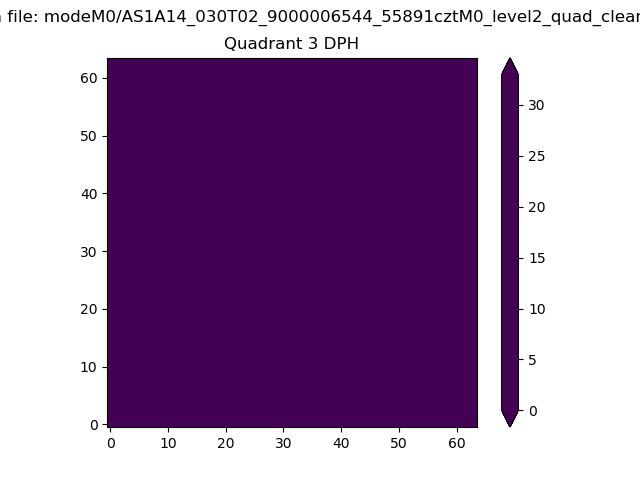 |
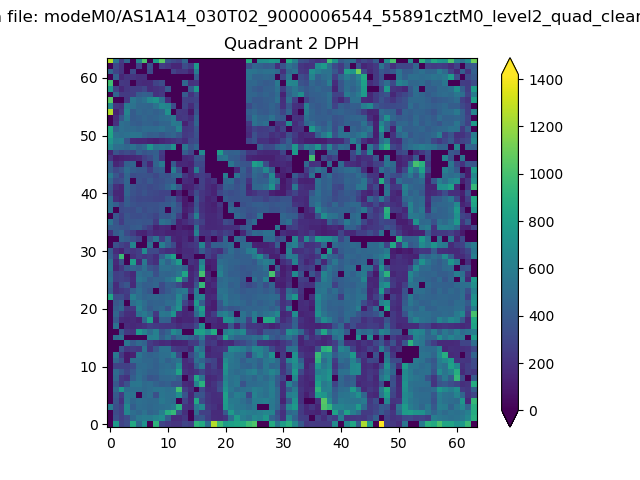 |
Quadrant C |
| Plot type | Count rate plots | Images |
|---|---|---|
| Comparison with Poisson distribution Blue bars denote a histogram of data divided into 1 sec bins. Red curve is a Poisson curve with rate = median count rate of data. |
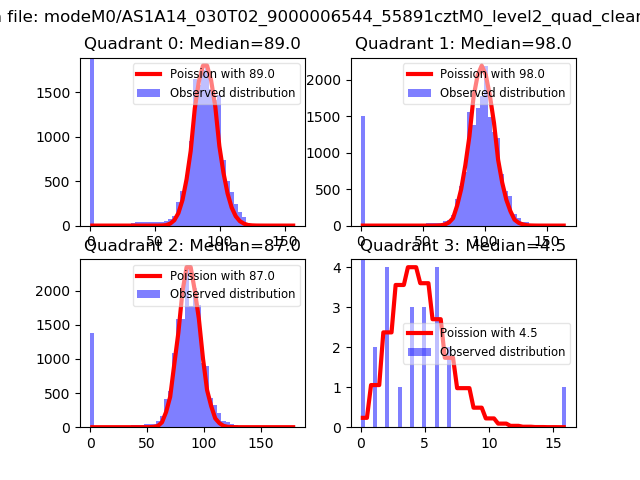 |
 |
| Quadrant-wise count rates Data is divided into 100 sec bins |
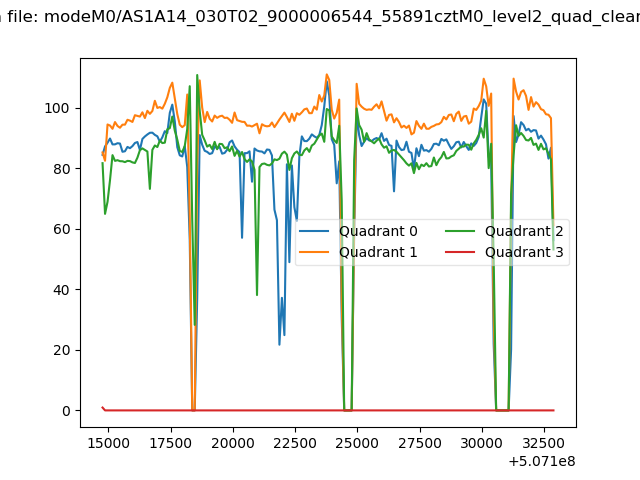 |
|
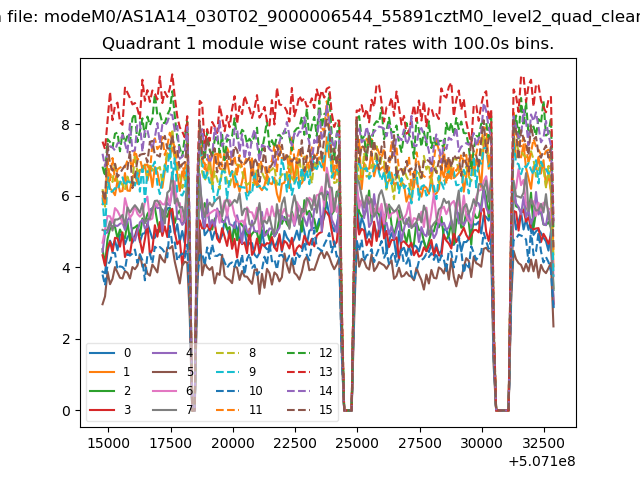
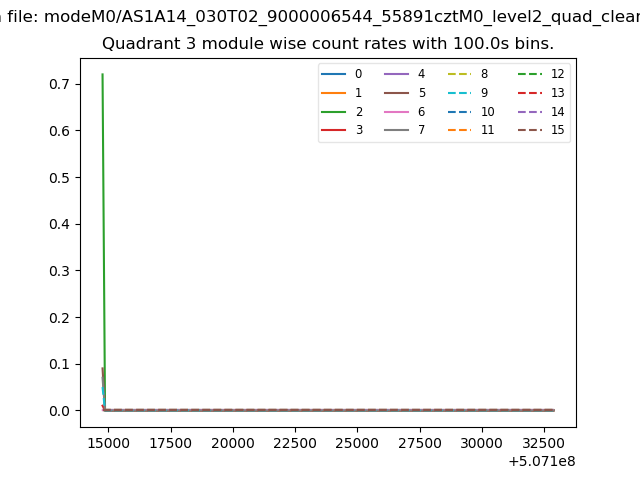
| Module-wise count rates for Quadrant A Data is divided into 100 sec bins |
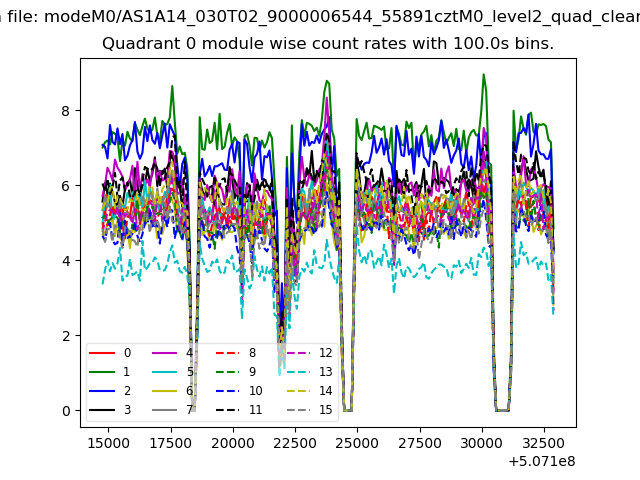 |
 |
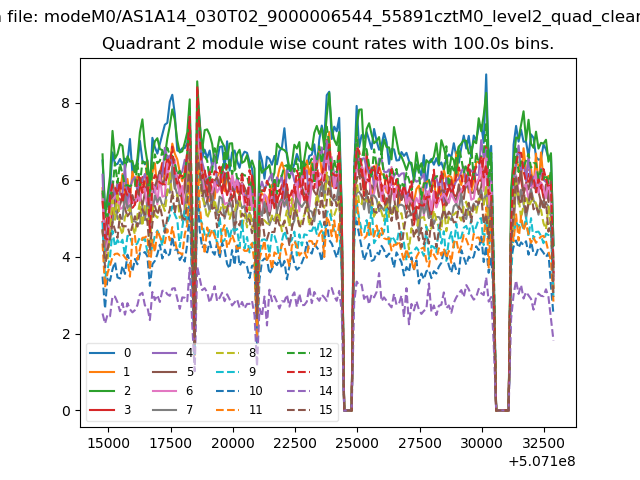
| Module-wise count rates for Quadrant B Data is divided into 100 sec bins |
 |
 |
| Module-wise count rates for Quadrant C Data is divided into 100 sec bins |
 |
 |
| Module-wise count rates for Quadrant D Data is divided into 100 sec bins |
 |
 |
| Parameter | Plot |
|---|---|
| CZT HV Monitor | 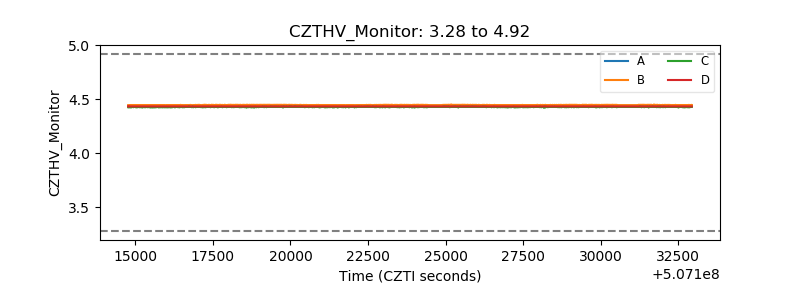 |
| D_VDD | 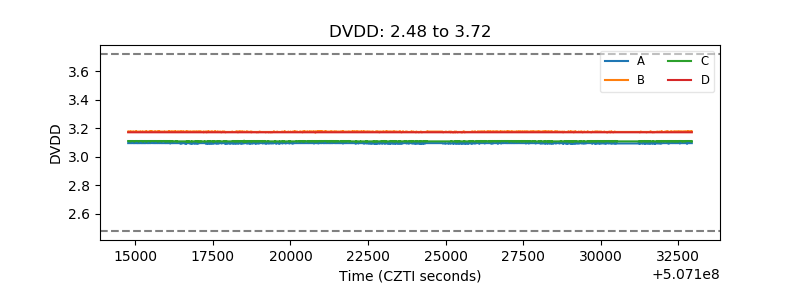 |
| Temperature 1 | 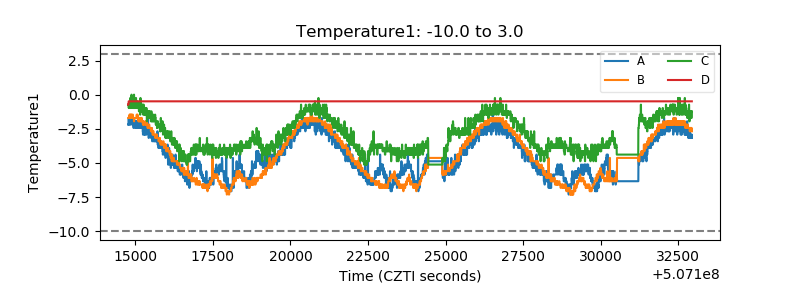 |
| Veto HV Monitor |  |
| Veto LLD | 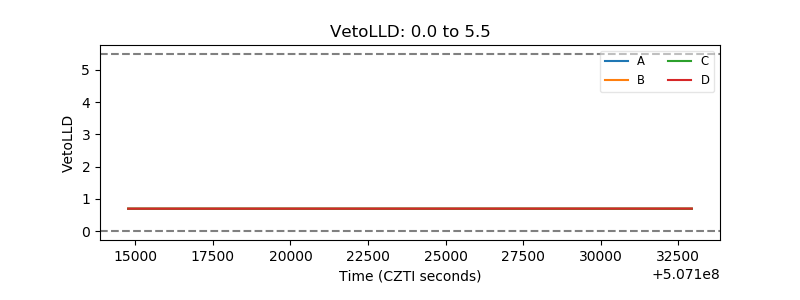 |
| Alpha Counter | 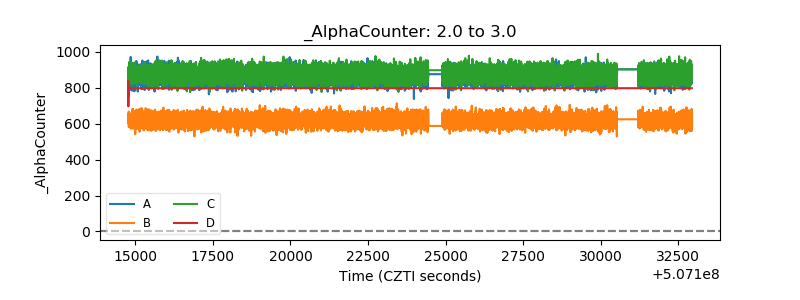 |
| _CPM_Rate | 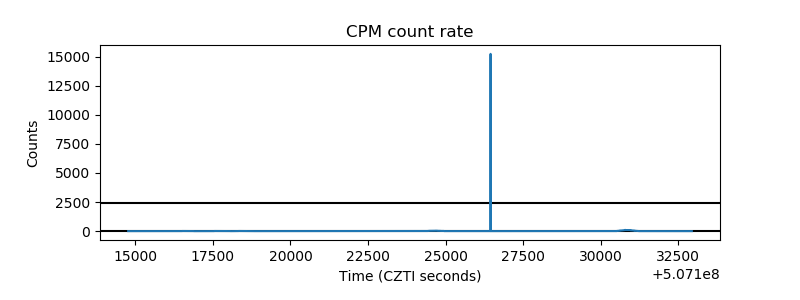 |
| CZT Counter | 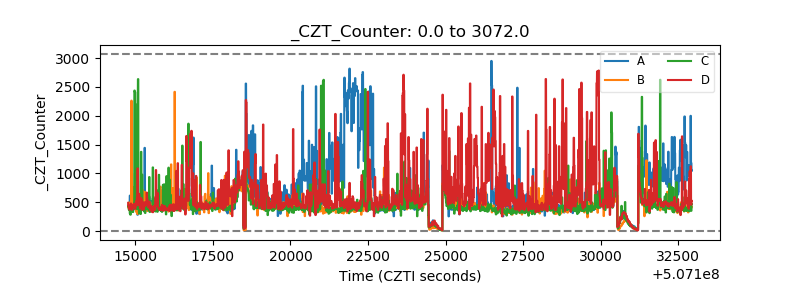 |
| +2.5 Volts monitor |  |
| +5 Volts monitor |  |
| _ROLL_ROT | 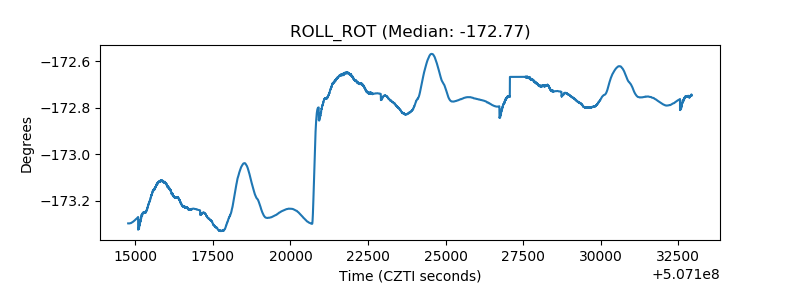 |
| _Roll_DEC | 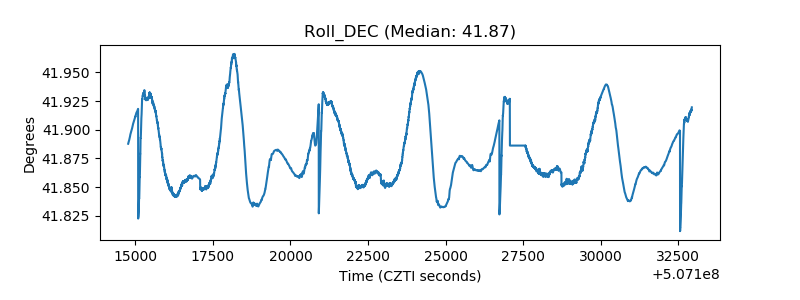 |
| _Roll_RA | 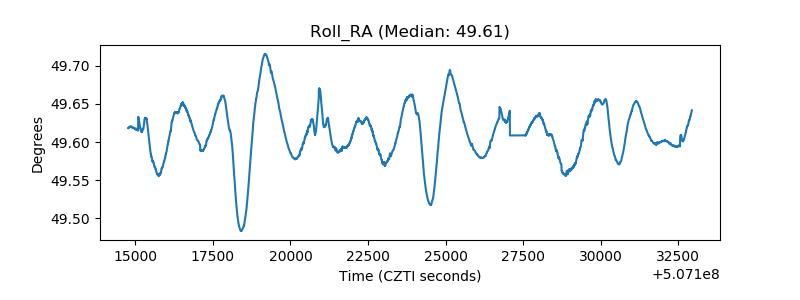 |
| Veto Counter | 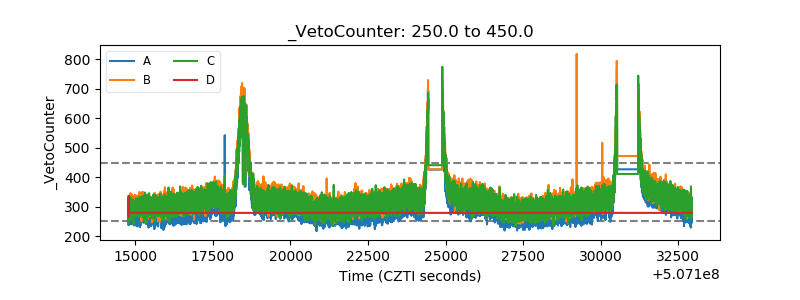 |