| Param | Original file | Final file |
|---|---|---|
| Filename | modeM0/AS1A14_030T02_9000006544_55892cztM0_level2.fits | modeM0/AS1A14_030T02_9000006544_55892cztM0_level2_quad_clean.evt |
| Size (bytes) | 469,465,920 | 96,485,760 |
| Size | 447.7 MB | 92.0 MB |
| Events in quadrant A | 5,738,691 | 625,086 |
| Events in quadrant B | 2,990,928 | 679,820 |
| Events in quadrant C | 3,720,764 | 591,254 |
| Events in quadrant D | 4,402,359 | 554,088 |
| Mode SS | |||
|---|---|---|---|
| Quadrant | BADHDUFLAG | Total packets | Discarded packets |
| A | 0 | 136 | 0 |
| B | 0 | 136 | 0 |
| C | 0 | 136 | 0 |
| D | 0 | 136 | 0 |
| Mode M9 | |||
|---|---|---|---|
| Quadrant | BADHDUFLAG | Total packets | Discarded packets |
| A | 0 | 9 | 0 |
| B | 0 | 9 | 0 |
| C | 0 | 9 | 0 |
| D | 0 | 9 | 0 |
| Mode M0 | |||
|---|---|---|---|
| Quadrant | BADHDUFLAG | Total packets | Discarded packets |
| A | 0 | 21901 | 1 |
| B | 0 | 14072 | 1 |
| C | 0 | 16164 | 1 |
| D | 0 | 17627 | 1 |
| Quadrant | Total seconds | Saturated seconds | Saturation percentage |
|---|---|---|---|
| A | 6765 | 200 | 2.956393% |
| B | 6765 | 56 | 0.827790% |
| C | 6765 | 212 | 3.133777% |
| D | 6766 | 292 | 4.315696% |
Noise dominated data is calculated using 1-second bins in cleaned event files. If a bin has >2000 counts, and if more than 50% of those come from <1% of pixels, then it is considered to be noise-dominated and hence unusable.
| Quadrant | # 1 sec bins | Bins with >0 counts | Bins with >2000 counts | High rate bins dominated by noise | Noise dominated (total time) | Noise dominated (detector-on time) | Marked lightcurve |
|---|---|---|---|---|---|---|---|
| A | 7635 | 6766 | 192 | 192 | 2.51% | 2.84% | 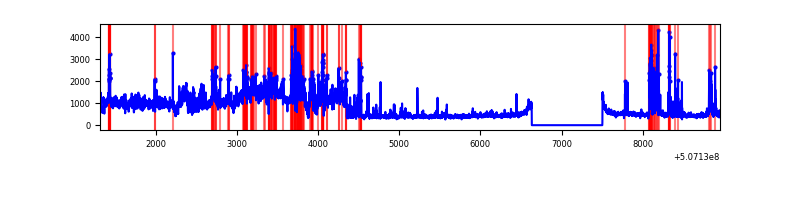 |
| B | 7635 | 6766 | 8 | 8 | 0.10% | 0.12% | 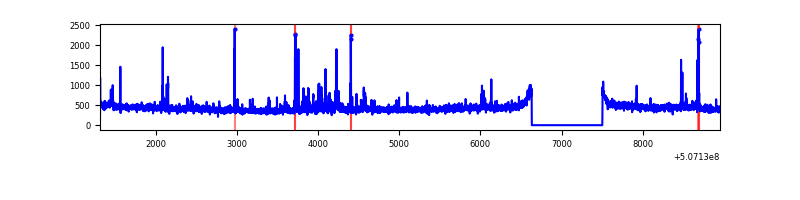 |
| C | 7635 | 6766 | 110 | 110 | 1.44% | 1.63% | 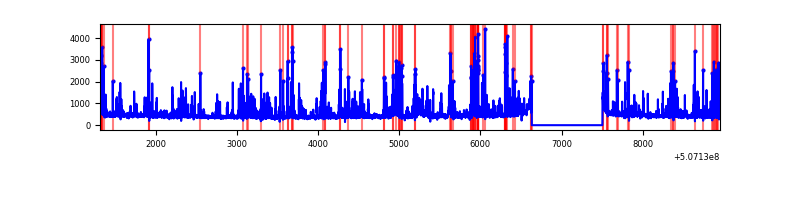 |
| D | 7636 | 6767 | 245 | 245 | 3.21% | 3.62% | 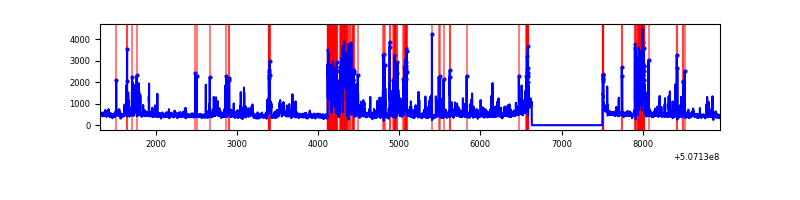 |
Top three noisy pixels from each quadrant. If the there are fewer than three noisy pixels in the level2.evt file, extra rows are filled as -1
| Pixel properties | Quadrant properties | ||||||
|---|---|---|---|---|---|---|---|
| Quadrant | DetID | PixID | Counts | Sigma | Mean | Median | Sigma |
| A | 3 | 14 | 2422755 | 13825.5 | 704 | 686 | 175.2 |
| A | 15 | 32 | 262529 | 1494.64 | 704 | 686 | 175.2 |
| A | 0 | 8 | 158698 | 901.95 | 704 | 686 | 175.2 |
| B | 0 | 199 | 95091 | 625.33 | 699 | 674 | 151.0 |
| B | 0 | 143 | 63634 | 416.99 | 699 | 674 | 151.0 |
| B | 0 | 153 | 18204 | 116.1 | 699 | 674 | 151.0 |
| C | 12 | 252 | 740749 | 3919.51 | 681 | 673 | 188.8 |
| C | 6 | 223 | 182164 | 961.19 | 681 | 673 | 188.8 |
| C | 15 | 199 | 100256 | 527.4 | 681 | 673 | 188.8 |
| D | 11 | 129 | 705334 | 3696.89 | 679 | 651 | 190.6 |
| D | 3 | 12 | 336750 | 1763.23 | 679 | 651 | 190.6 |
| D | 7 | 96 | 182812 | 955.65 | 679 | 651 | 190.6 |
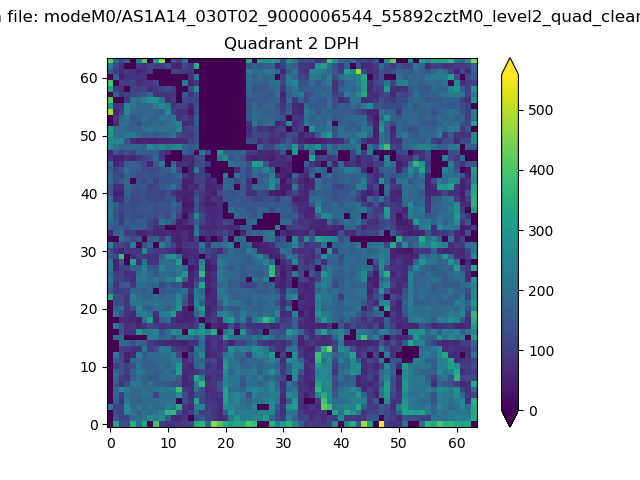
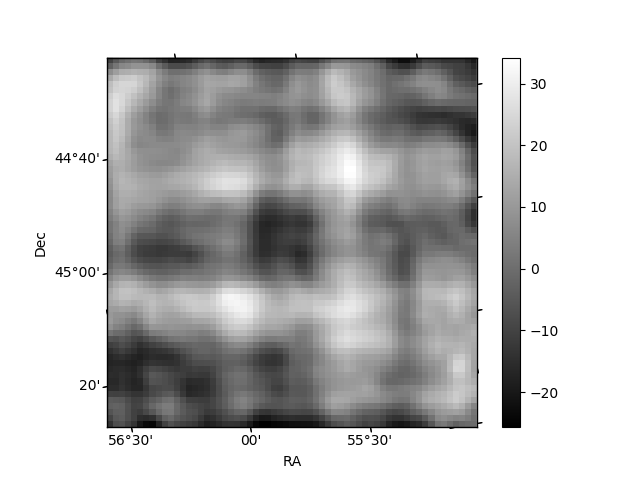
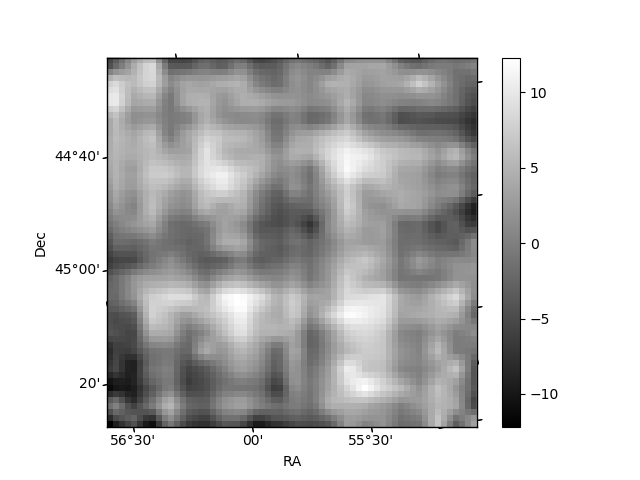
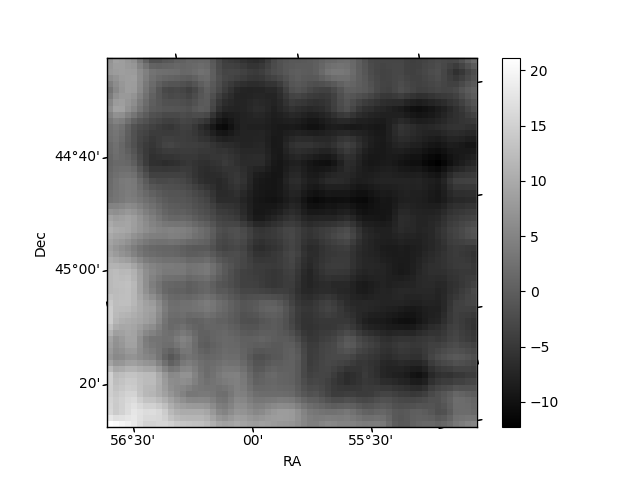
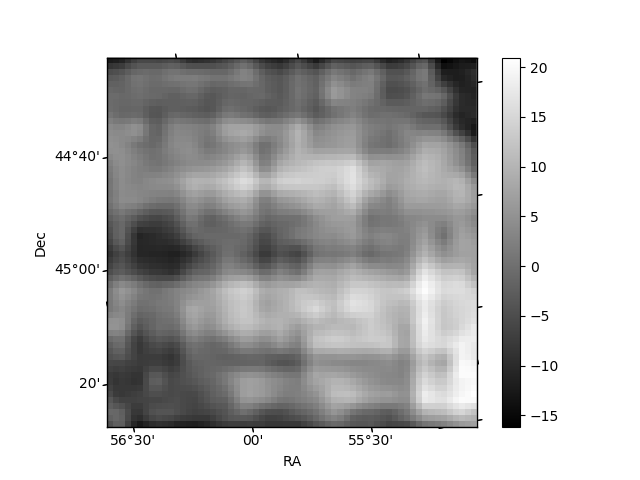
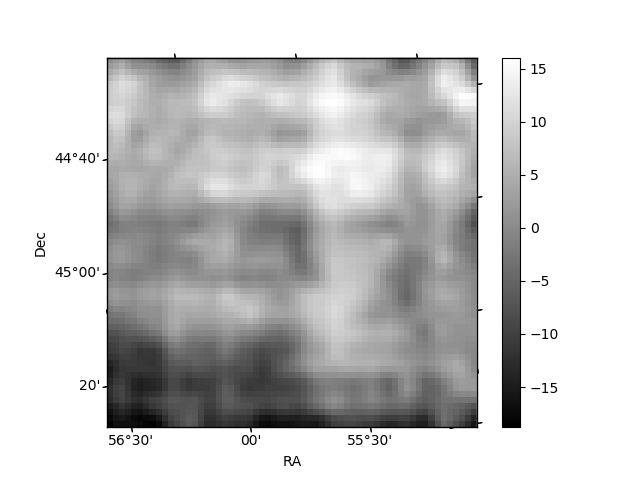
Histogram calculated using DETX and DETY for each event in the final _common_clean file
| Quadrant A | 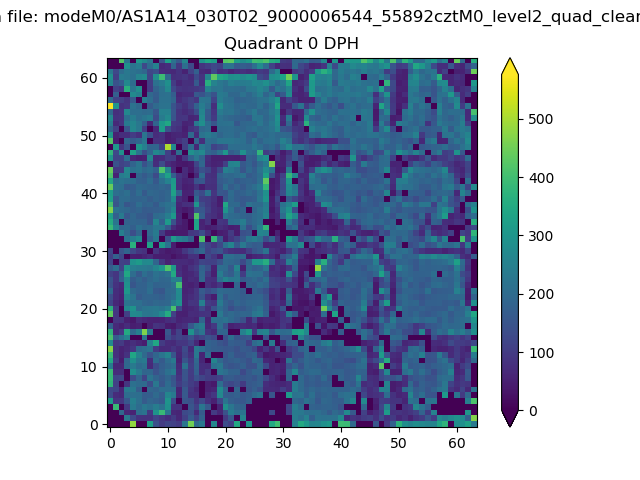 |
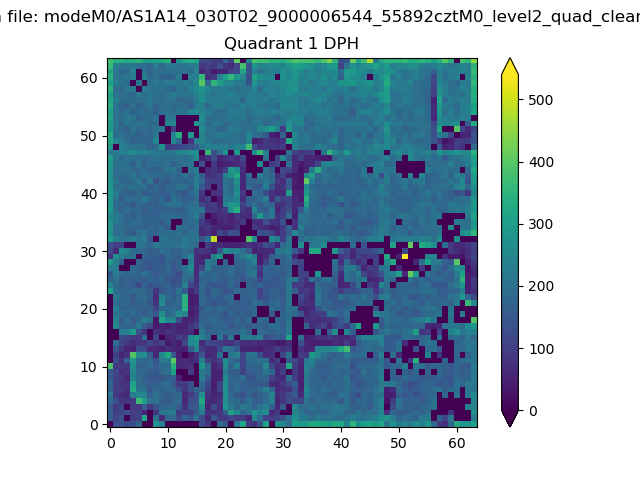 |
Quadrant B |
|---|---|---|---|
| Quadrant D | 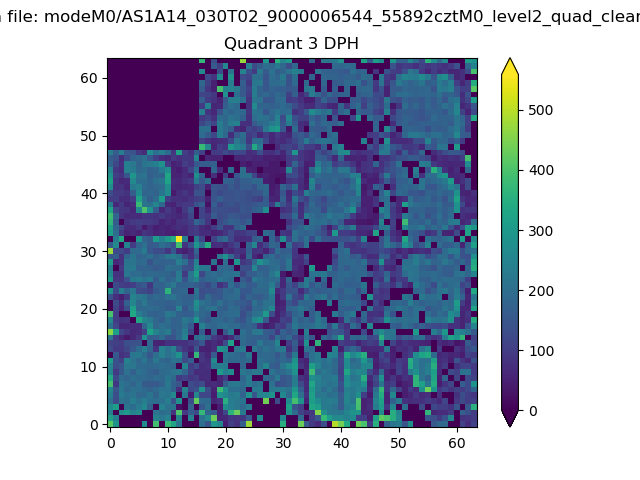 |
 |
Quadrant C |
| Plot type | Count rate plots | Images |
|---|---|---|
| Comparison with Poisson distribution Blue bars denote a histogram of data divided into 1 sec bins. Red curve is a Poisson curve with rate = median count rate of data. |
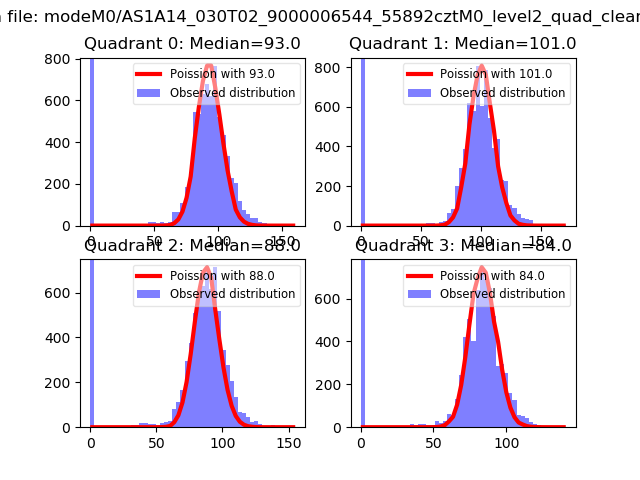 |
 |
| Quadrant-wise count rates Data is divided into 100 sec bins |
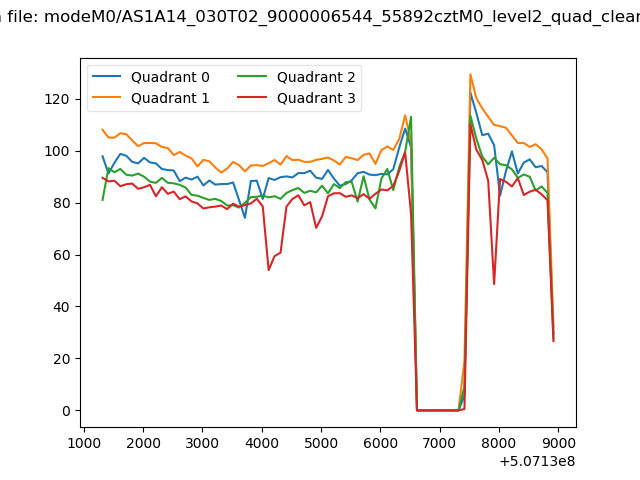 |
|
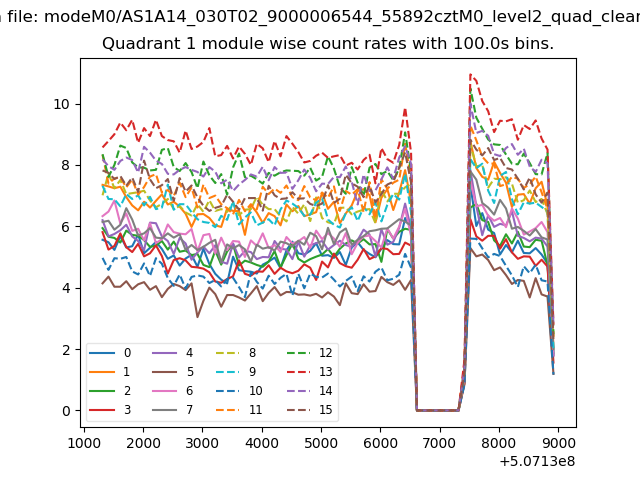
| Module-wise count rates for Quadrant A Data is divided into 100 sec bins |
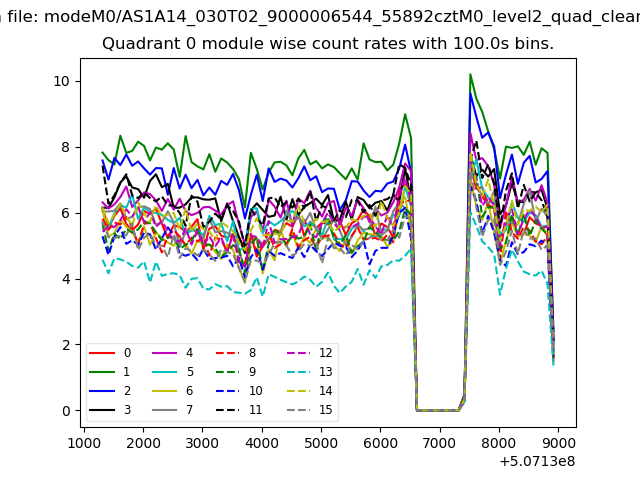 |
 |
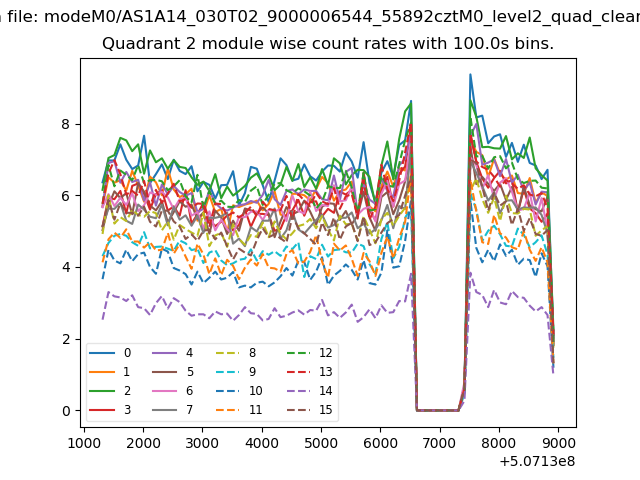
| Module-wise count rates for Quadrant B Data is divided into 100 sec bins |
 |
 |
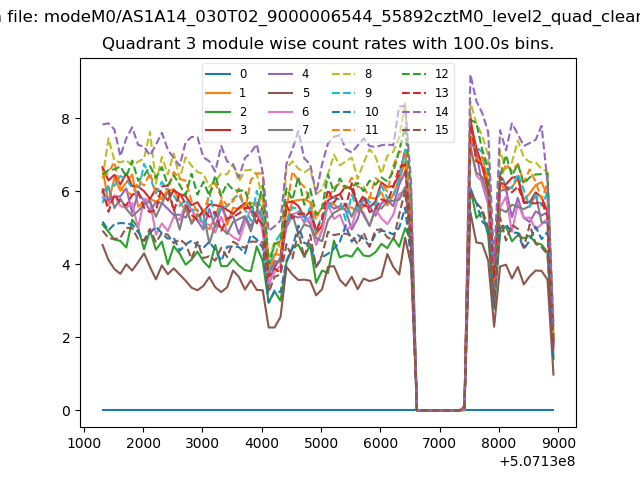
| Module-wise count rates for Quadrant C Data is divided into 100 sec bins |
 |
 |
| Module-wise count rates for Quadrant D Data is divided into 100 sec bins |
 |
 |
| Parameter | Plot |
|---|---|
| CZT HV Monitor | 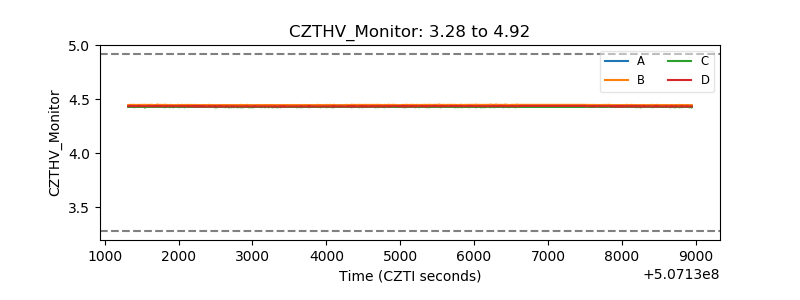 |
| D_VDD | 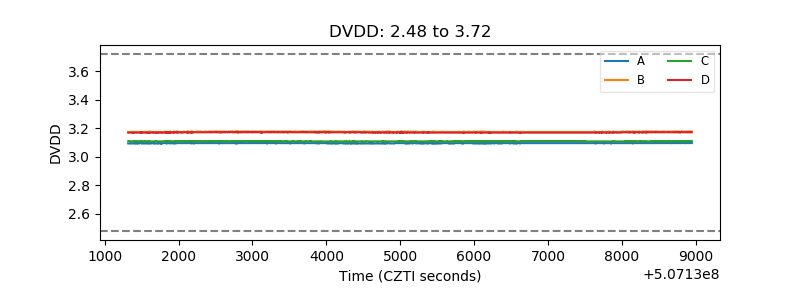 |
| Temperature 1 | 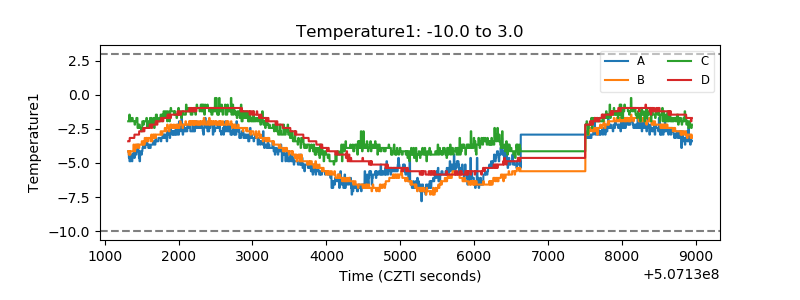 |
| Veto HV Monitor | 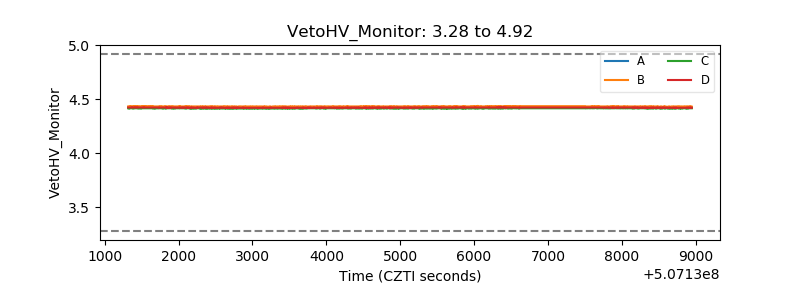 |
| Veto LLD | 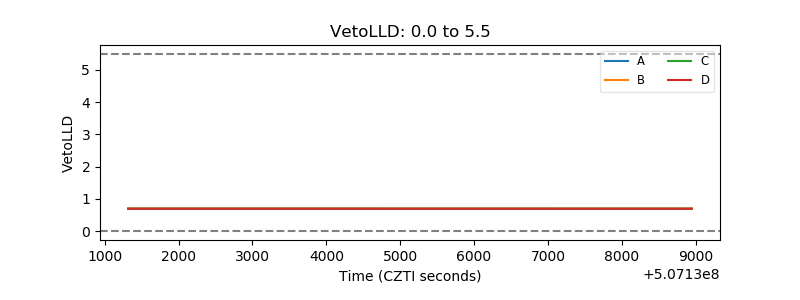 |
| Alpha Counter | 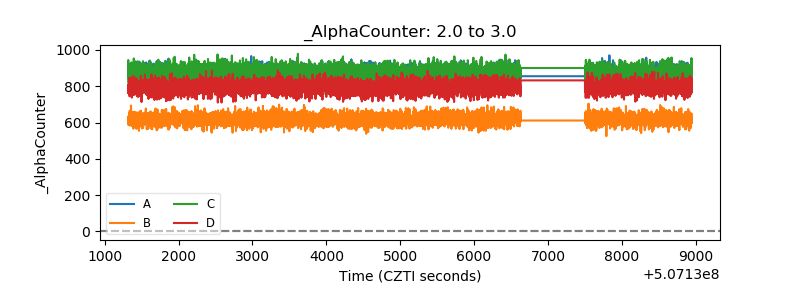 |
| _CPM_Rate | 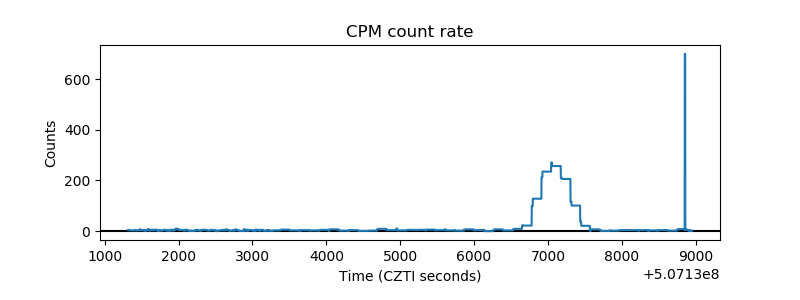 |
| CZT Counter | 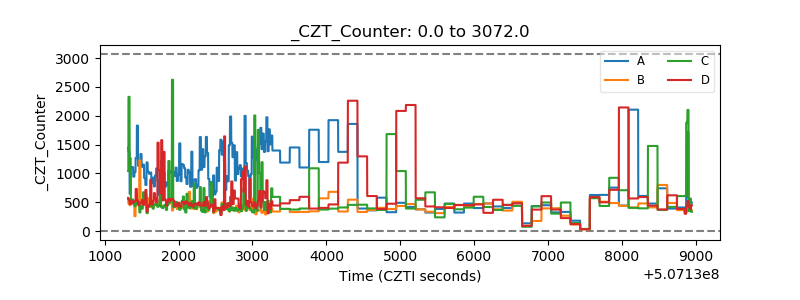 |
| +2.5 Volts monitor |  |
| +5 Volts monitor |  |
| _ROLL_ROT | 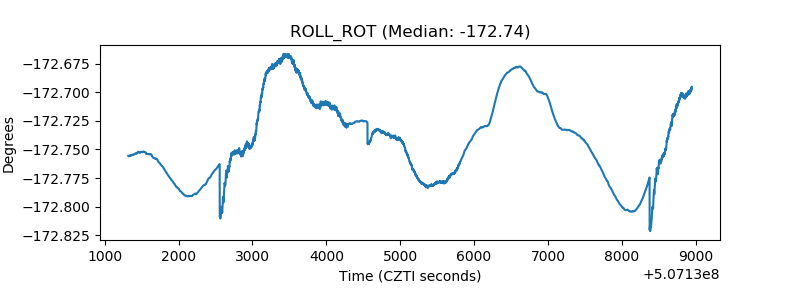 |
| _Roll_DEC | 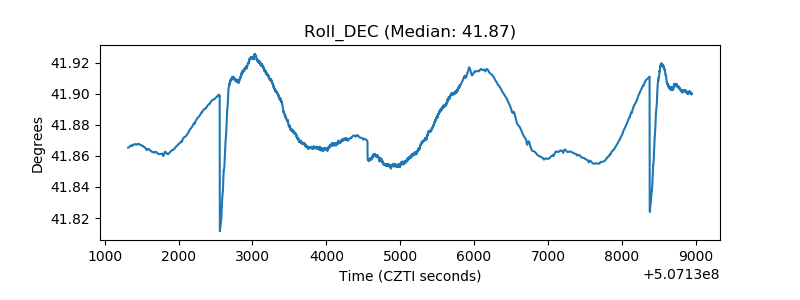 |
| _Roll_RA | 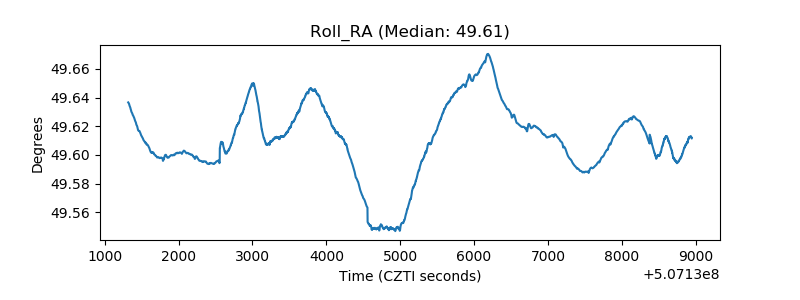 |
| Veto Counter | 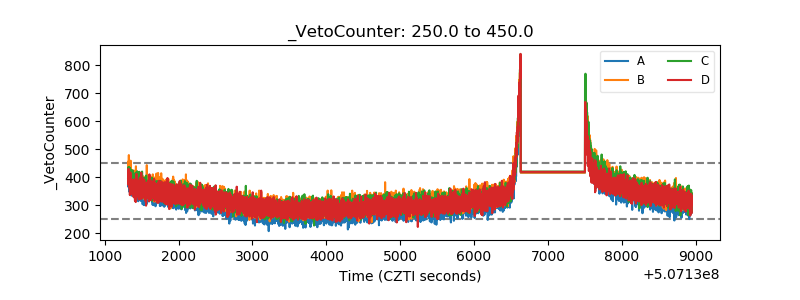 |