| Param | Original file | Final file |
|---|---|---|
| Filename | modeM0/AS1A14_030T02_9000006544_55894cztM0_level2.fits | modeM0/AS1A14_030T02_9000006544_55894cztM0_level2_quad_clean.evt |
| Size (bytes) | 425,384,640 | 96,840,000 |
| Size | 405.7 MB | 92.4 MB |
| Events in quadrant A | 3,493,299 | 634,742 |
| Events in quadrant B | 3,390,434 | 678,913 |
| Events in quadrant C | 3,605,604 | 597,630 |
| Events in quadrant D | 4,739,041 | 557,030 |
| Mode SS | |||
|---|---|---|---|
| Quadrant | BADHDUFLAG | Total packets | Discarded packets |
| A | 0 | 134 | 0 |
| B | 0 | 134 | 0 |
| C | 0 | 134 | 0 |
| D | 0 | 134 | 0 |
| Mode M9 | |||
|---|---|---|---|
| Quadrant | BADHDUFLAG | Total packets | Discarded packets |
| A | 0 | 11 | 0 |
| B | 0 | 11 | 0 |
| C | 0 | 11 | 0 |
| D | 0 | 11 | 0 |
| Mode M0 | |||
|---|---|---|---|
| Quadrant | BADHDUFLAG | Total packets | Discarded packets |
| A | 0 | 15273 | 2 |
| B | 0 | 15061 | 2 |
| C | 0 | 15785 | 2 |
| D | 0 | 18732 | 3 |
| Quadrant | Total seconds | Saturated seconds | Saturation percentage |
|---|---|---|---|
| A | 6656 | 125 | 1.878005% |
| B | 6656 | 130 | 1.953125% |
| C | 6657 | 192 | 2.884182% |
| D | 6656 | 391 | 5.874399% |
Noise dominated data is calculated using 1-second bins in cleaned event files. If a bin has >2000 counts, and if more than 50% of those come from <1% of pixels, then it is considered to be noise-dominated and hence unusable.
| Quadrant | # 1 sec bins | Bins with >0 counts | Bins with >2000 counts | High rate bins dominated by noise | Noise dominated (total time) | Noise dominated (detector-on time) | Marked lightcurve |
|---|---|---|---|---|---|---|---|
| A | 7696 | 6657 | 76 | 76 | 0.99% | 1.14% | 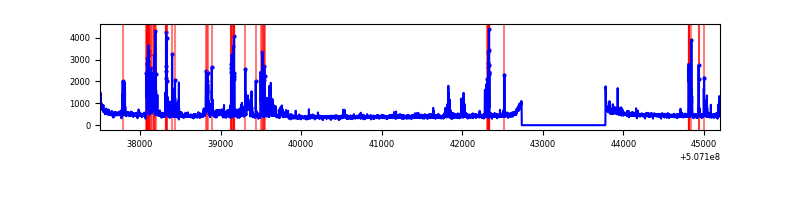 |
| B | 7696 | 6657 | 70 | 70 | 0.91% | 1.05% | 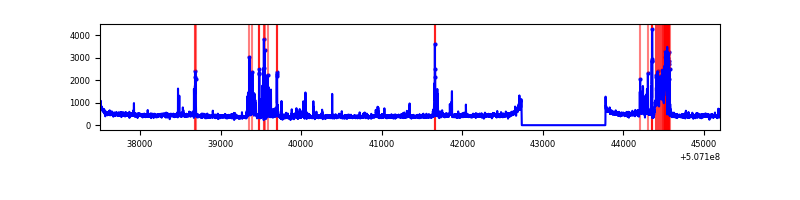 |
| C | 7697 | 6658 | 115 | 115 | 1.49% | 1.73% | 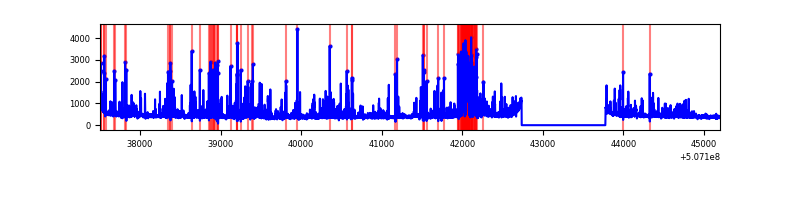 |
| D | 7696 | 6657 | 342 | 342 | 4.44% | 5.14% | 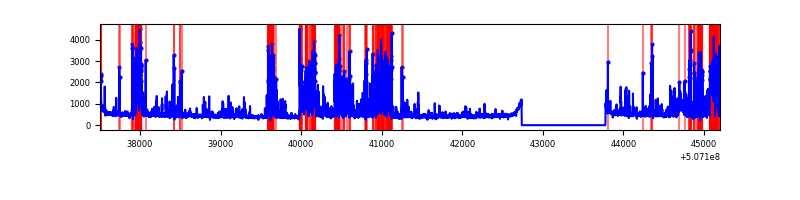 |
Top three noisy pixels from each quadrant. If the there are fewer than three noisy pixels in the level2.evt file, extra rows are filled as -1
| Pixel properties | Quadrant properties | ||||||
|---|---|---|---|---|---|---|---|
| Quadrant | DetID | PixID | Counts | Sigma | Mean | Median | Sigma |
| A | 15 | 32 | 439232 | 2525.72 | 699 | 680 | 173.6 |
| A | 0 | 8 | 96157 | 549.87 | 699 | 680 | 173.6 |
| A | 3 | 14 | 65644 | 374.14 | 699 | 680 | 173.6 |
| B | 0 | 153 | 396098 | 2669.27 | 690 | 664 | 148.1 |
| B | 0 | 199 | 92996 | 623.26 | 690 | 664 | 148.1 |
| B | 0 | 143 | 56288 | 375.47 | 690 | 664 | 148.1 |
| C | 12 | 252 | 614616 | 3314.2 | 676 | 669 | 185.2 |
| C | 15 | 199 | 272704 | 1468.5 | 676 | 669 | 185.2 |
| C | 6 | 223 | 18508 | 96.3 | 676 | 669 | 185.2 |
| D | 11 | 129 | 655716 | 3493.8 | 670 | 644 | 187.5 |
| D | 3 | 12 | 315808 | 1680.91 | 670 | 644 | 187.5 |
| D | 2 | 31 | 289929 | 1542.89 | 670 | 644 | 187.5 |
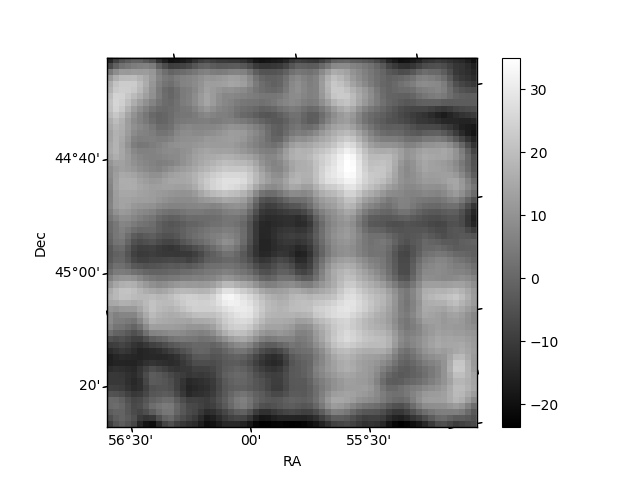
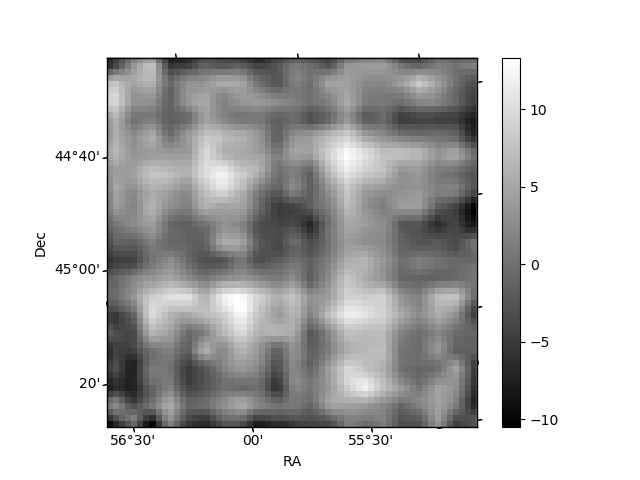
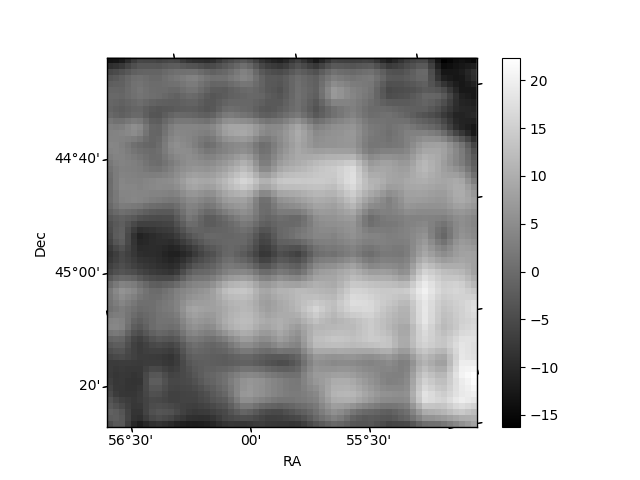
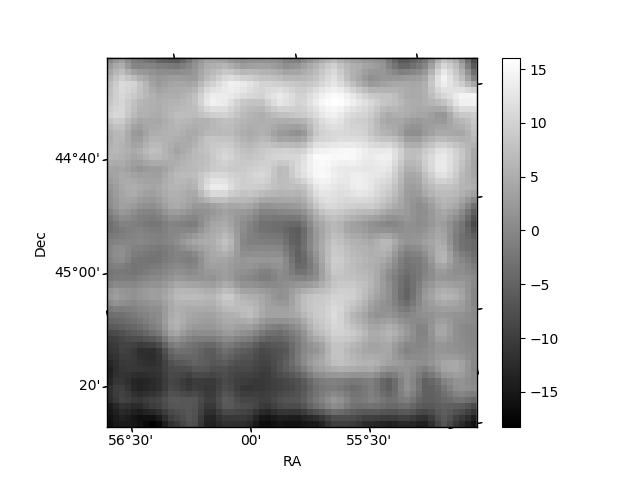
Histogram calculated using DETX and DETY for each event in the final _common_clean file
| Quadrant A | 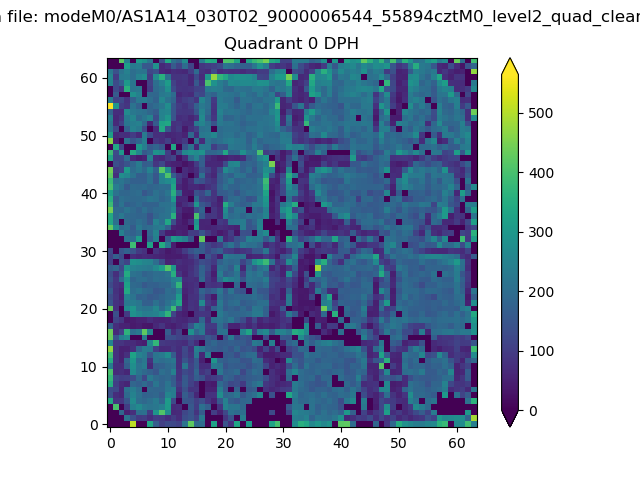 |
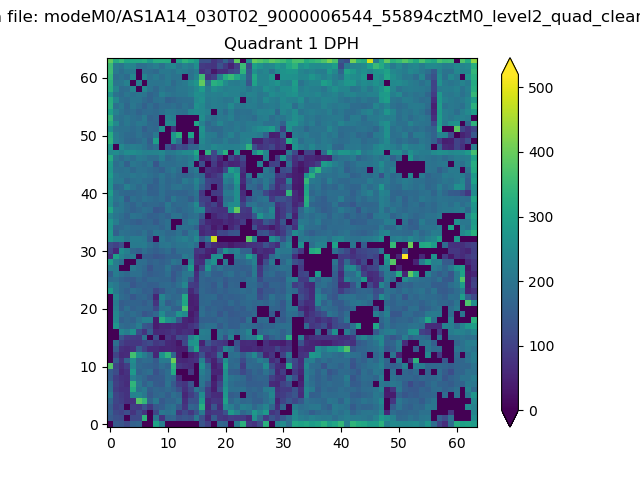 |
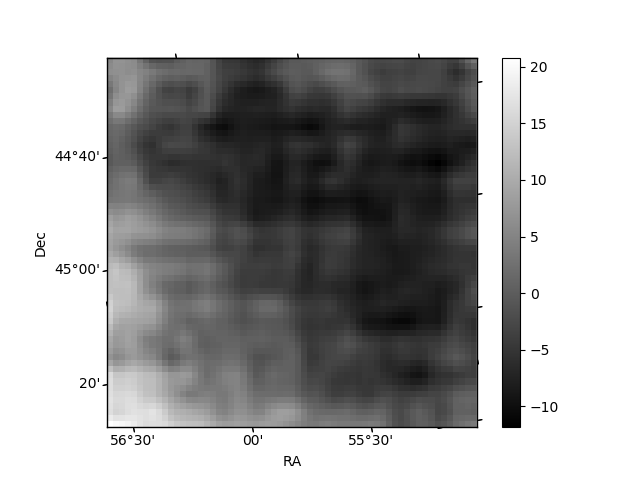
Quadrant B |
|---|---|---|---|
| Quadrant D | 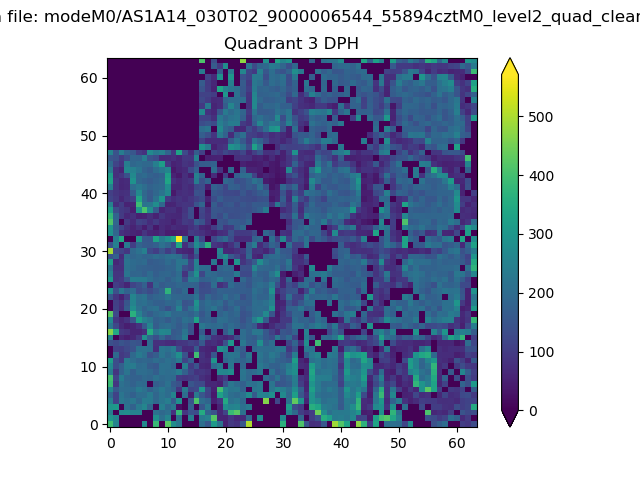 |
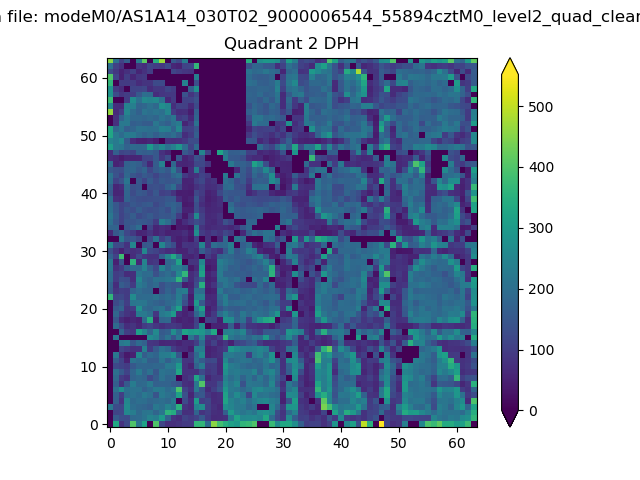 |
Quadrant C |
| Plot type | Count rate plots | Images |
|---|---|---|
| Comparison with Poisson distribution Blue bars denote a histogram of data divided into 1 sec bins. Red curve is a Poisson curve with rate = median count rate of data. |
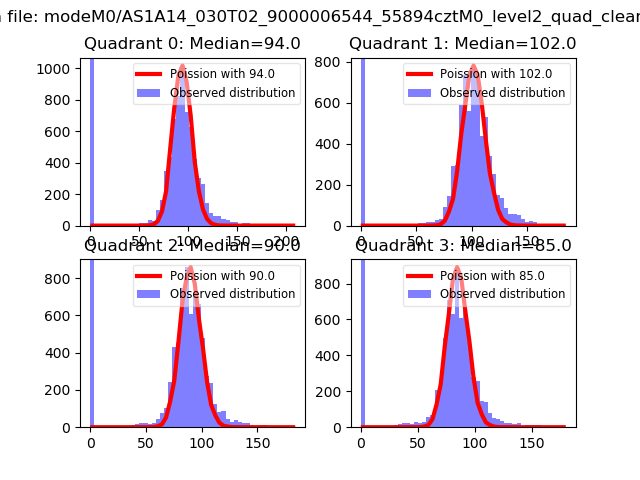 |
 |
| Quadrant-wise count rates Data is divided into 100 sec bins |
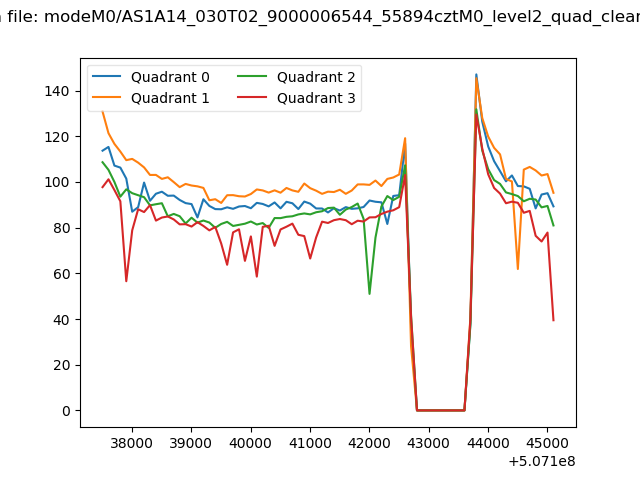 |
|
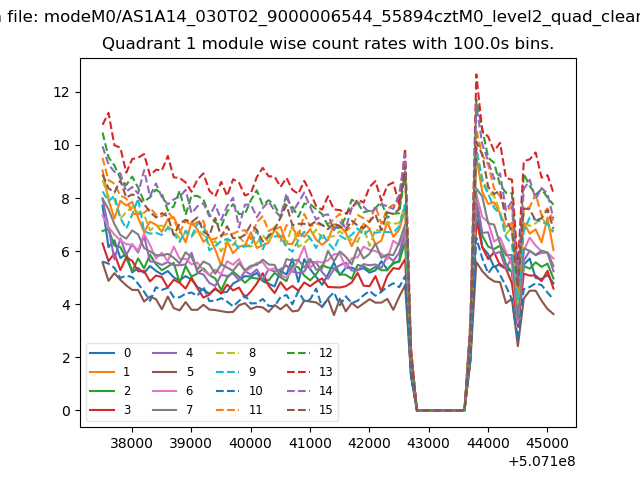
| Module-wise count rates for Quadrant A Data is divided into 100 sec bins |
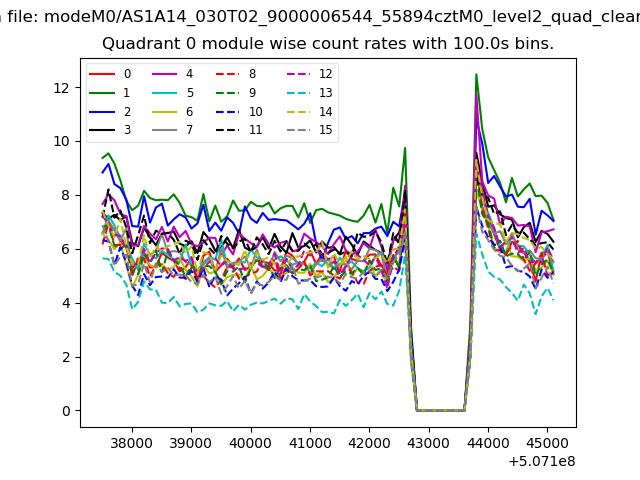 |
 |
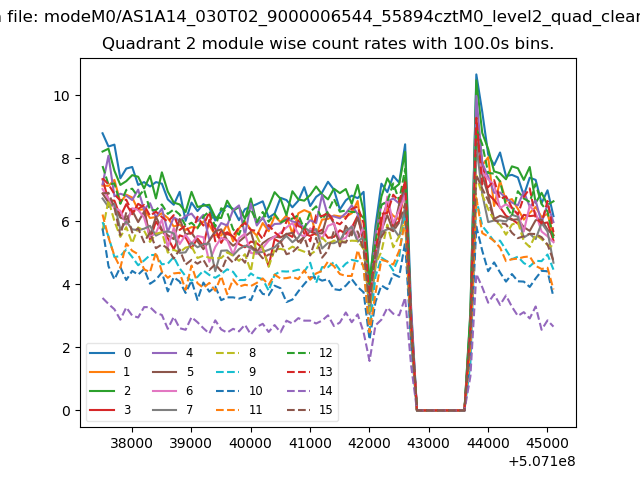
| Module-wise count rates for Quadrant B Data is divided into 100 sec bins |
 |
 |
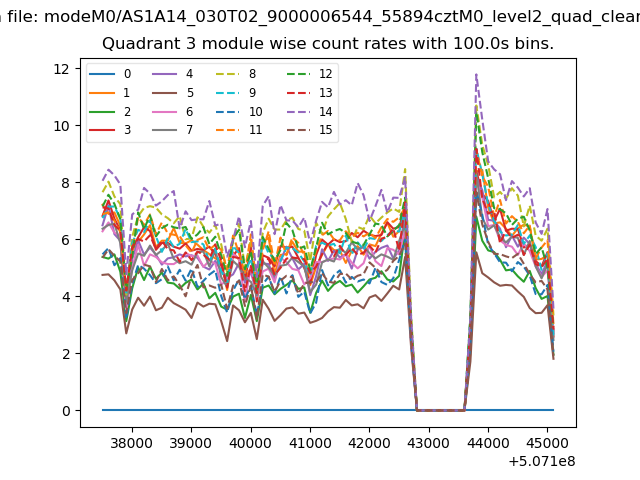
| Module-wise count rates for Quadrant C Data is divided into 100 sec bins |
 |
 |
| Module-wise count rates for Quadrant D Data is divided into 100 sec bins |
 |
 |
| Parameter | Plot |
|---|---|
| CZT HV Monitor | 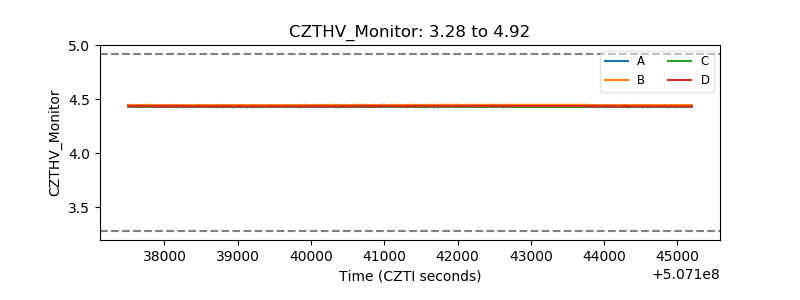 |
| D_VDD | 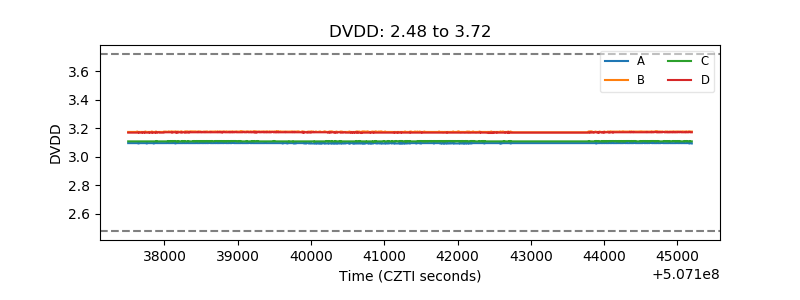 |
| Temperature 1 | 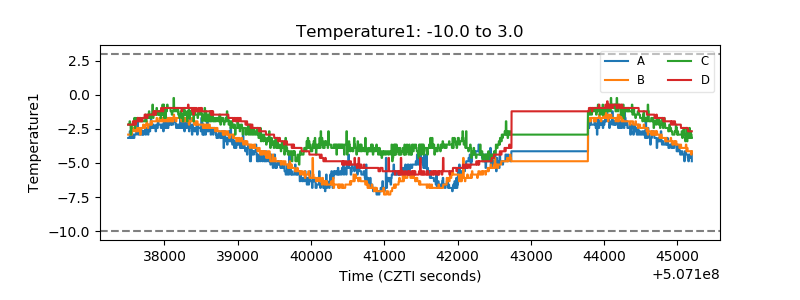 |
| Veto HV Monitor |  |
| Veto LLD | 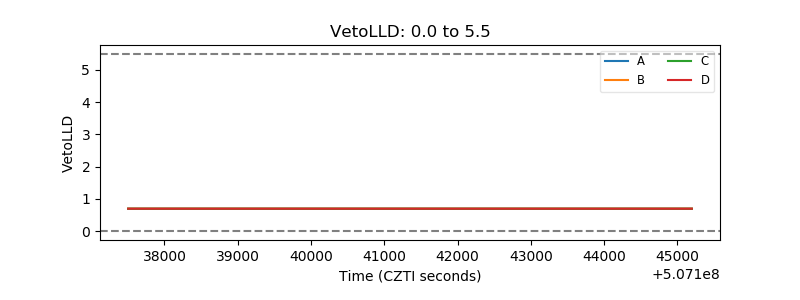 |
| Alpha Counter | 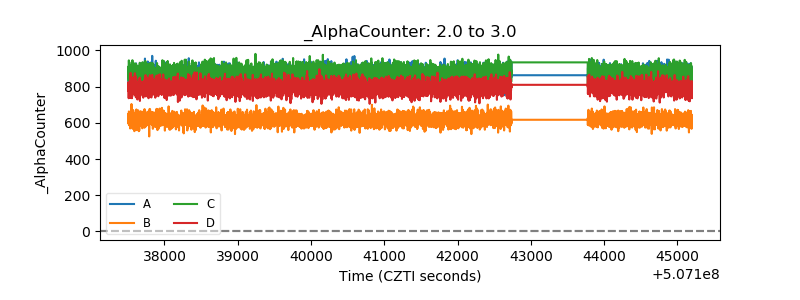 |
| _CPM_Rate | 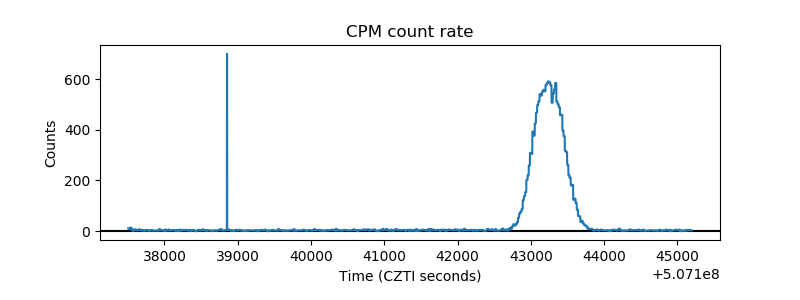 |
| CZT Counter | 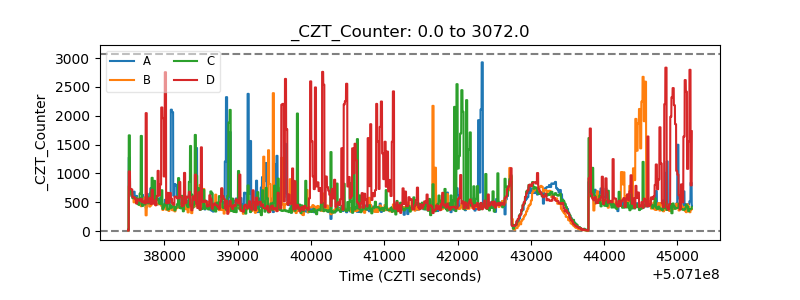 |
| +2.5 Volts monitor |  |
| +5 Volts monitor |  |
| _ROLL_ROT | 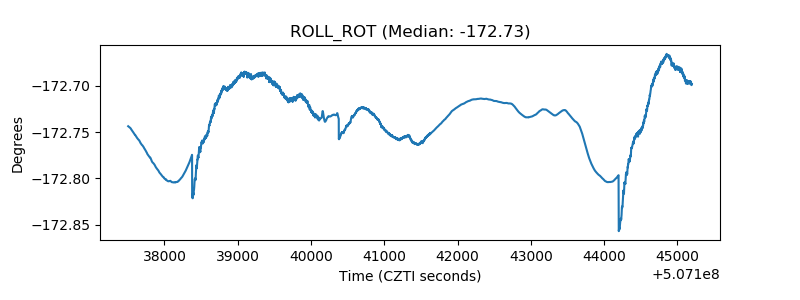 |
| _Roll_DEC | 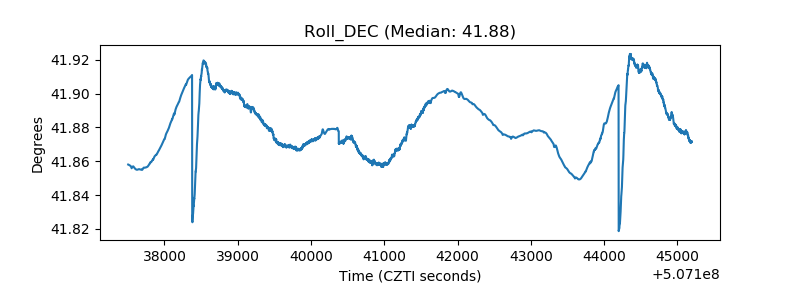 |
| _Roll_RA | 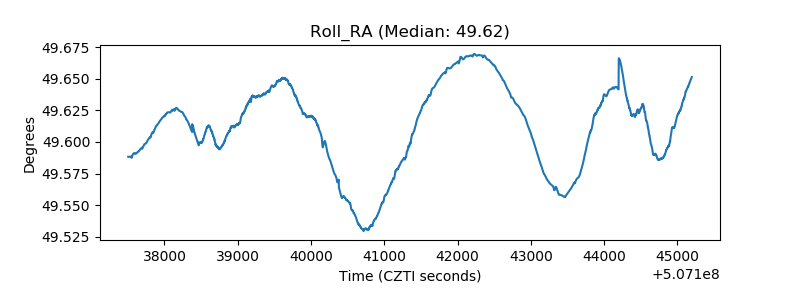 |
| Veto Counter | 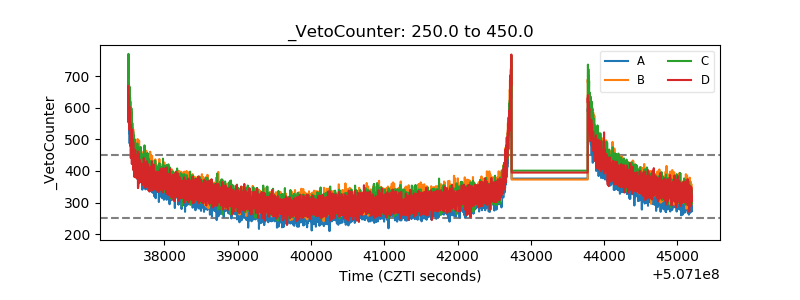 |