| Param | Original file | Final file |
|---|---|---|
| Filename | modeM0/AS1A14_030T02_9000006544_55896cztM0_level2.fits | modeM0/AS1A14_030T02_9000006544_55896cztM0_level2_quad_clean.evt |
| Size (bytes) | 369,072,000 | 95,889,600 |
| Size | 352.0 MB | 91.4 MB |
| Events in quadrant A | 3,438,652 | 624,333 |
| Events in quadrant B | 2,928,675 | 677,072 |
| Events in quadrant C | 3,258,533 | 597,957 |
| Events in quadrant D | 3,539,033 | 559,028 |
| Mode SS | |||
|---|---|---|---|
| Quadrant | BADHDUFLAG | Total packets | Discarded packets |
| A | 0 | 130 | 0 |
| B | 0 | 130 | 0 |
| C | 0 | 130 | 0 |
| D | 0 | 130 | 0 |
| Mode M9 | |||
|---|---|---|---|
| Quadrant | BADHDUFLAG | Total packets | Discarded packets |
| A | 0 | 19 | 0 |
| B | 0 | 20 | 0 |
| C | 0 | 20 | 0 |
| D | 0 | 20 | 0 |
| Mode M0 | |||
|---|---|---|---|
| Quadrant | BADHDUFLAG | Total packets | Discarded packets |
| A | 0 | 14829 | 2 |
| B | 0 | 13455 | 2 |
| C | 0 | 14499 | 2 |
| D | 0 | 14962 | 2 |
| Quadrant | Total seconds | Saturated seconds | Saturation percentage |
|---|---|---|---|
| A | 6382 | 58 | 0.908806% |
| B | 6382 | 58 | 0.908806% |
| C | 6382 | 114 | 1.786274% |
| D | 6382 | 126 | 1.974303% |
Noise dominated data is calculated using 1-second bins in cleaned event files. If a bin has >2000 counts, and if more than 50% of those come from <1% of pixels, then it is considered to be noise-dominated and hence unusable.
| Quadrant | # 1 sec bins | Bins with >0 counts | Bins with >2000 counts | High rate bins dominated by noise | Noise dominated (total time) | Noise dominated (detector-on time) | Marked lightcurve |
|---|---|---|---|---|---|---|---|
| A | 7572 | 6383 | 18 | 18 | 0.24% | 0.28% | 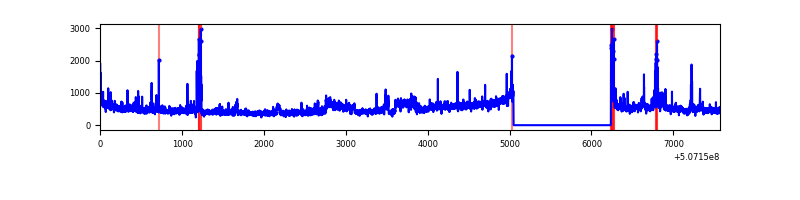 |
| B | 7572 | 6383 | 18 | 18 | 0.24% | 0.28% | 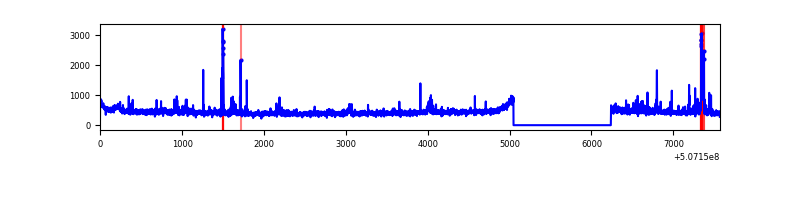 |
| C | 7572 | 6383 | 61 | 61 | 0.81% | 0.96% |  |
| D | 7572 | 6383 | 104 | 104 | 1.37% | 1.63% | 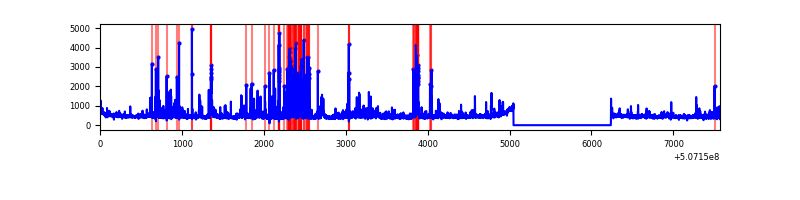 |
Top three noisy pixels from each quadrant. If the there are fewer than three noisy pixels in the level2.evt file, extra rows are filled as -1
| Pixel properties | Quadrant properties | ||||||
|---|---|---|---|---|---|---|---|
| Quadrant | DetID | PixID | Counts | Sigma | Mean | Median | Sigma |
| A | 3 | 14 | 500563 | 2974.31 | 674 | 655 | 168.1 |
| A | 15 | 32 | 154177 | 913.41 | 674 | 655 | 168.1 |
| A | 12 | 115 | 58693 | 345.31 | 674 | 655 | 168.1 |
| B | 7 | 252 | 101004 | 701.29 | 672 | 647 | 143.1 |
| B | 0 | 199 | 63054 | 436.1 | 672 | 647 | 143.1 |
| B | 10 | 247 | 31387 | 214.81 | 672 | 647 | 143.1 |
| C | 12 | 252 | 469901 | 2573.84 | 662 | 654 | 182.3 |
| C | 13 | 3 | 132678 | 724.16 | 662 | 654 | 182.3 |
| C | 15 | 199 | 35512 | 191.2 | 662 | 654 | 182.3 |
| D | 2 | 31 | 312137 | 1699.43 | 656 | 628 | 183.3 |
| D | 11 | 129 | 157366 | 855.08 | 656 | 628 | 183.3 |
| D | 3 | 12 | 143311 | 778.4 | 656 | 628 | 183.3 |
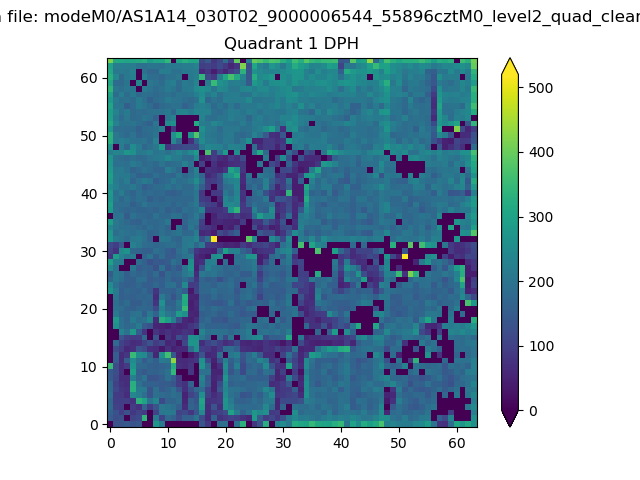
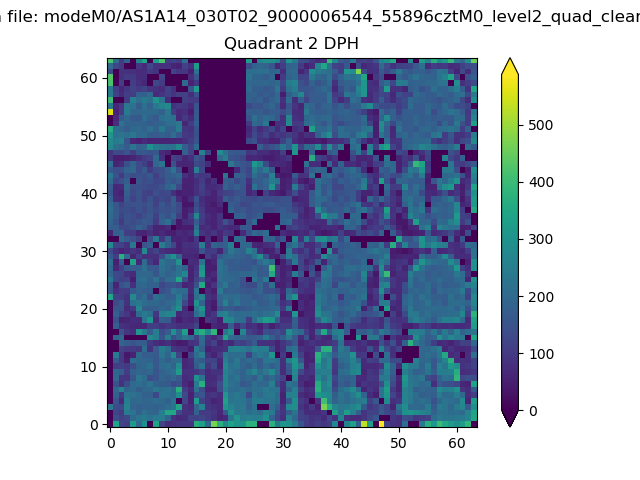
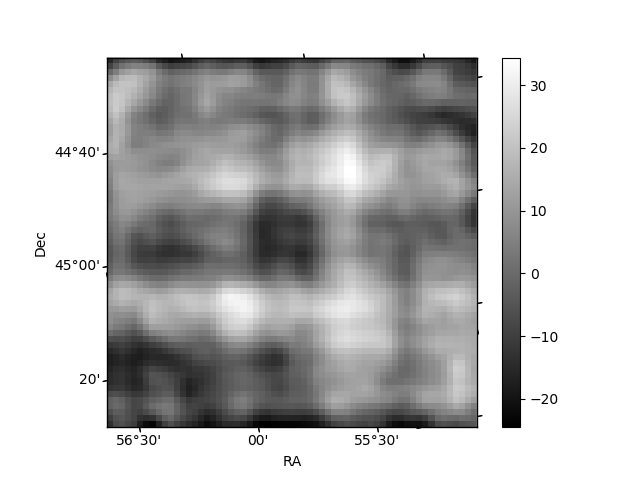
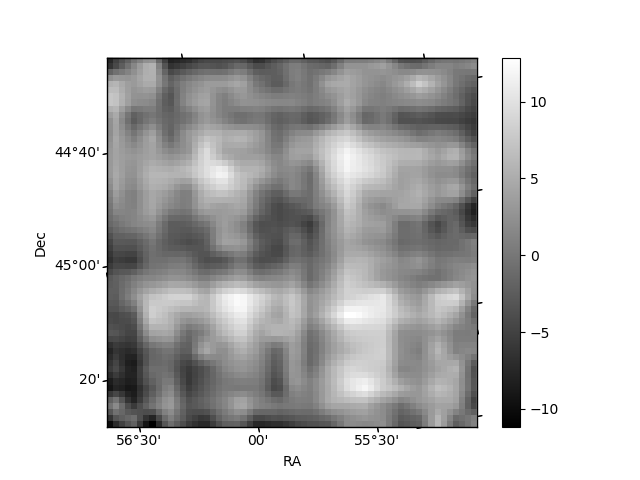
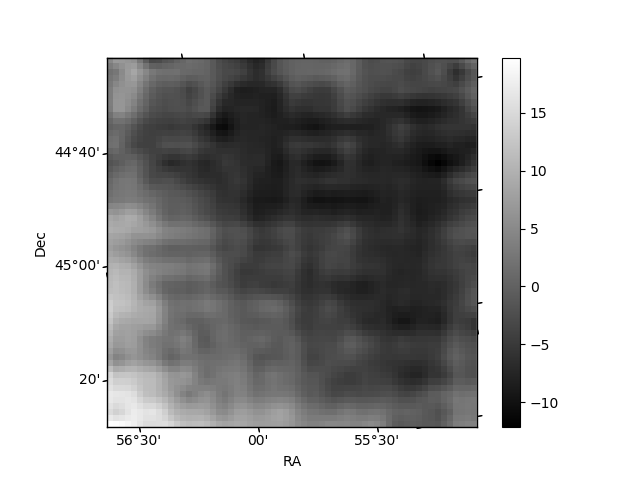
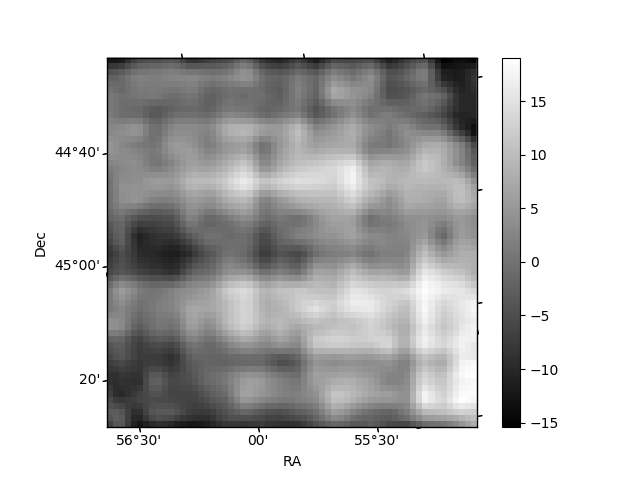
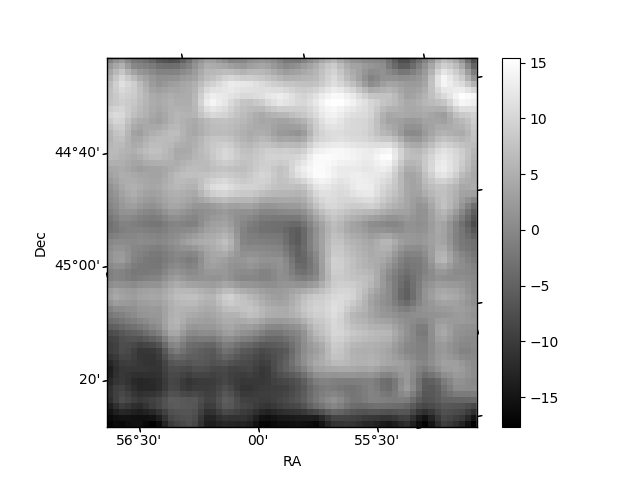
Histogram calculated using DETX and DETY for each event in the final _common_clean file
| Quadrant A | 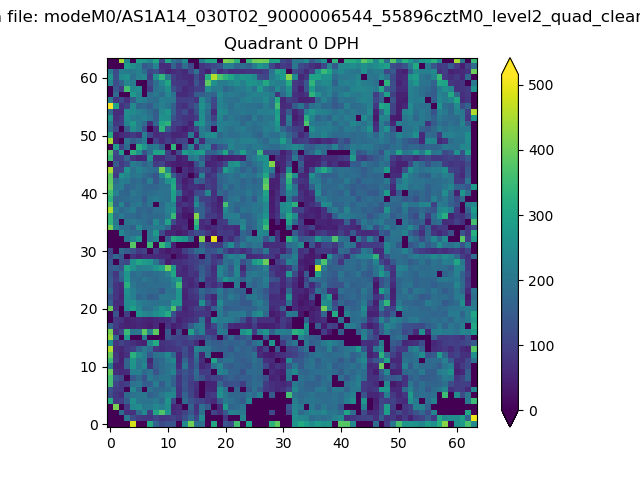 |
 |
Quadrant B |
|---|---|---|---|
| Quadrant D | 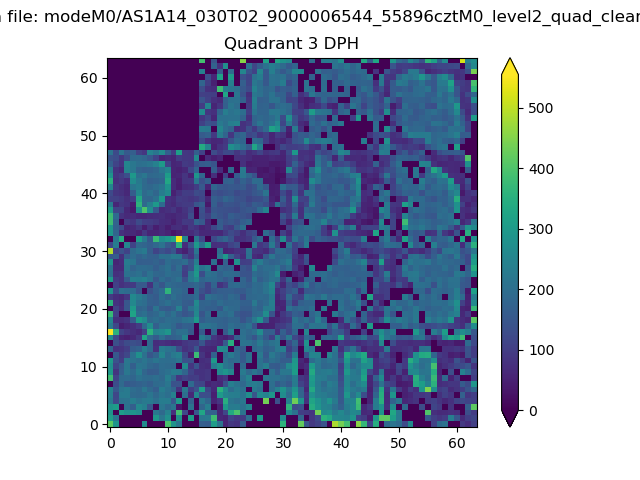 |
 |
Quadrant C |
| Plot type | Count rate plots | Images |
|---|---|---|
| Comparison with Poisson distribution Blue bars denote a histogram of data divided into 1 sec bins. Red curve is a Poisson curve with rate = median count rate of data. |
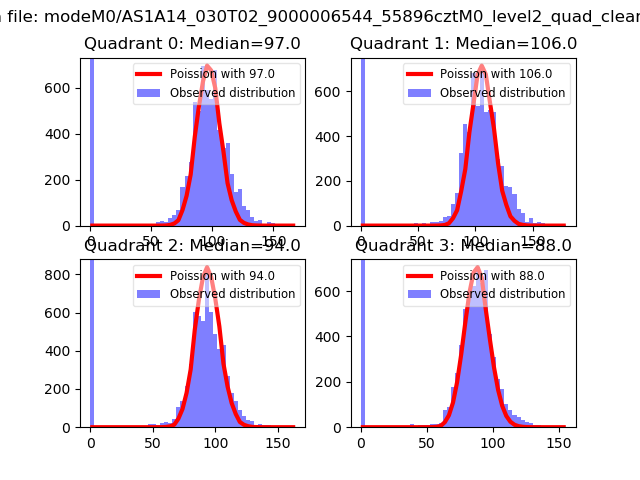 |
 |
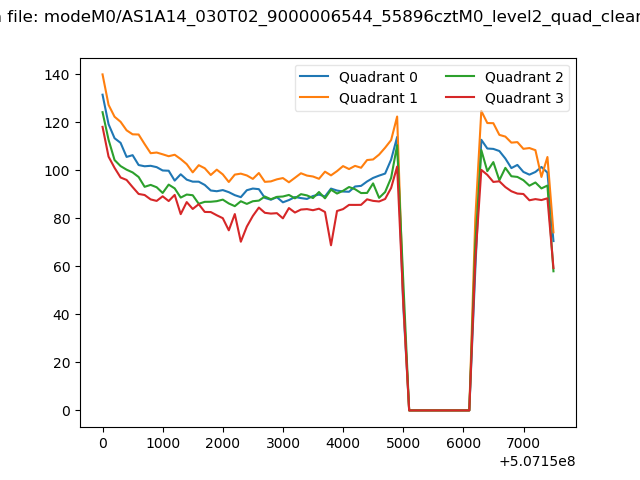
| Quadrant-wise count rates Data is divided into 100 sec bins |
 |
|
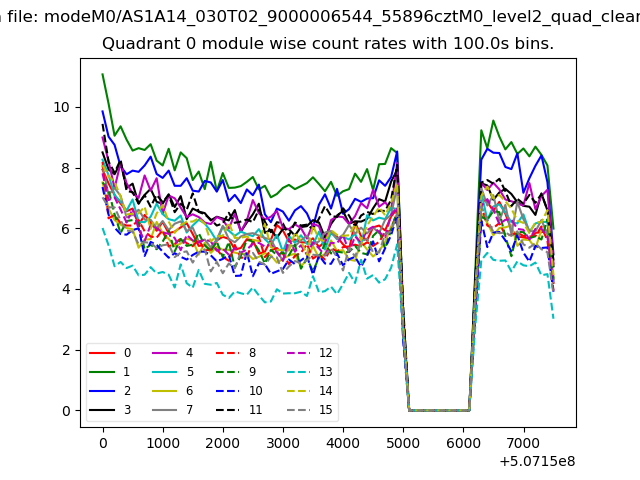
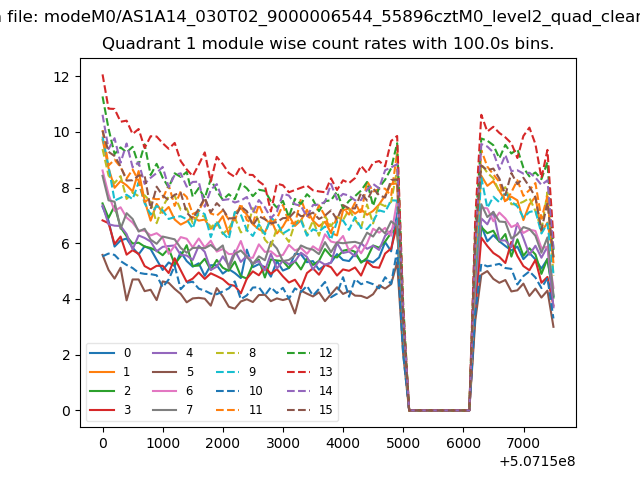
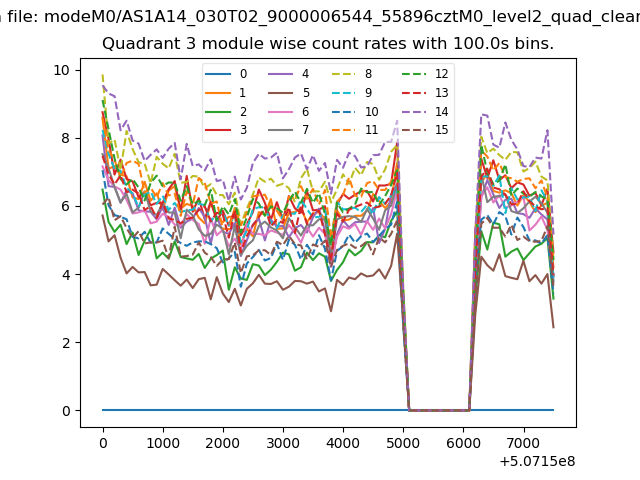
| Module-wise count rates for Quadrant A Data is divided into 100 sec bins |
 |
 |
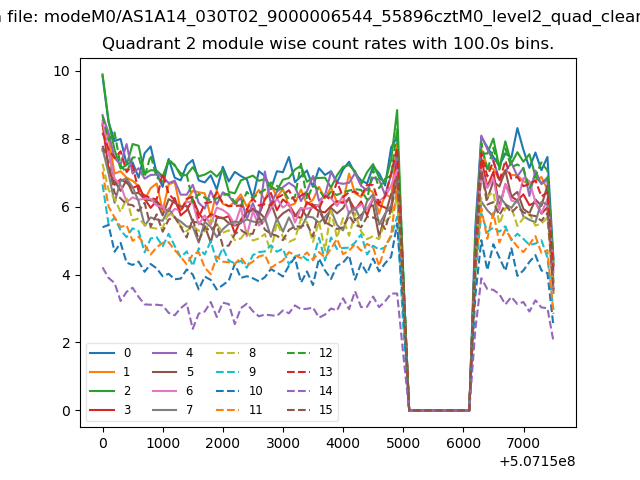
| Module-wise count rates for Quadrant B Data is divided into 100 sec bins |
 |
 |
| Module-wise count rates for Quadrant C Data is divided into 100 sec bins |
 |
 |
| Module-wise count rates for Quadrant D Data is divided into 100 sec bins |
 |
 |
| Parameter | Plot |
|---|---|
| CZT HV Monitor | 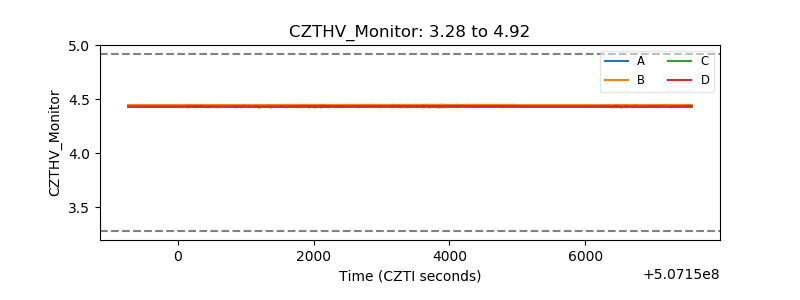 |
| D_VDD | 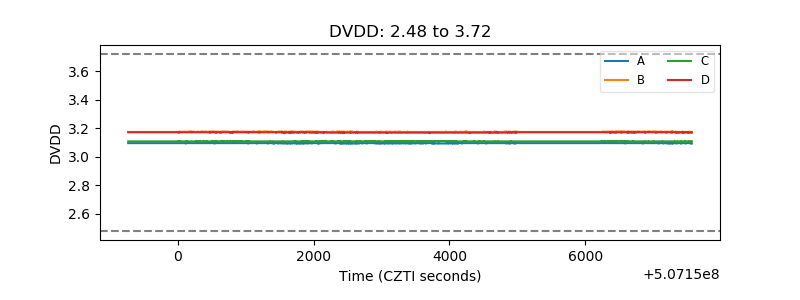 |
| Temperature 1 | 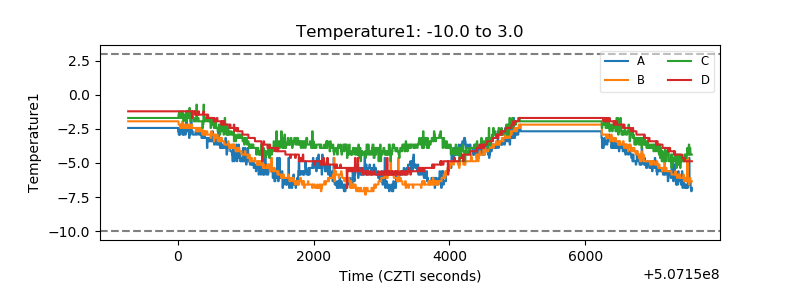 |
| Veto HV Monitor | 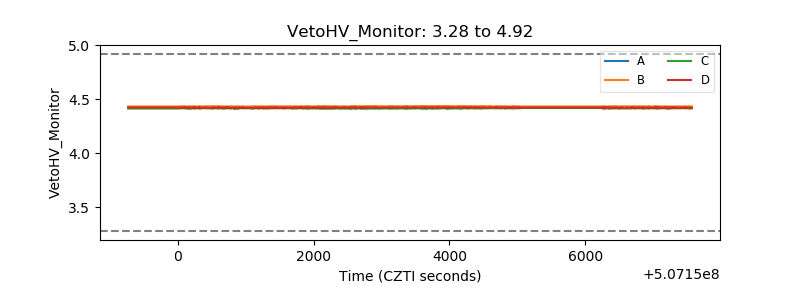 |
| Veto LLD | 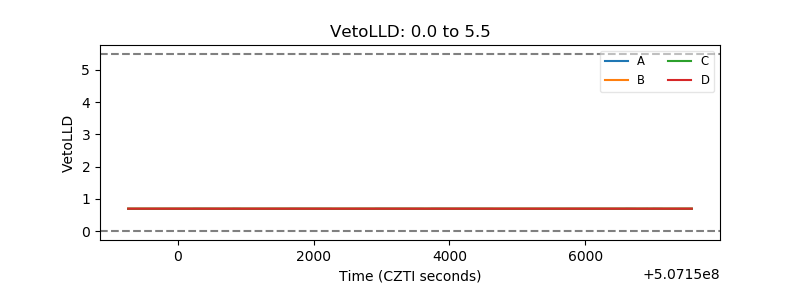 |
| Alpha Counter | 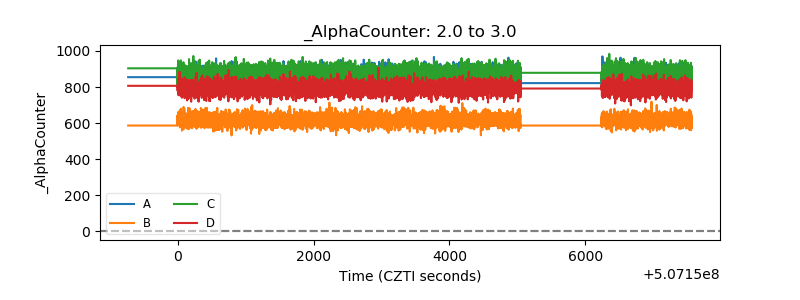 |
| _CPM_Rate | 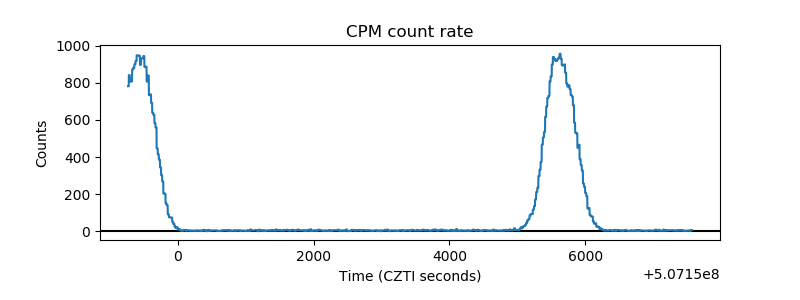 |
| CZT Counter | 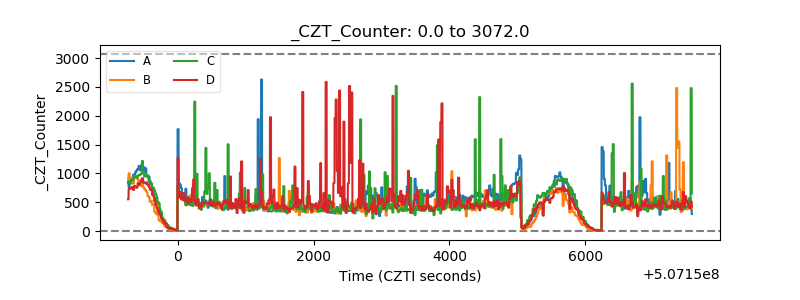 |
| +2.5 Volts monitor |  |
| +5 Volts monitor |  |
| _ROLL_ROT | 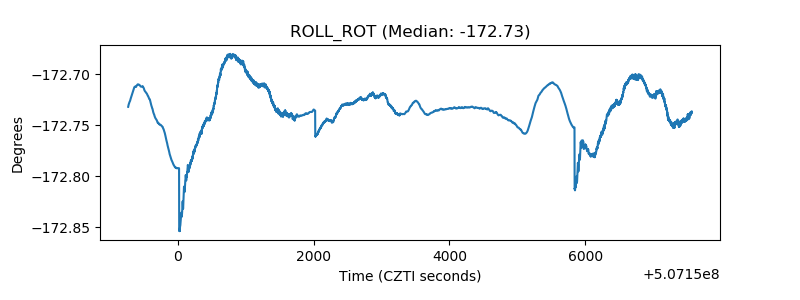 |
| _Roll_DEC | 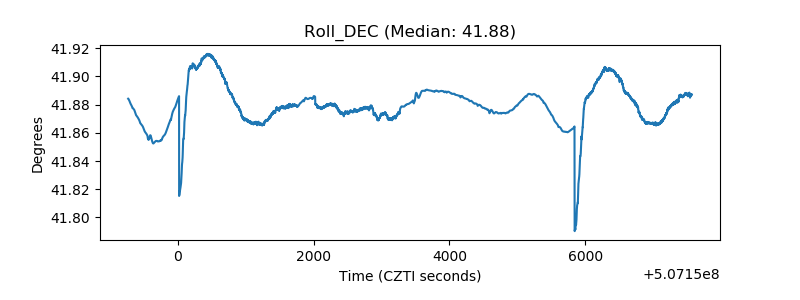 |
| _Roll_RA | 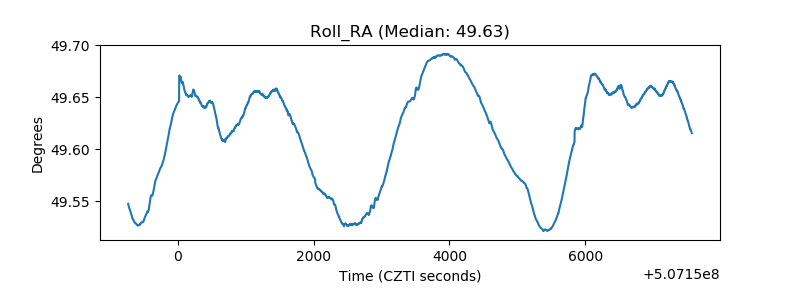 |
| Veto Counter | 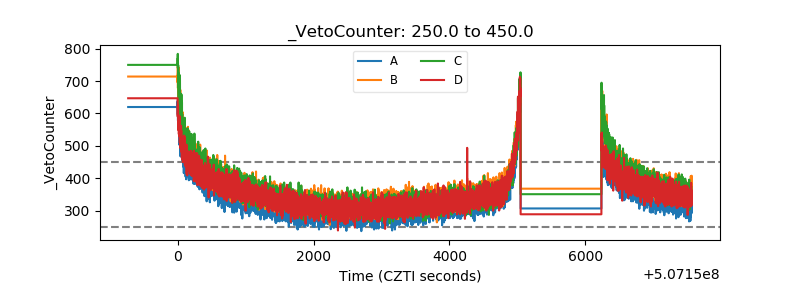 |