| Param | Original file | Final file |
|---|---|---|
| Filename | modeM0/AS1A14_030T02_9000006544_55897cztM0_level2.fits | modeM0/AS1A14_030T02_9000006544_55897cztM0_level2_quad_clean.evt |
| Size (bytes) | 395,124,480 | 95,094,720 |
| Size | 376.8 MB | 90.7 MB |
| Events in quadrant A | 3,508,180 | 619,637 |
| Events in quadrant B | 3,013,470 | 671,224 |
| Events in quadrant C | 3,256,068 | 593,908 |
| Events in quadrant D | 4,349,319 | 546,793 |
| Mode SS | |||
|---|---|---|---|
| Quadrant | BADHDUFLAG | Total packets | Discarded packets |
| A | 0 | 132 | 0 |
| B | 0 | 132 | 0 |
| C | 0 | 132 | 0 |
| D | 0 | 132 | 0 |
| Mode M9 | |||
|---|---|---|---|
| Quadrant | BADHDUFLAG | Total packets | Discarded packets |
| A | 0 | 14 | 0 |
| B | 0 | 14 | 0 |
| C | 0 | 15 | 0 |
| D | 0 | 15 | 0 |
| Mode M0 | |||
|---|---|---|---|
| Quadrant | BADHDUFLAG | Total packets | Discarded packets |
| A | 0 | 14920 | 2 |
| B | 0 | 13726 | 2 |
| C | 0 | 14545 | 3 |
| D | 0 | 17592 | 2 |
| Quadrant | Total seconds | Saturated seconds | Saturation percentage |
|---|---|---|---|
| A | 6414 | 93 | 1.449953% |
| B | 6414 | 92 | 1.434362% |
| C | 6413 | 131 | 2.042726% |
| D | 6413 | 275 | 4.288165% |
Noise dominated data is calculated using 1-second bins in cleaned event files. If a bin has >2000 counts, and if more than 50% of those come from <1% of pixels, then it is considered to be noise-dominated and hence unusable.
| Quadrant | # 1 sec bins | Bins with >0 counts | Bins with >2000 counts | High rate bins dominated by noise | Noise dominated (total time) | Noise dominated (detector-on time) | Marked lightcurve |
|---|---|---|---|---|---|---|---|
| A | 7564 | 6415 | 60 | 60 | 0.79% | 0.94% | 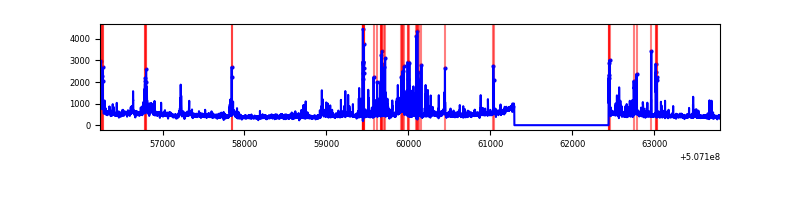 |
| B | 7564 | 6415 | 27 | 27 | 0.36% | 0.42% | 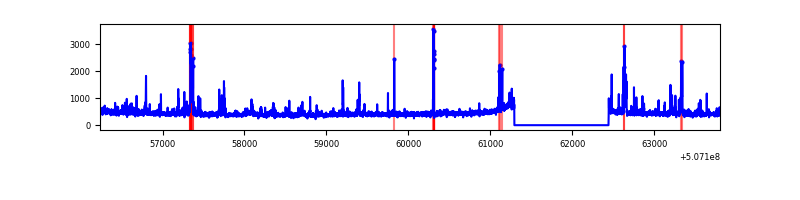 |
| C | 7563 | 6413 | 78 | 78 | 1.03% | 1.22% | 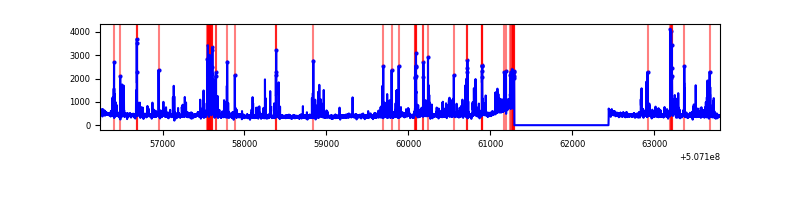 |
| D | 7563 | 6414 | 243 | 243 | 3.21% | 3.79% | 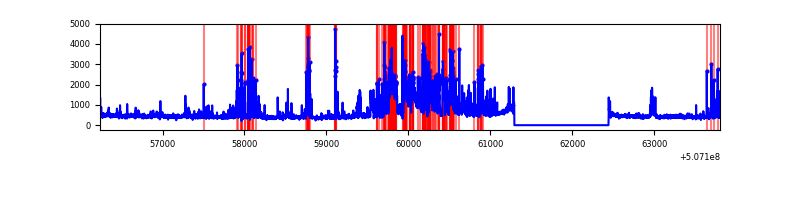 |
Top three noisy pixels from each quadrant. If the there are fewer than three noisy pixels in the level2.evt file, extra rows are filled as -1
| Pixel properties | Quadrant properties | ||||||
|---|---|---|---|---|---|---|---|
| Quadrant | DetID | PixID | Counts | Sigma | Mean | Median | Sigma |
| A | 3 | 14 | 302650 | 1791.18 | 674 | 656 | 168.6 |
| A | 15 | 32 | 235533 | 1393.1 | 674 | 656 | 168.6 |
| A | 4 | 206 | 174595 | 1031.67 | 674 | 656 | 168.6 |
| B | 0 | 199 | 89043 | 612.86 | 674 | 650 | 144.2 |
| B | 7 | 252 | 71381 | 490.4 | 674 | 650 | 144.2 |
| B | 0 | 153 | 61624 | 422.76 | 674 | 650 | 144.2 |
| C | 15 | 199 | 344883 | 1880.55 | 663 | 657 | 183.0 |
| C | 12 | 252 | 270620 | 1474.85 | 663 | 657 | 183.0 |
| C | 13 | 3 | 17986 | 94.67 | 663 | 657 | 183.0 |
| D | 8 | 245 | 569271 | 3087.73 | 654 | 625 | 184.2 |
| D | 8 | 160 | 452090 | 2451.44 | 654 | 625 | 184.2 |
| D | 2 | 31 | 363907 | 1972.61 | 654 | 625 | 184.2 |
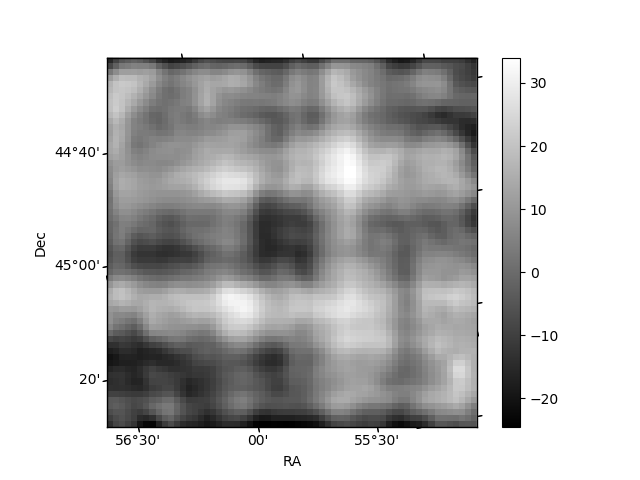
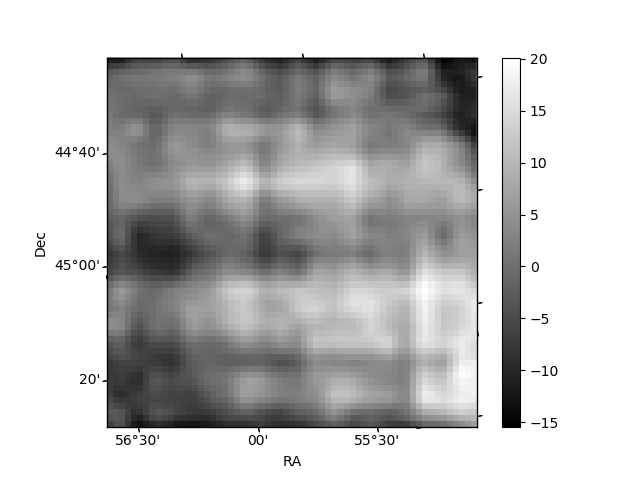
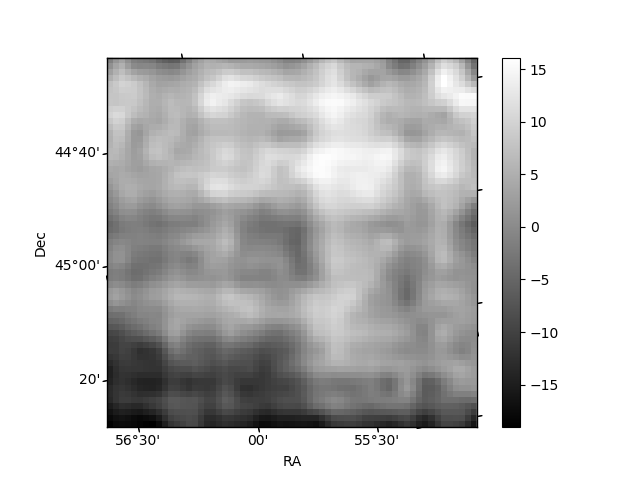
Histogram calculated using DETX and DETY for each event in the final _common_clean file
| Quadrant A | 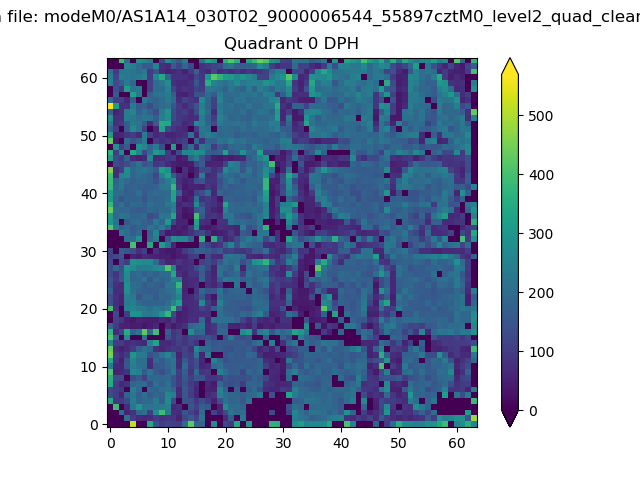 |
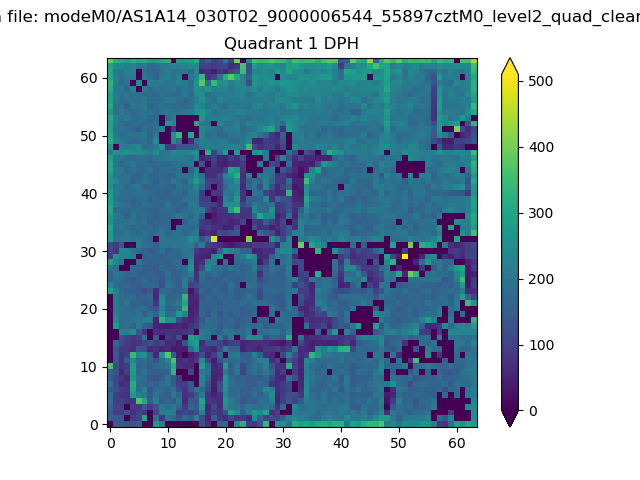 |
Quadrant B |
|---|---|---|---|
| Quadrant D | 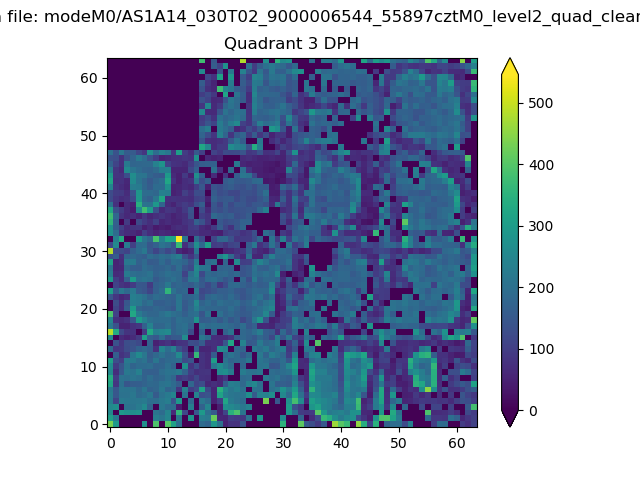 |
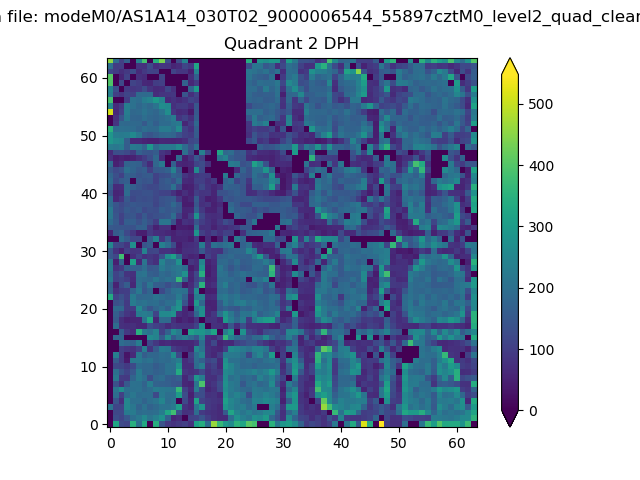 |
Quadrant C |
| Plot type | Count rate plots | Images |
|---|---|---|
| Comparison with Poisson distribution Blue bars denote a histogram of data divided into 1 sec bins. Red curve is a Poisson curve with rate = median count rate of data. |
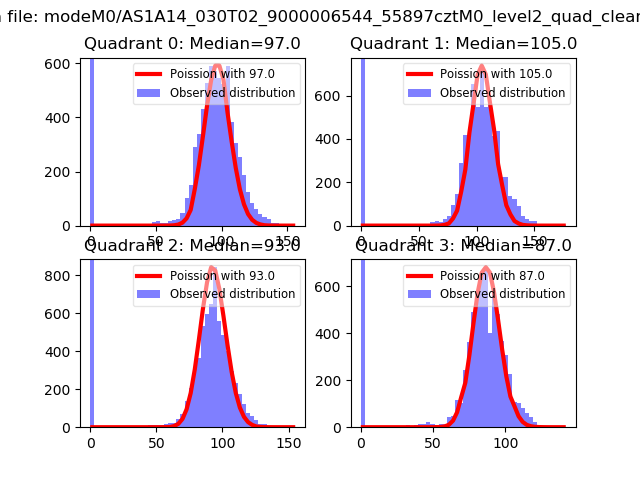 |
 |
| Quadrant-wise count rates Data is divided into 100 sec bins |
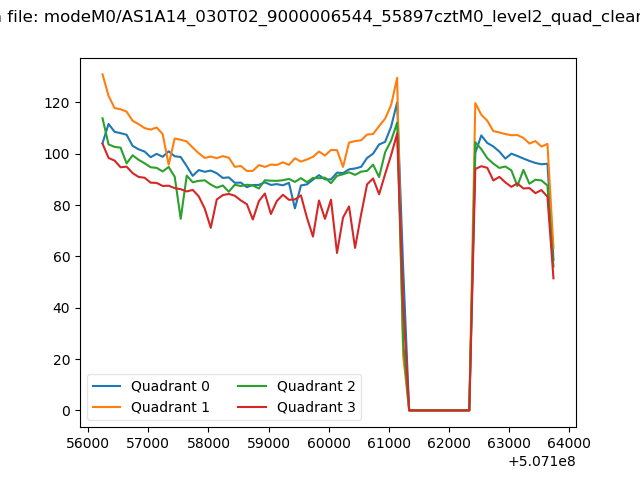 |
|
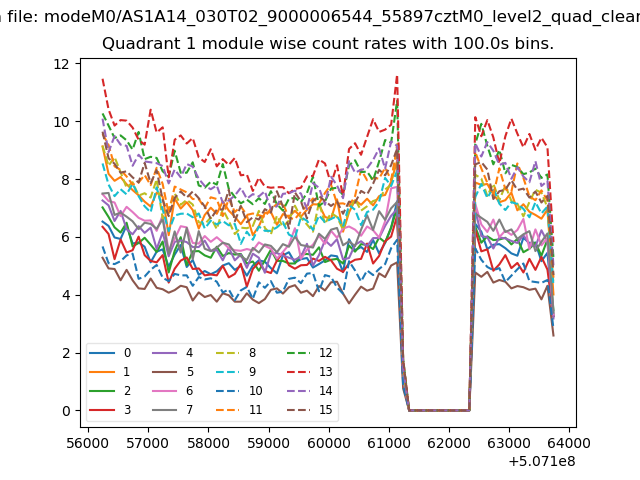
| Module-wise count rates for Quadrant A Data is divided into 100 sec bins |
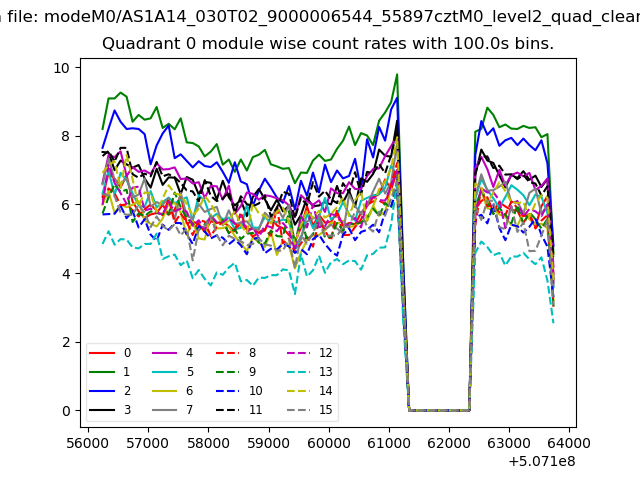 |
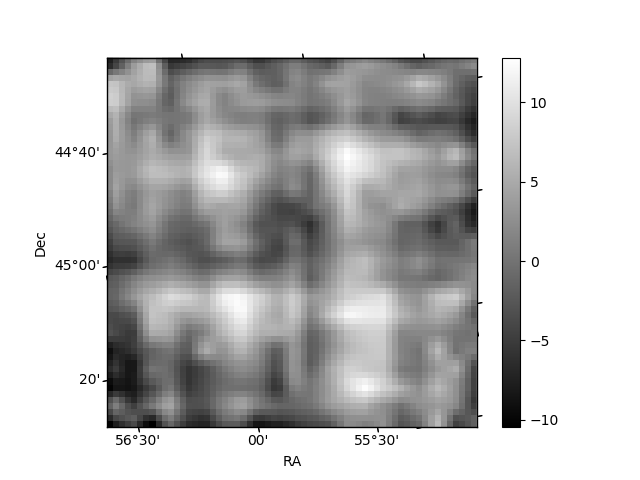 |
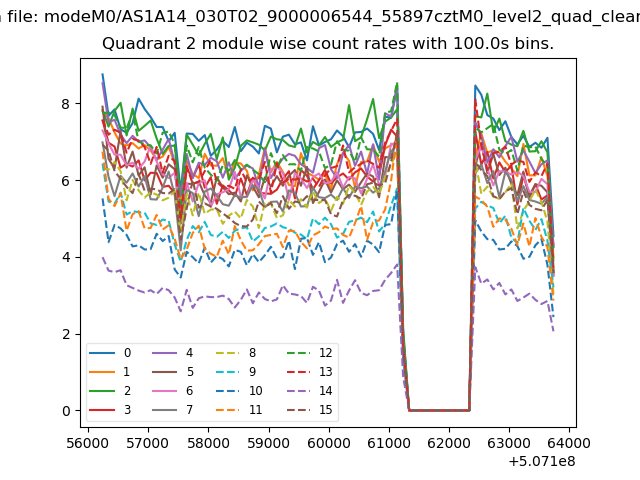
| Module-wise count rates for Quadrant B Data is divided into 100 sec bins |
 |
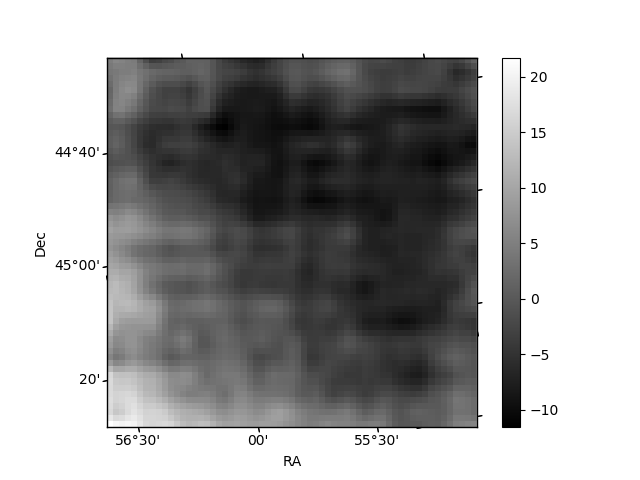 |
| Module-wise count rates for Quadrant C Data is divided into 100 sec bins |
 |
 |
| Module-wise count rates for Quadrant D Data is divided into 100 sec bins |
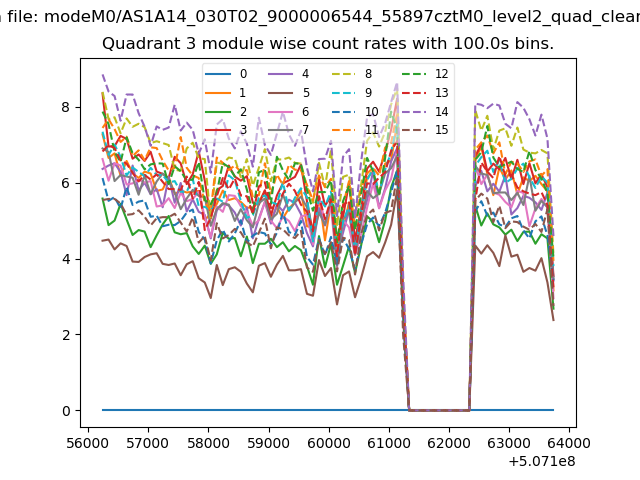 |
 |
| Parameter | Plot |
|---|---|
| CZT HV Monitor | 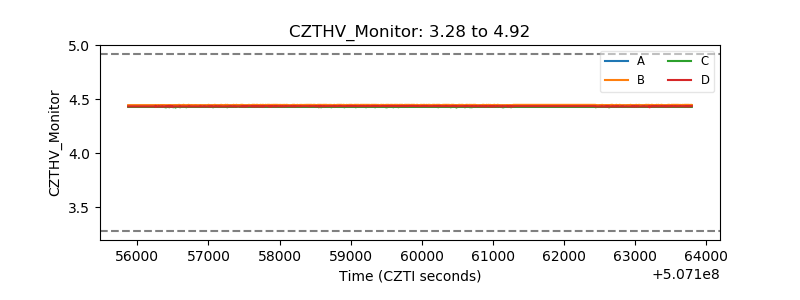 |
| D_VDD | 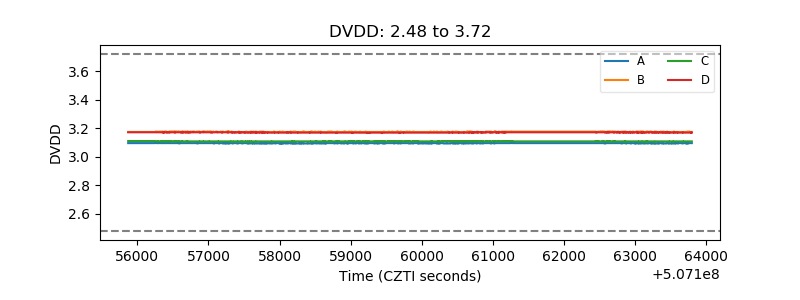 |
| Temperature 1 | 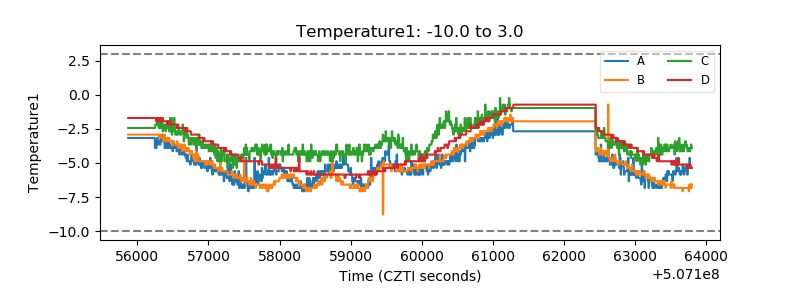 |
| Veto HV Monitor | 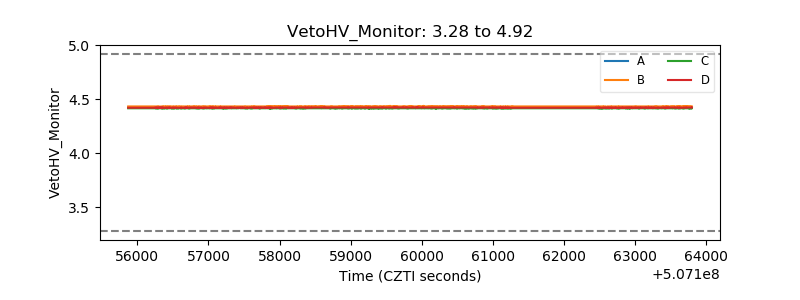 |
| Veto LLD | 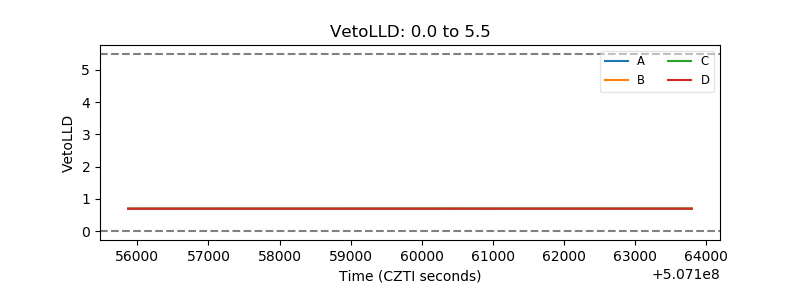 |
| Alpha Counter | 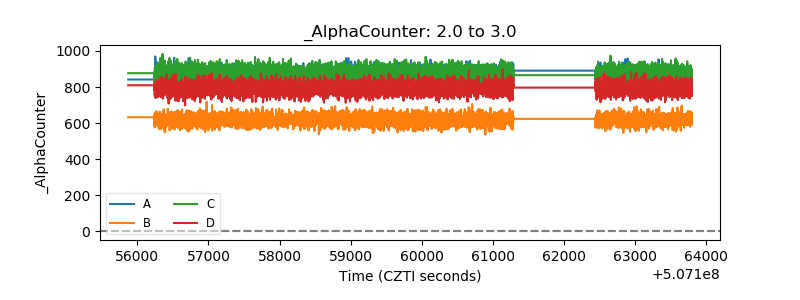 |
| _CPM_Rate | 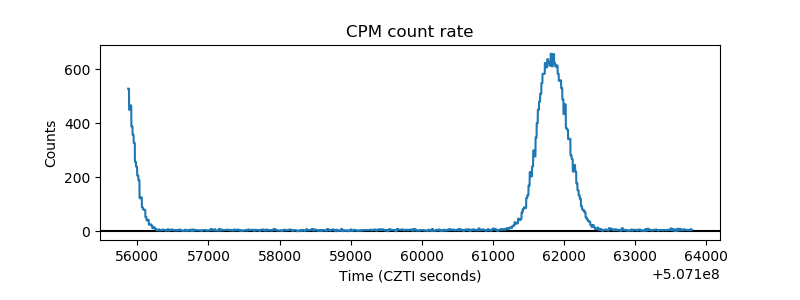 |
| CZT Counter | 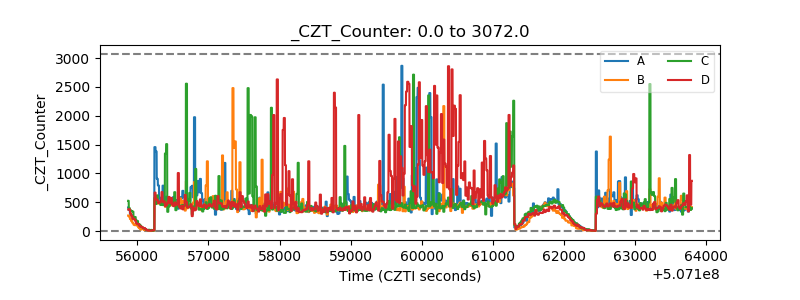 |
| +2.5 Volts monitor |  |
| +5 Volts monitor |  |
| _ROLL_ROT | 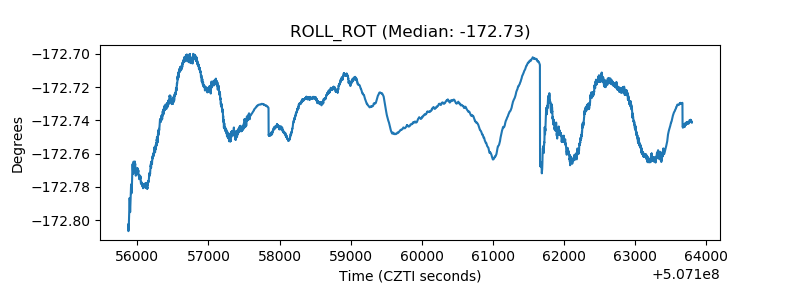 |
| _Roll_DEC | 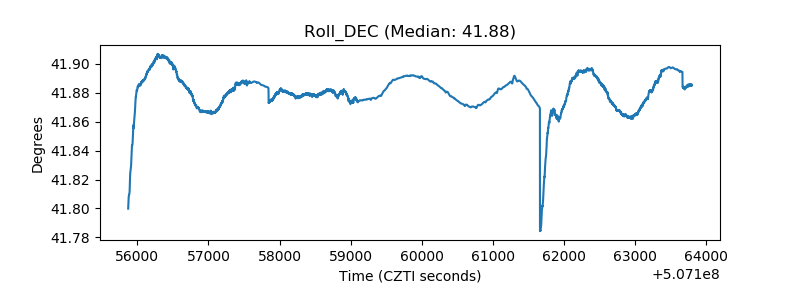 |
| _Roll_RA | 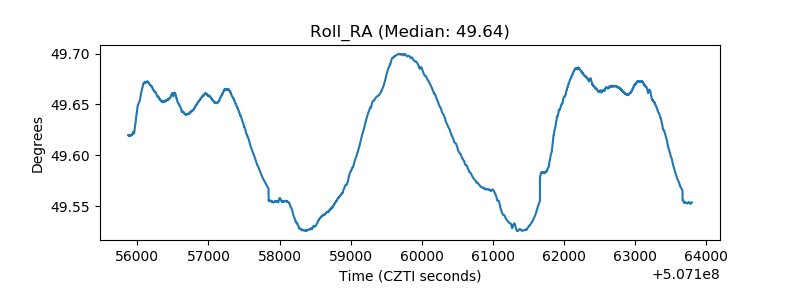 |
| Veto Counter | 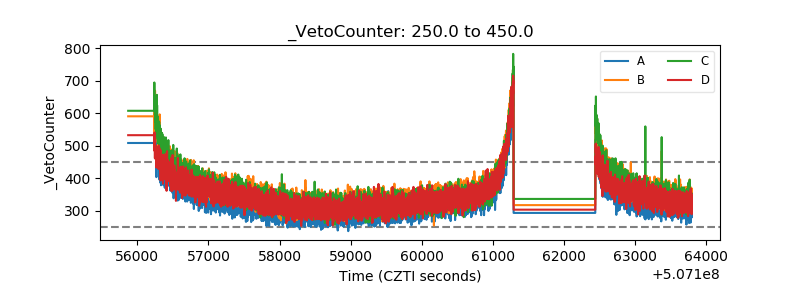 |