| Param | Original file | Final file |
|---|---|---|
| Filename | modeM0/AS1A14_030T02_9000006544_55898cztM0_level2.fits | modeM0/AS1A14_030T02_9000006544_55898cztM0_level2_quad_clean.evt |
| Size (bytes) | 375,396,480 | 96,258,240 |
| Size | 358.0 MB | 91.8 MB |
| Events in quadrant A | 3,097,721 | 627,069 |
| Events in quadrant B | 3,040,356 | 673,974 |
| Events in quadrant C | 3,614,320 | 586,957 |
| Events in quadrant D | 3,628,052 | 564,926 |
| Mode SS | |||
|---|---|---|---|
| Quadrant | BADHDUFLAG | Total packets | Discarded packets |
| A | 0 | 138 | 0 |
| B | 0 | 138 | 0 |
| C | 0 | 138 | 0 |
| D | 0 | 138 | 0 |
| Mode M9 | |||
|---|---|---|---|
| Quadrant | BADHDUFLAG | Total packets | Discarded packets |
| A | 0 | 22 | 0 |
| B | 0 | 22 | 0 |
| C | 0 | 22 | 0 |
| D | 0 | 22 | 0 |
| Mode M0 | |||
|---|---|---|---|
| Quadrant | BADHDUFLAG | Total packets | Discarded packets |
| A | 0 | 14340 | 2 |
| B | 0 | 14118 | 2 |
| C | 0 | 15853 | 2 |
| D | 0 | 15724 | 2 |
| Quadrant | Total seconds | Saturated seconds | Saturation percentage |
|---|---|---|---|
| A | 6618 | 73 | 1.103052% |
| B | 6619 | 125 | 1.888503% |
| C | 6619 | 260 | 3.928086% |
| D | 6619 | 112 | 1.692099% |
Noise dominated data is calculated using 1-second bins in cleaned event files. If a bin has >2000 counts, and if more than 50% of those come from <1% of pixels, then it is considered to be noise-dominated and hence unusable.
| Quadrant | # 1 sec bins | Bins with >0 counts | Bins with >2000 counts | High rate bins dominated by noise | Noise dominated (total time) | Noise dominated (detector-on time) | Marked lightcurve |
|---|---|---|---|---|---|---|---|
| A | 8863 | 6621 | 19 | 19 | 0.21% | 0.29% | 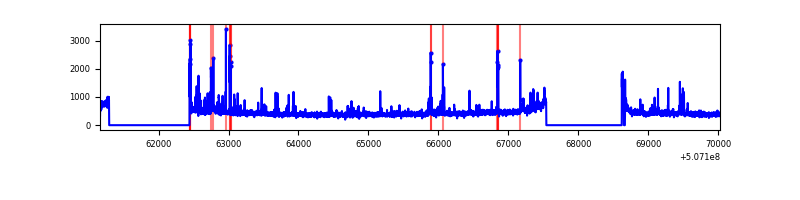 |
| B | 8864 | 6622 | 26 | 26 | 0.29% | 0.39% | 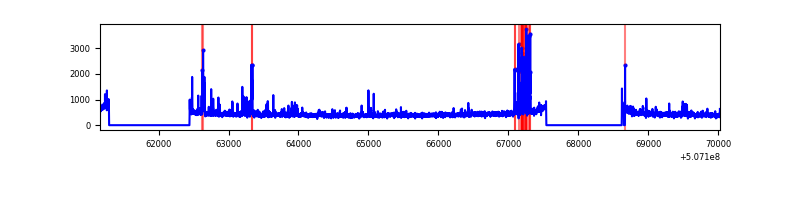 |
| C | 8864 | 6621 | 169 | 169 | 1.91% | 2.55% | 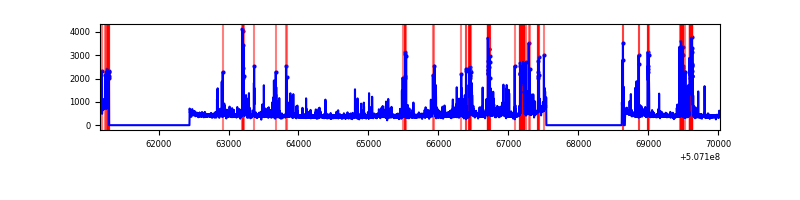 |
| D | 8864 | 6622 | 73 | 73 | 0.82% | 1.10% | 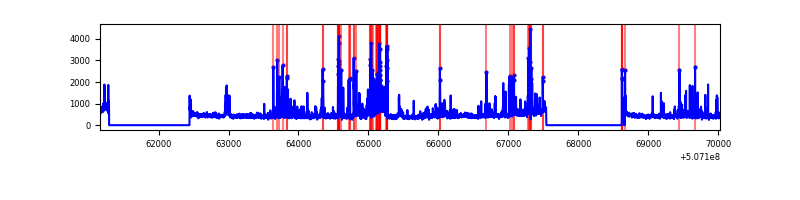 |
Top three noisy pixels from each quadrant. If the there are fewer than three noisy pixels in the level2.evt file, extra rows are filled as -1
| Pixel properties | Quadrant properties | ||||||
|---|---|---|---|---|---|---|---|
| Quadrant | DetID | PixID | Counts | Sigma | Mean | Median | Sigma |
| A | 3 | 14 | 211466 | 1220.9 | 695 | 677 | 172.7 |
| A | 15 | 32 | 58665 | 335.87 | 695 | 677 | 172.7 |
| A | 4 | 249 | 40461 | 230.43 | 695 | 677 | 172.7 |
| B | 0 | 153 | 136932 | 913.32 | 694 | 668 | 149.2 |
| B | 0 | 199 | 85787 | 570.52 | 694 | 668 | 149.2 |
| B | 12 | 111 | 18000 | 116.17 | 694 | 668 | 149.2 |
| C | 15 | 199 | 632905 | 3449.37 | 673 | 667 | 183.3 |
| C | 12 | 252 | 305746 | 1664.45 | 673 | 667 | 183.3 |
| C | 6 | 223 | 27577 | 146.82 | 673 | 667 | 183.3 |
| D | 8 | 160 | 340037 | 1790.19 | 677 | 646 | 189.6 |
| D | 2 | 31 | 263701 | 1387.54 | 677 | 646 | 189.6 |
| D | 8 | 240 | 92189 | 482.86 | 677 | 646 | 189.6 |
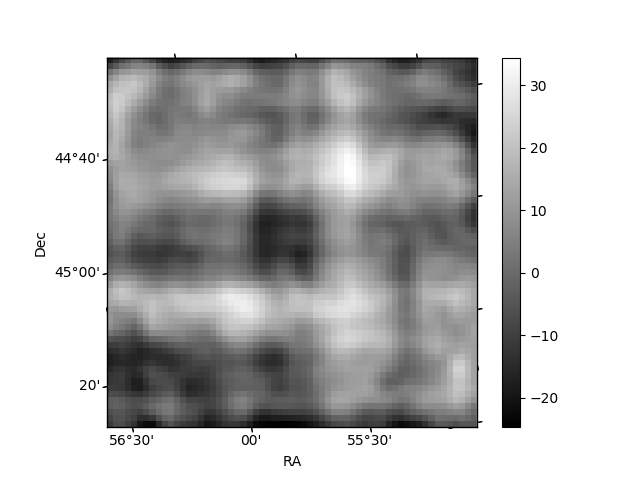
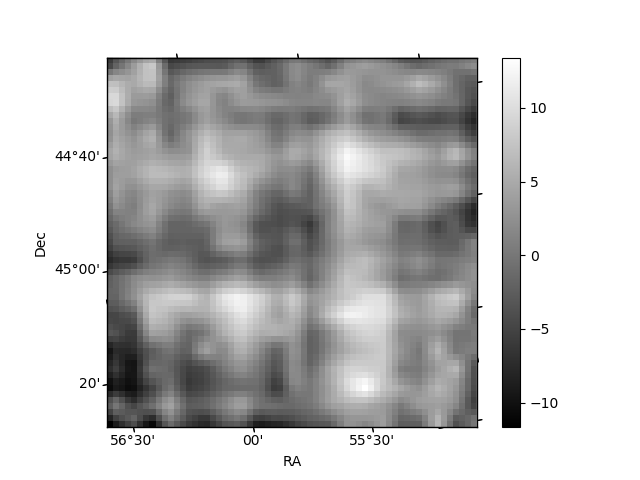
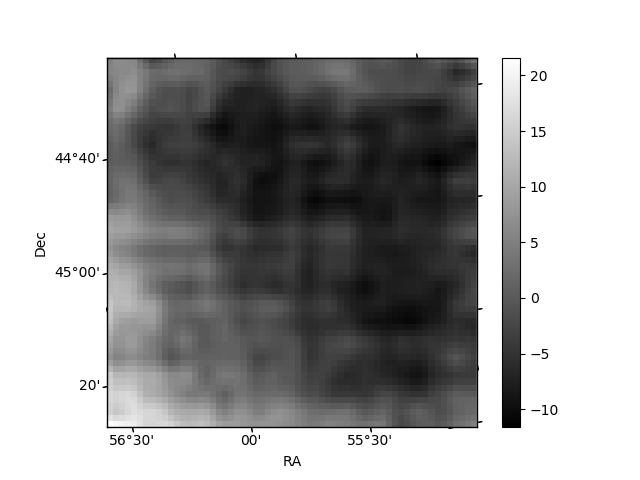
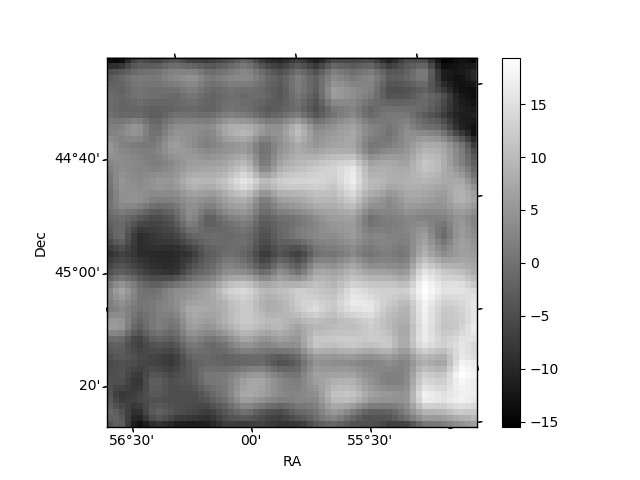
Histogram calculated using DETX and DETY for each event in the final _common_clean file
| Quadrant A | 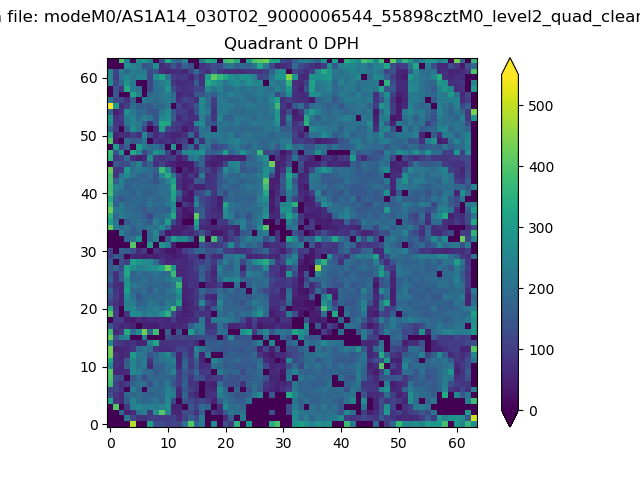 |
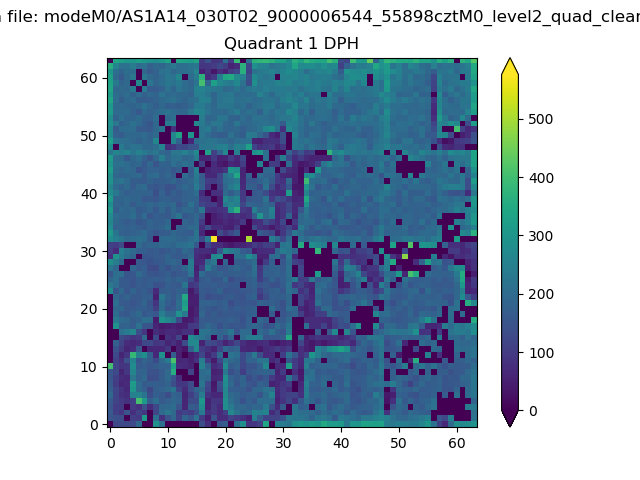 |
Quadrant B |
|---|---|---|---|
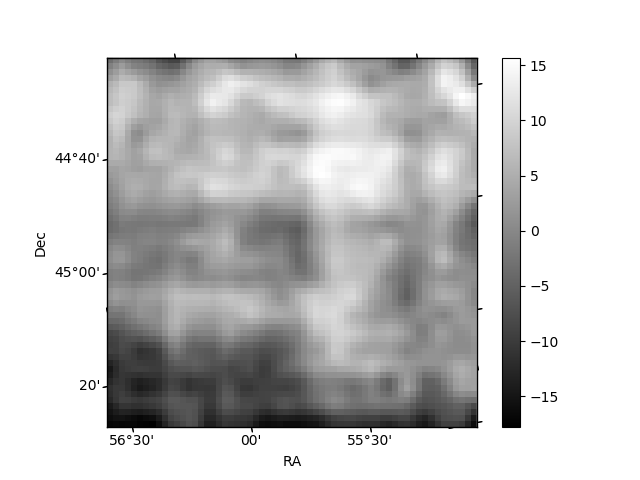
| Quadrant D | 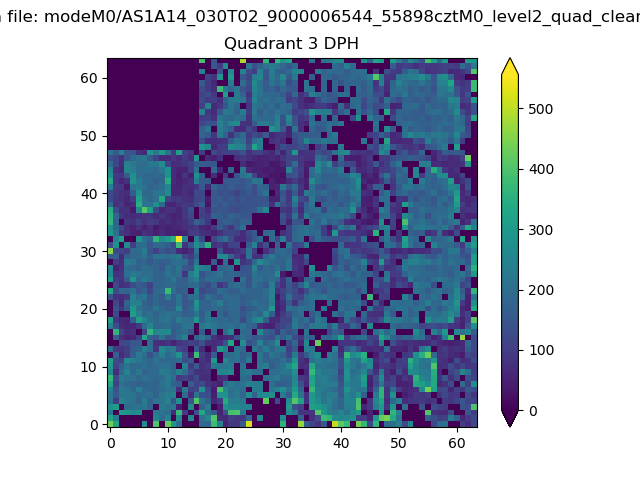 |
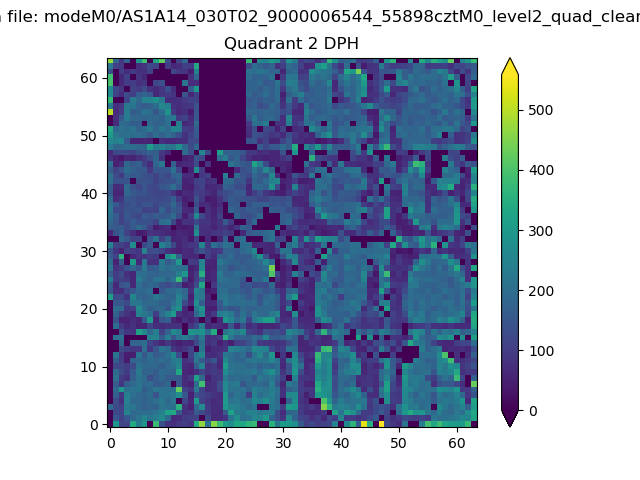 |
Quadrant C |
| Plot type | Count rate plots | Images |
|---|---|---|
| Comparison with Poisson distribution Blue bars denote a histogram of data divided into 1 sec bins. Red curve is a Poisson curve with rate = median count rate of data. |
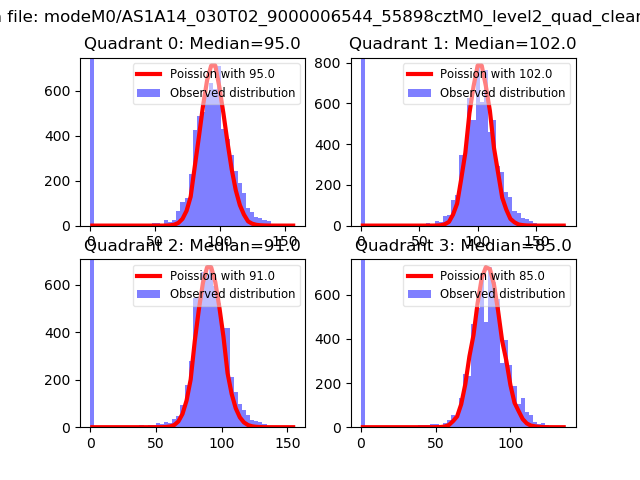 |
 |
| Quadrant-wise count rates Data is divided into 100 sec bins |
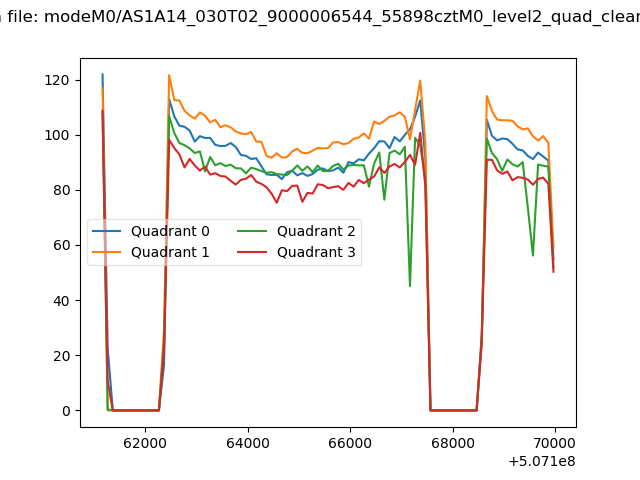 |
|
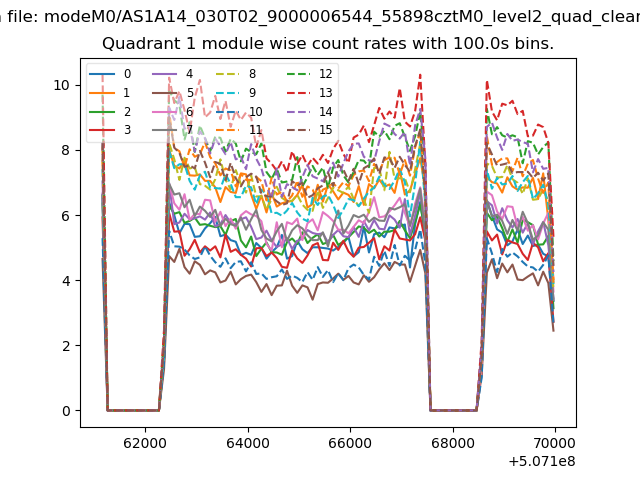
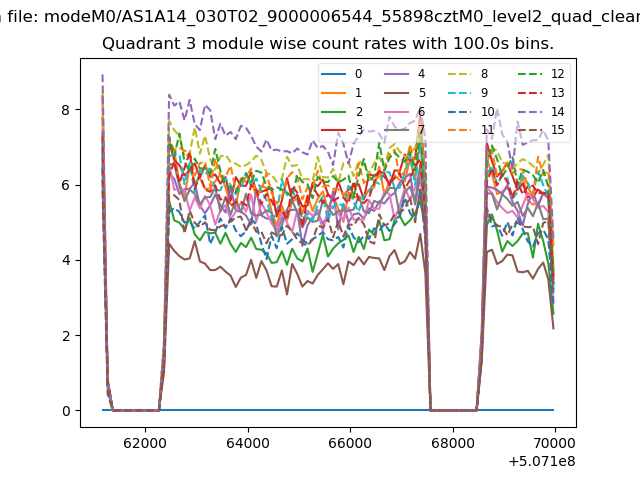
| Module-wise count rates for Quadrant A Data is divided into 100 sec bins |
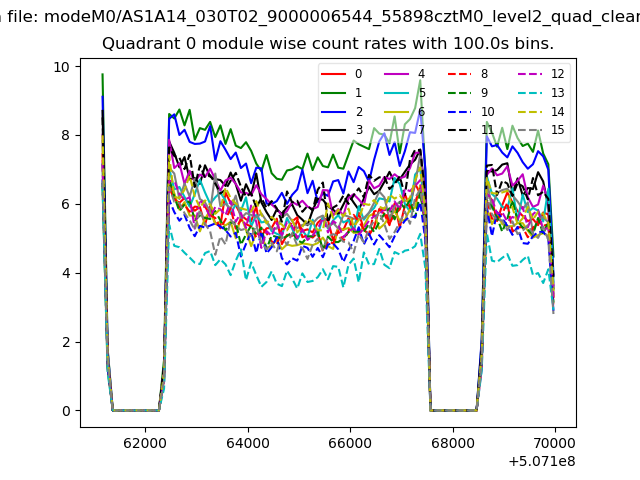 |
 |
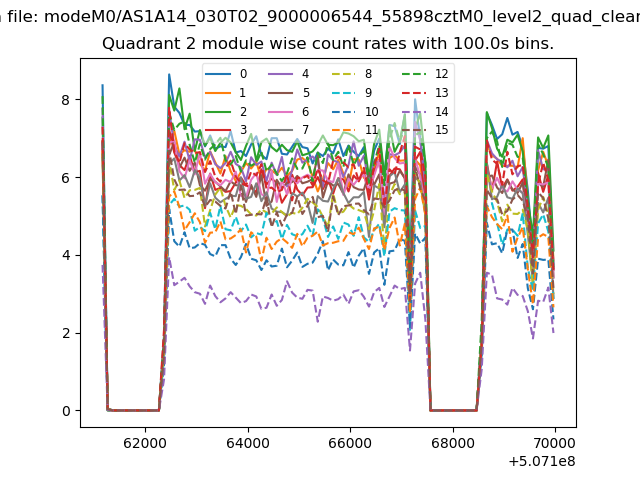
| Module-wise count rates for Quadrant B Data is divided into 100 sec bins |
 |
 |
| Module-wise count rates for Quadrant C Data is divided into 100 sec bins |
 |
 |
| Module-wise count rates for Quadrant D Data is divided into 100 sec bins |
 |
 |
| Parameter | Plot |
|---|---|
| CZT HV Monitor | 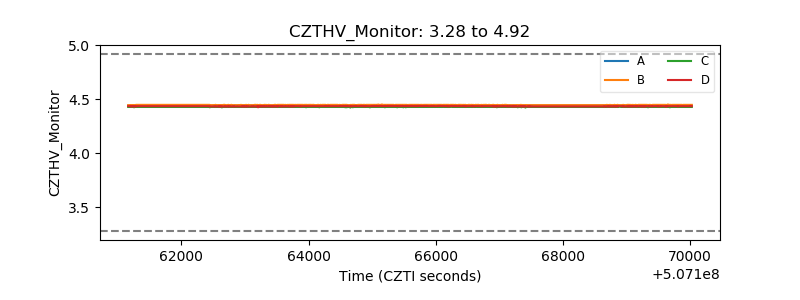 |
| D_VDD | 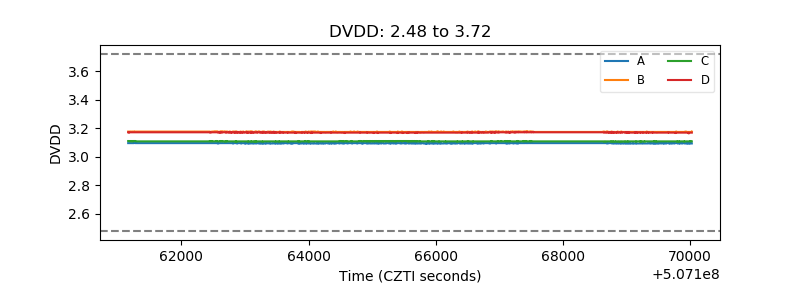 |
| Temperature 1 | 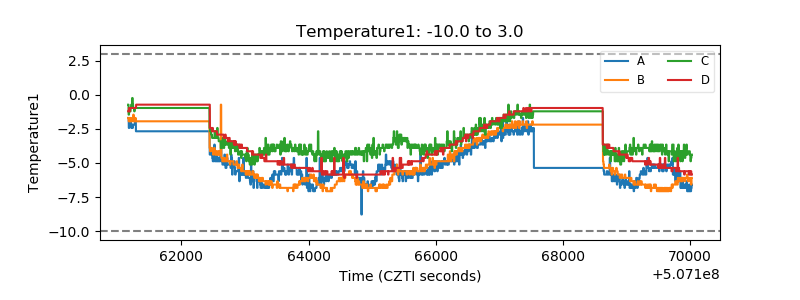 |
| Veto HV Monitor | 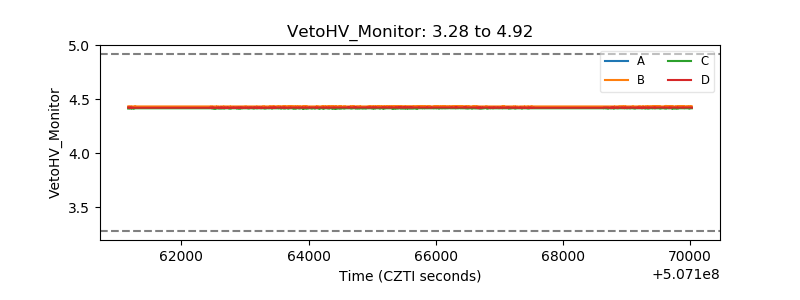 |
| Veto LLD | 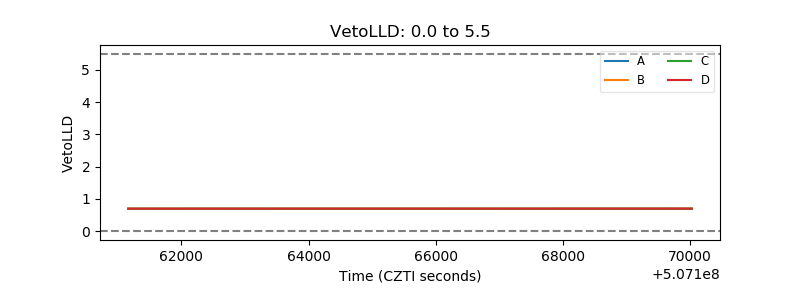 |
| Alpha Counter | 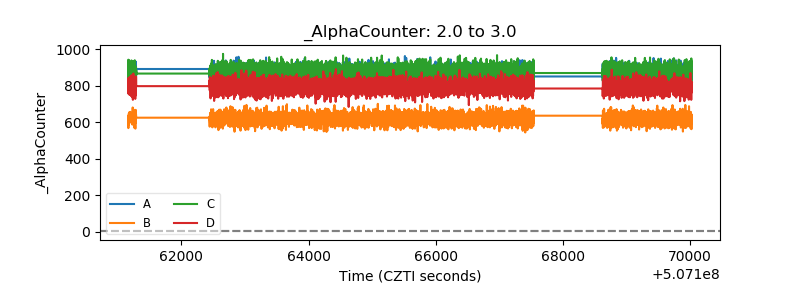 |
| _CPM_Rate | 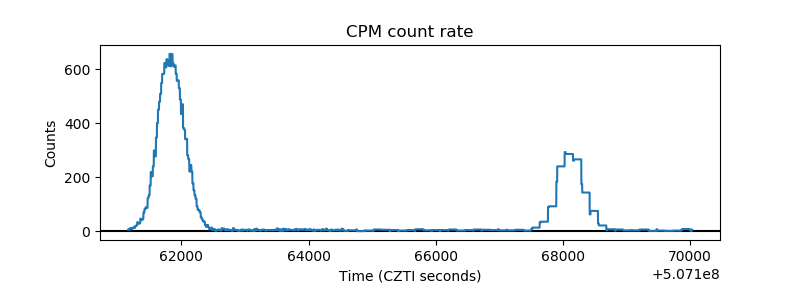 |
| CZT Counter | 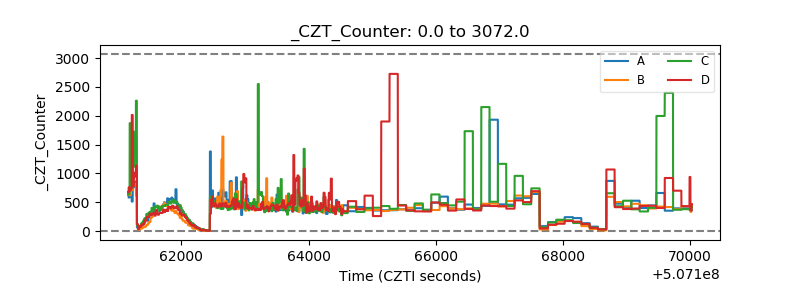 |
| +2.5 Volts monitor |  |
| +5 Volts monitor | 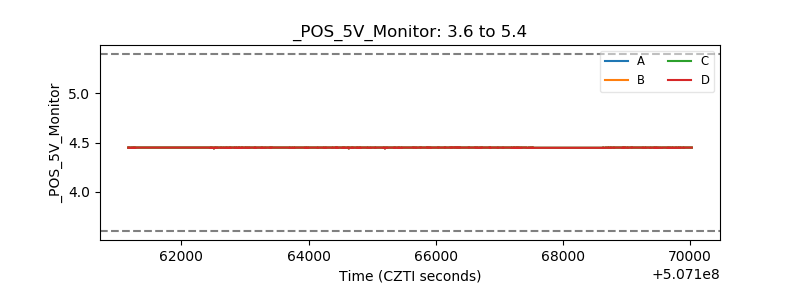 |
| _ROLL_ROT | 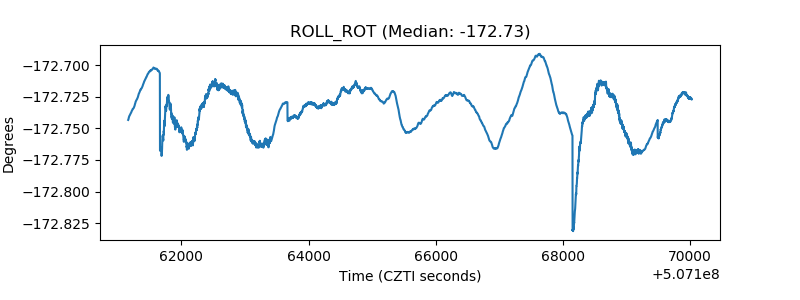 |
| _Roll_DEC | 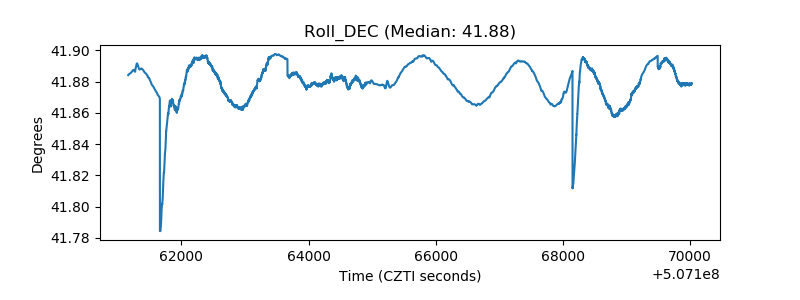 |
| _Roll_RA | 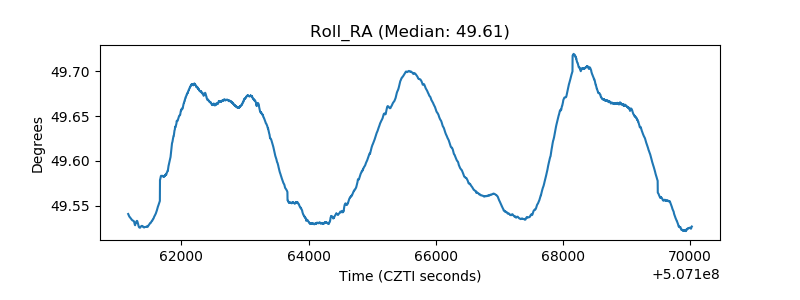 |
| Veto Counter | 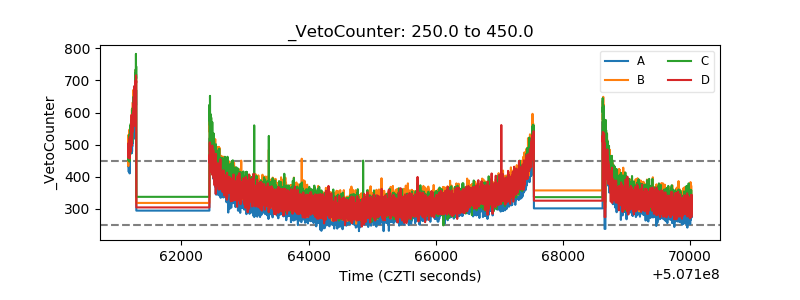 |