| Param | Original file | Final file |
|---|---|---|
| Filename | modeM0/AS1A14_030T02_9000006544_55899cztM0_level2.fits | modeM0/AS1A14_030T02_9000006544_55899cztM0_level2_quad_clean.evt |
| Size (bytes) | 389,085,120 | 99,624,960 |
| Size | 371.1 MB | 95.0 MB |
| Events in quadrant A | 3,266,153 | 642,078 |
| Events in quadrant B | 3,215,788 | 696,945 |
| Events in quadrant C | 4,011,353 | 603,524 |
| Events in quadrant D | 3,364,529 | 586,920 |
| Mode SS | |||
|---|---|---|---|
| Quadrant | BADHDUFLAG | Total packets | Discarded packets |
| A | 0 | 144 | 0 |
| B | 0 | 144 | 0 |
| C | 0 | 144 | 0 |
| D | 0 | 144 | 0 |
| Mode M9 | |||
|---|---|---|---|
| Quadrant | BADHDUFLAG | Total packets | Discarded packets |
| A | 0 | 18 | 0 |
| B | 0 | 19 | 0 |
| C | 0 | 19 | 0 |
| D | 0 | 19 | 0 |
| Mode M0 | |||
|---|---|---|---|
| Quadrant | BADHDUFLAG | Total packets | Discarded packets |
| A | 0 | 15153 | 2 |
| B | 0 | 15002 | 2 |
| C | 0 | 17354 | 2 |
| D | 0 | 15340 | 2 |
| Quadrant | Total seconds | Saturated seconds | Saturation percentage |
|---|---|---|---|
| A | 6994 | 92 | 1.315413% |
| B | 6994 | 108 | 1.544181% |
| C | 6994 | 322 | 4.603946% |
| D | 6994 | 72 | 1.029454% |
Noise dominated data is calculated using 1-second bins in cleaned event files. If a bin has >2000 counts, and if more than 50% of those come from <1% of pixels, then it is considered to be noise-dominated and hence unusable.
| Quadrant | # 1 sec bins | Bins with >0 counts | Bins with >2000 counts | High rate bins dominated by noise | Noise dominated (total time) | Noise dominated (detector-on time) | Marked lightcurve |
|---|---|---|---|---|---|---|---|
| A | 7829 | 6996 | 54 | 54 | 0.69% | 0.77% | 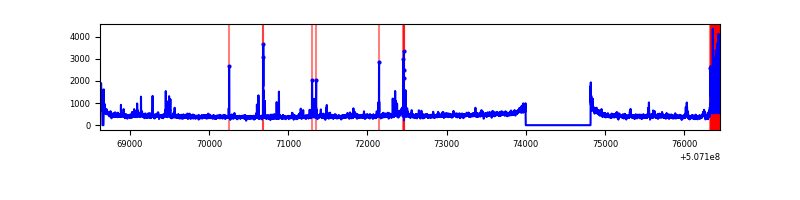 |
| B | 7829 | 6996 | 24 | 24 | 0.31% | 0.34% | 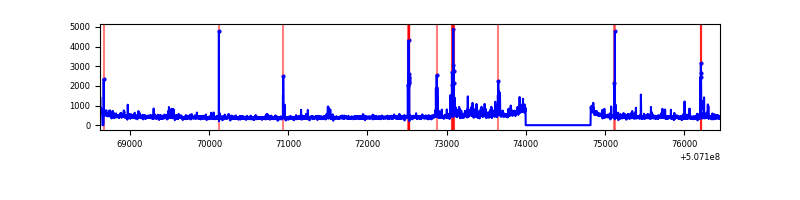 |
| C | 7829 | 6996 | 255 | 255 | 3.26% | 3.64% | 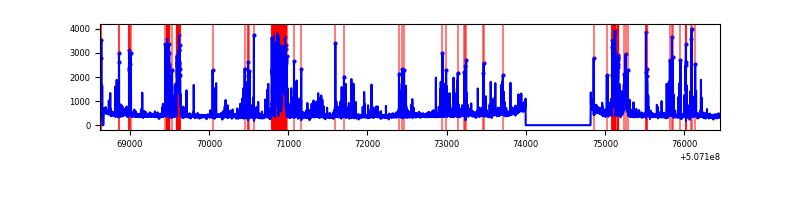 |
| D | 7829 | 6996 | 58 | 58 | 0.74% | 0.83% | 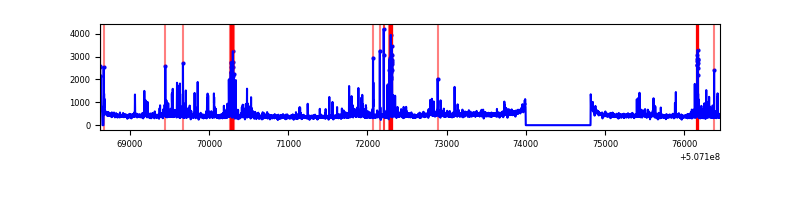 |
Top three noisy pixels from each quadrant. If the there are fewer than three noisy pixels in the level2.evt file, extra rows are filled as -1
| Pixel properties | Quadrant properties | ||||||
|---|---|---|---|---|---|---|---|
| Quadrant | DetID | PixID | Counts | Sigma | Mean | Median | Sigma |
| A | 7 | 64 | 215877 | 1206.62 | 722 | 705 | 178.3 |
| A | 3 | 14 | 129142 | 720.24 | 722 | 705 | 178.3 |
| A | 0 | 8 | 55749 | 308.67 | 722 | 705 | 178.3 |
| B | 5 | 185 | 137478 | 884.73 | 720 | 692 | 154.6 |
| B | 0 | 213 | 86850 | 557.27 | 720 | 692 | 154.6 |
| B | 0 | 199 | 47098 | 300.15 | 720 | 692 | 154.6 |
| C | 15 | 199 | 589923 | 3097.49 | 697 | 691 | 190.2 |
| C | 12 | 252 | 416582 | 2186.26 | 697 | 691 | 190.2 |
| C | 6 | 223 | 203555 | 1066.42 | 697 | 691 | 190.2 |
| D | 2 | 31 | 251018 | 1257.15 | 701 | 667 | 199.1 |
| D | 8 | 160 | 137265 | 685.93 | 701 | 667 | 199.1 |
| D | 7 | 129 | 67195 | 334.07 | 701 | 667 | 199.1 |
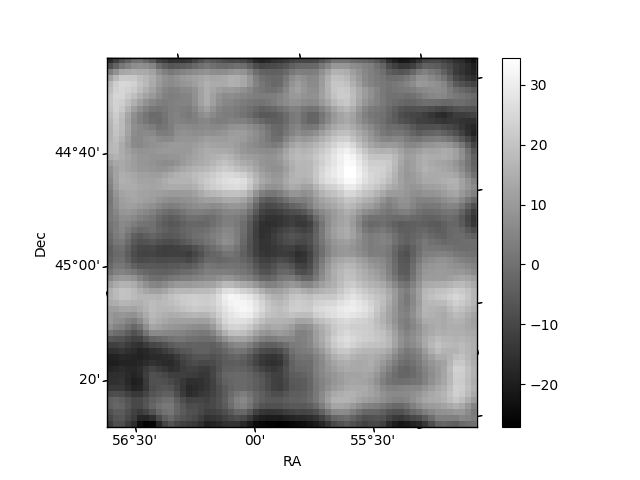
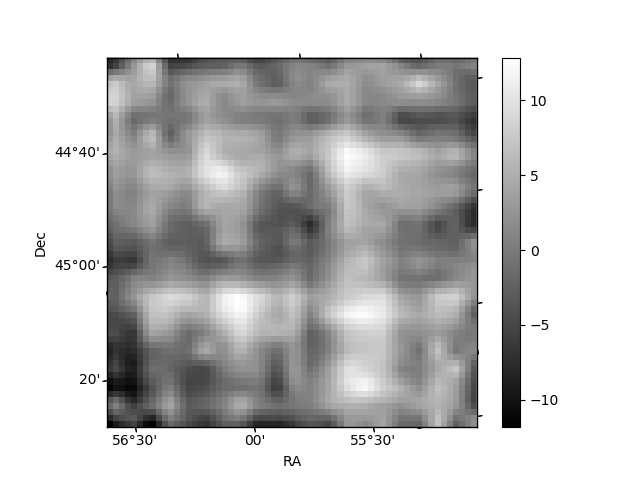
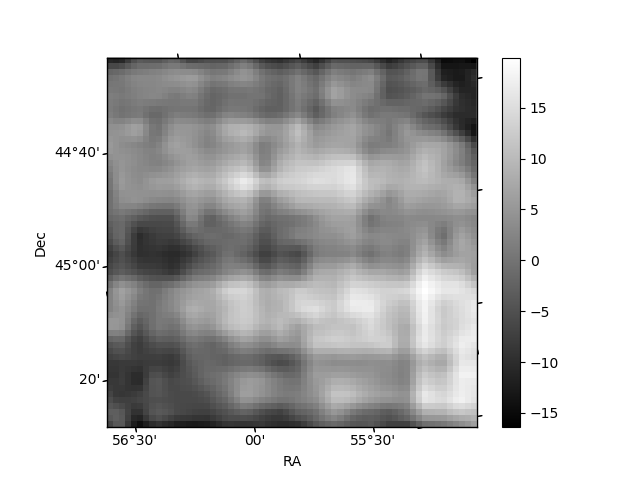
Histogram calculated using DETX and DETY for each event in the final _common_clean file
| Quadrant A | 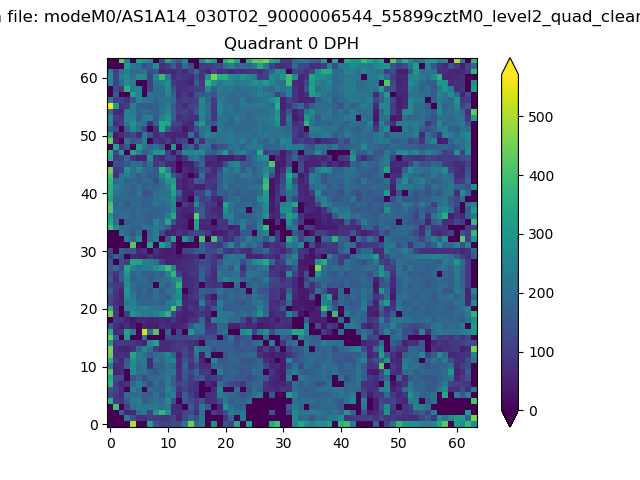 |
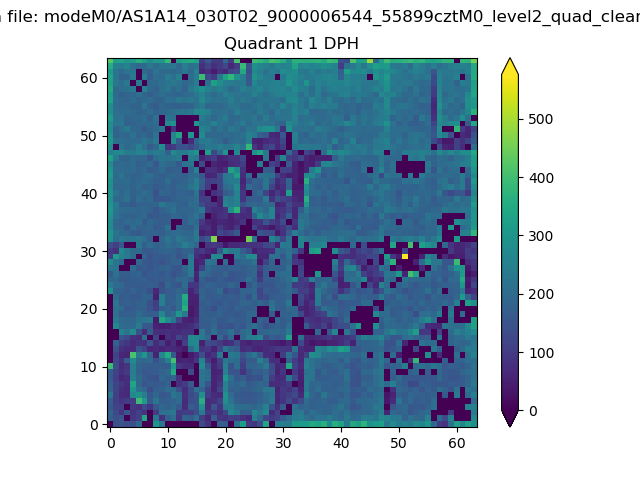 |
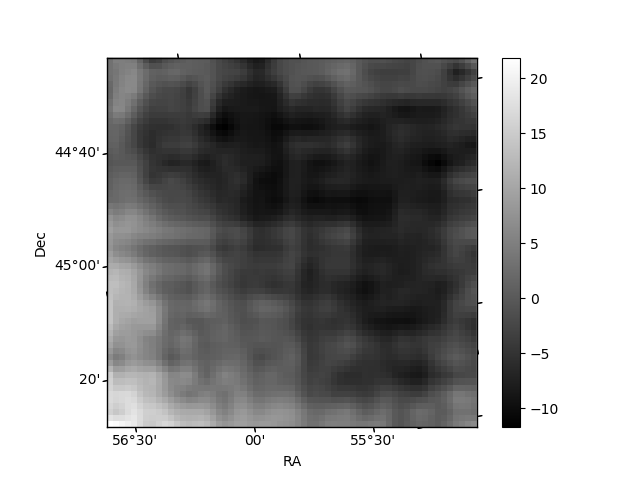
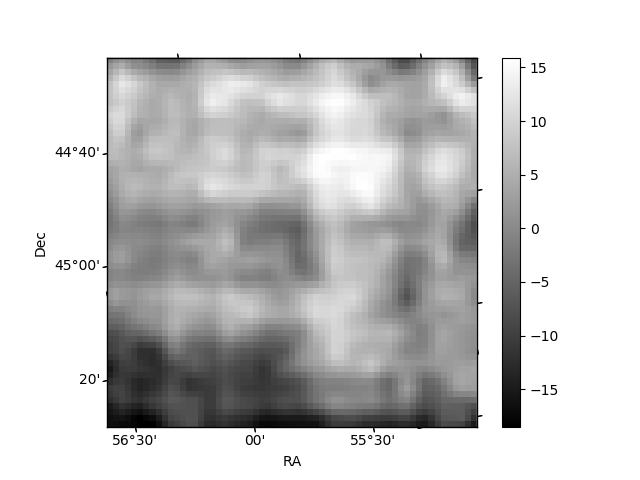
Quadrant B |
|---|---|---|---|
| Quadrant D | 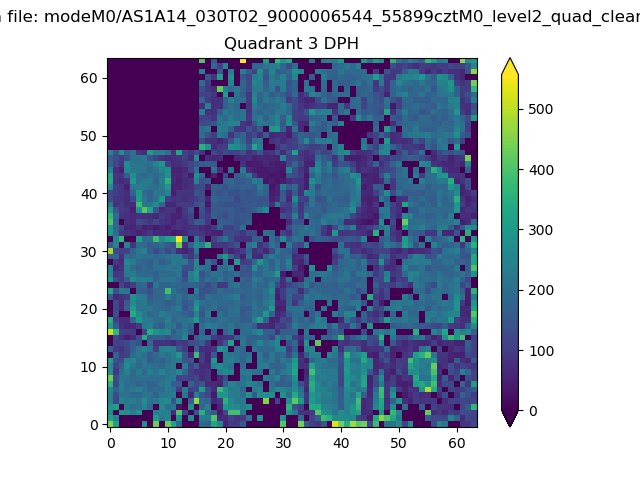 |
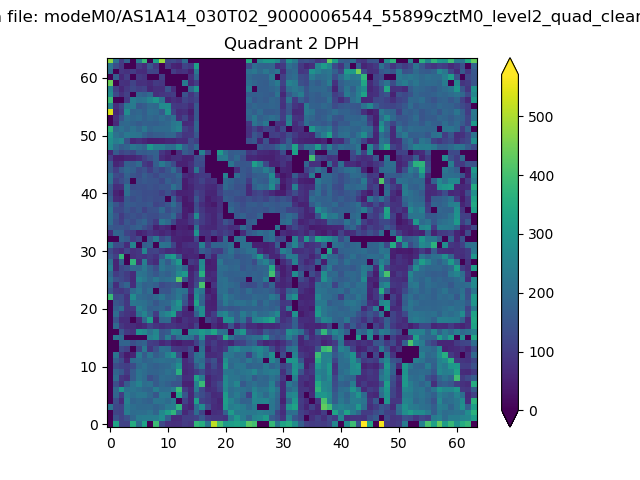 |
Quadrant C |
| Plot type | Count rate plots | Images |
|---|---|---|
| Comparison with Poisson distribution Blue bars denote a histogram of data divided into 1 sec bins. Red curve is a Poisson curve with rate = median count rate of data. |
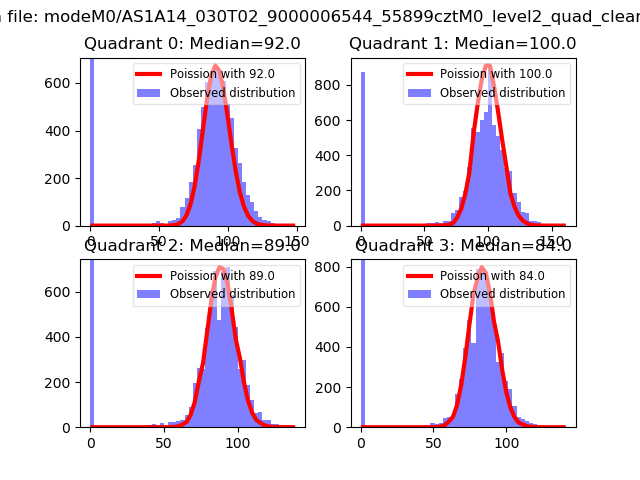 |
 |
| Quadrant-wise count rates Data is divided into 100 sec bins |
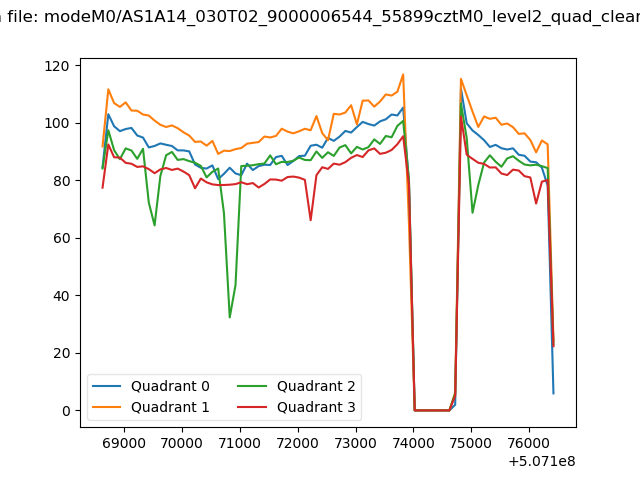 |
|
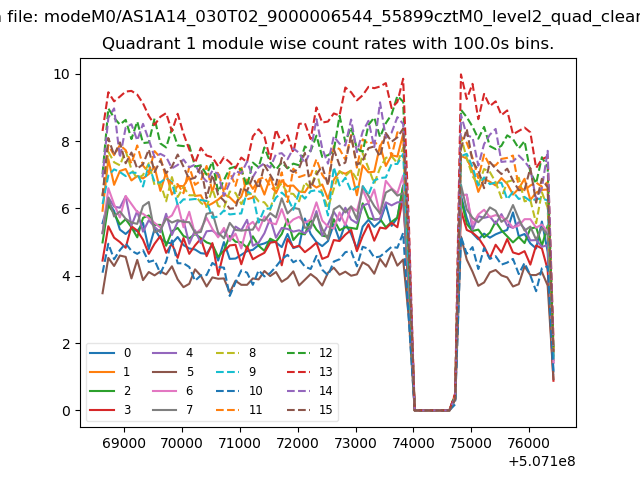
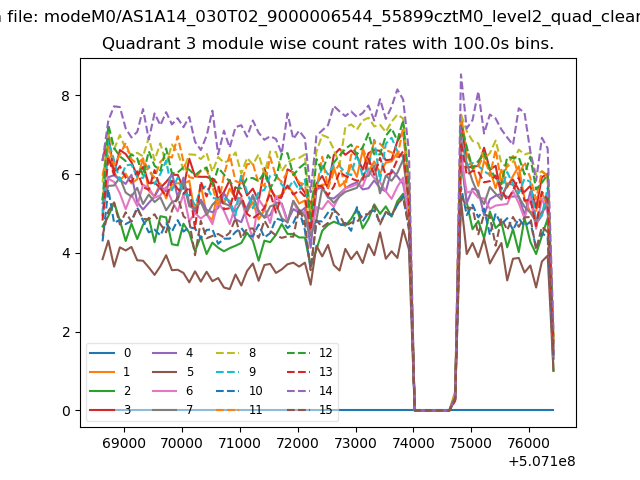
| Module-wise count rates for Quadrant A Data is divided into 100 sec bins |
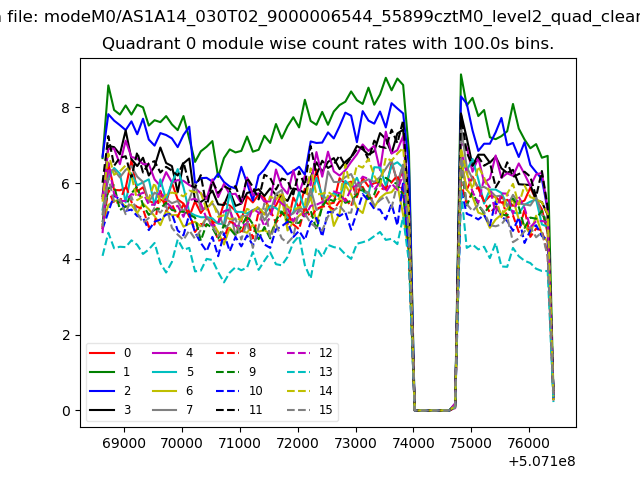 |
 |
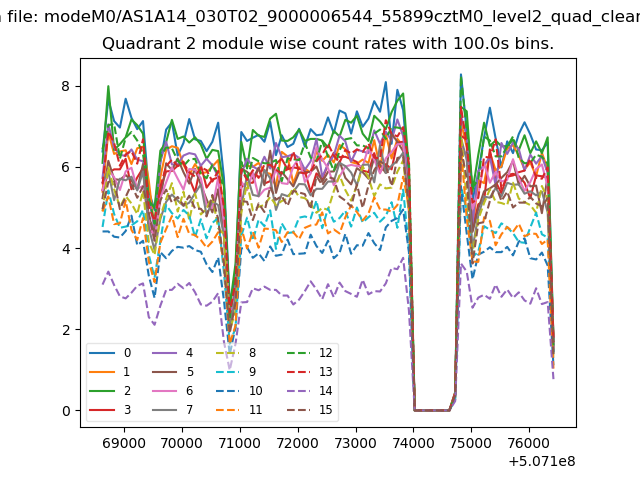
| Module-wise count rates for Quadrant B Data is divided into 100 sec bins |
 |
 |
| Module-wise count rates for Quadrant C Data is divided into 100 sec bins |
 |
 |
| Module-wise count rates for Quadrant D Data is divided into 100 sec bins |
 |
 |
| Parameter | Plot |
|---|---|
| CZT HV Monitor | 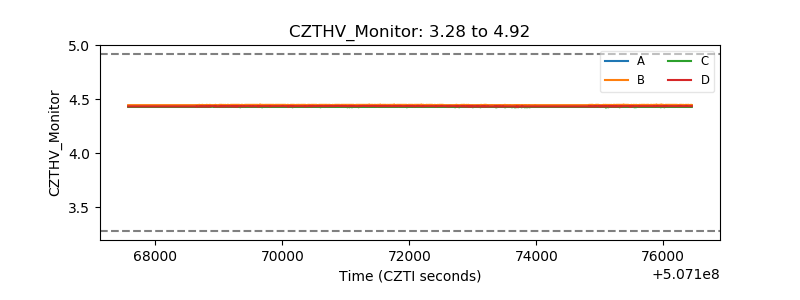 |
| D_VDD | 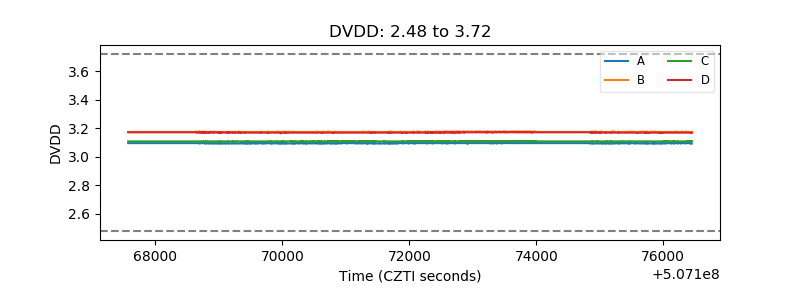 |
| Temperature 1 | 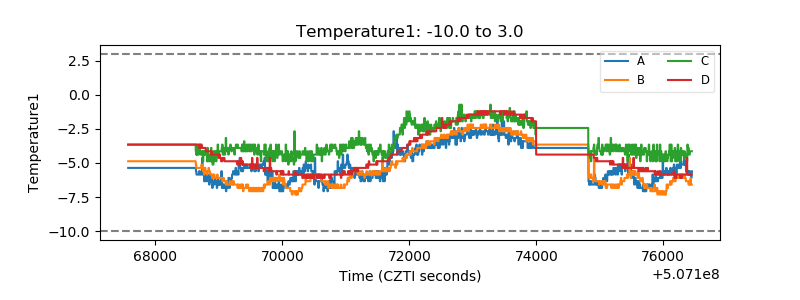 |
| Veto HV Monitor | 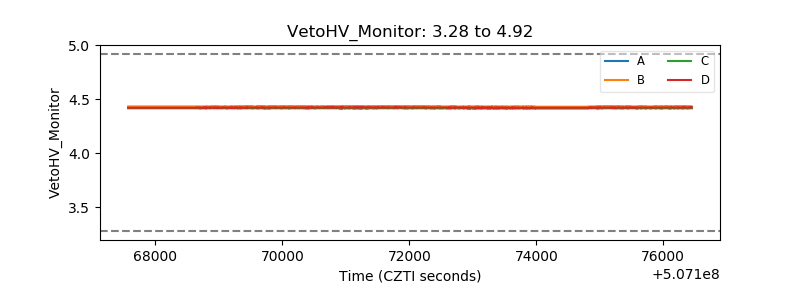 |
| Veto LLD | 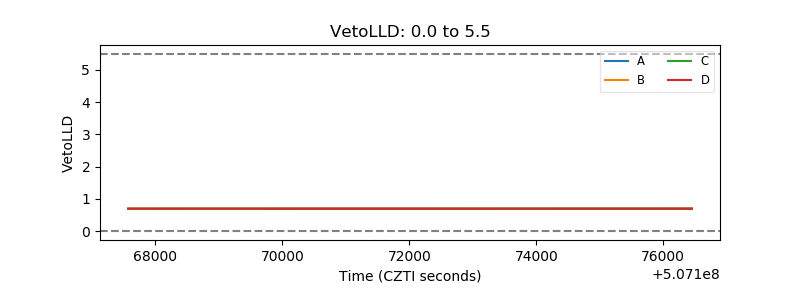 |
| Alpha Counter | 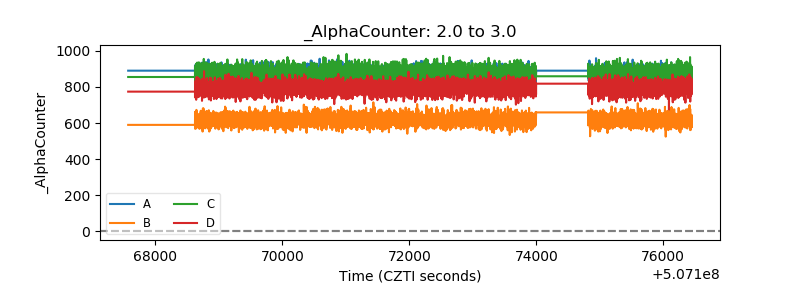 |
| _CPM_Rate | 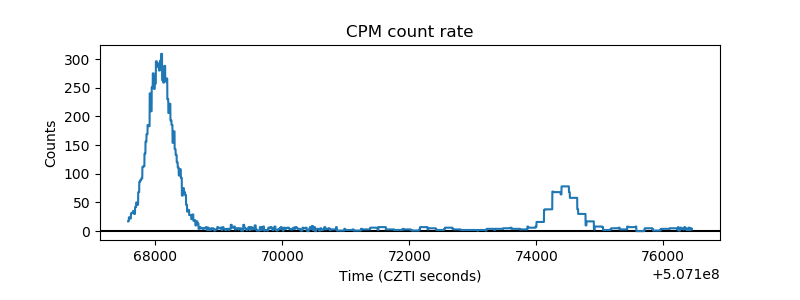 |
| CZT Counter | 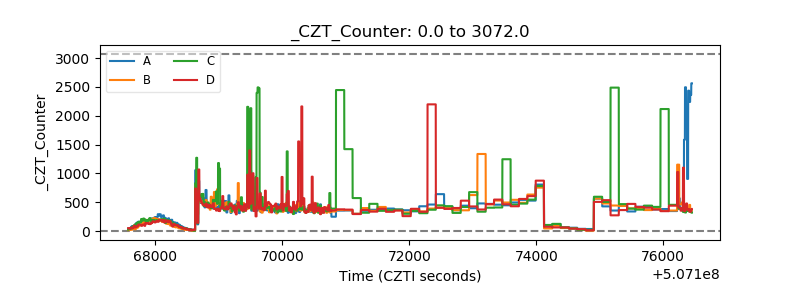 |
| +2.5 Volts monitor |  |
| +5 Volts monitor |  |
| _ROLL_ROT | 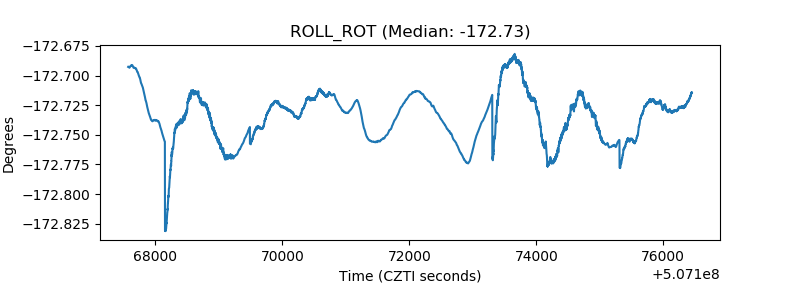 |
| _Roll_DEC | 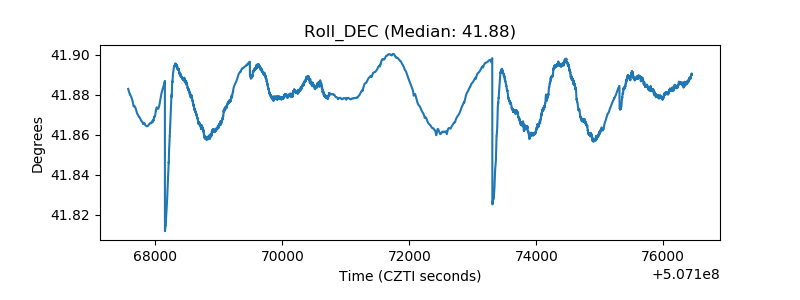 |
| _Roll_RA | 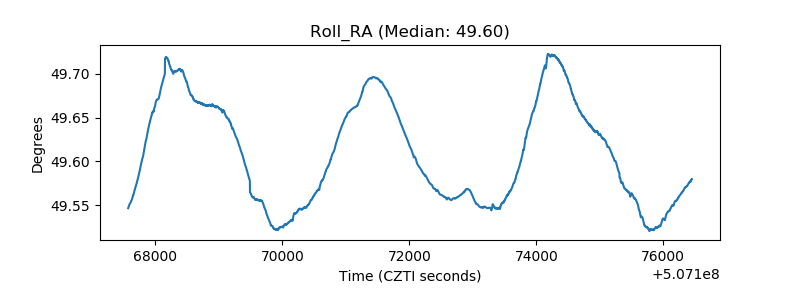 |
| Veto Counter | 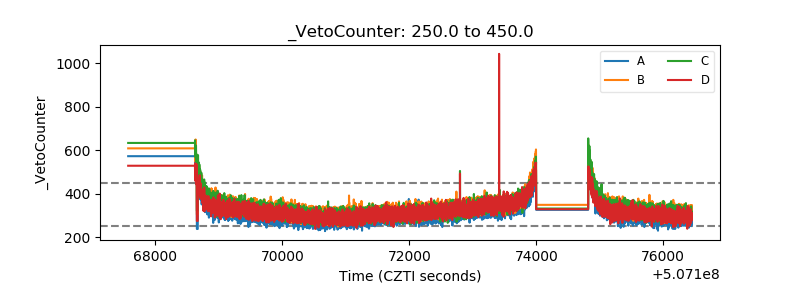 |