| Param | Original file | Final file |
|---|---|---|
| Filename | modeM0/AS1A14_030T02_9000006544_55900cztM0_level2.fits | modeM0/AS1A14_030T02_9000006544_55900cztM0_level2_quad_clean.evt |
| Size (bytes) | 429,065,280 | 104,091,840 |
| Size | 409.2 MB | 99.3 MB |
| Events in quadrant A | 3,628,055 | 675,702 |
| Events in quadrant B | 3,361,650 | 720,628 |
| Events in quadrant C | 4,680,658 | 619,891 |
| Events in quadrant D | 3,634,040 | 619,153 |
| Mode SS | |||
|---|---|---|---|
| Quadrant | BADHDUFLAG | Total packets | Discarded packets |
| A | 0 | 150 | 0 |
| B | 0 | 150 | 0 |
| C | 0 | 150 | 0 |
| D | 0 | 150 | 0 |
| Mode M9 | |||
|---|---|---|---|
| Quadrant | BADHDUFLAG | Total packets | Discarded packets |
| A | 0 | 3 | 0 |
| B | 0 | 3 | 0 |
| C | 0 | 3 | 0 |
| D | 0 | 3 | 0 |
| Mode M0 | |||
|---|---|---|---|
| Quadrant | BADHDUFLAG | Total packets | Discarded packets |
| A | 0 | 16569 | 1 |
| B | 0 | 15782 | 1 |
| C | 0 | 19626 | 1 |
| D | 0 | 16461 | 1 |
| Quadrant | Total seconds | Saturated seconds | Saturation percentage |
|---|---|---|---|
| A | 7424 | 121 | 1.629849% |
| B | 7424 | 195 | 2.626616% |
| C | 7423 | 489 | 6.587633% |
| D | 7424 | 56 | 0.754310% |
Noise dominated data is calculated using 1-second bins in cleaned event files. If a bin has >2000 counts, and if more than 50% of those come from <1% of pixels, then it is considered to be noise-dominated and hence unusable.
| Quadrant | # 1 sec bins | Bins with >0 counts | Bins with >2000 counts | High rate bins dominated by noise | Noise dominated (total time) | Noise dominated (detector-on time) | Marked lightcurve |
|---|---|---|---|---|---|---|---|
| A | 7684 | 7425 | 90 | 90 | 1.17% | 1.21% | 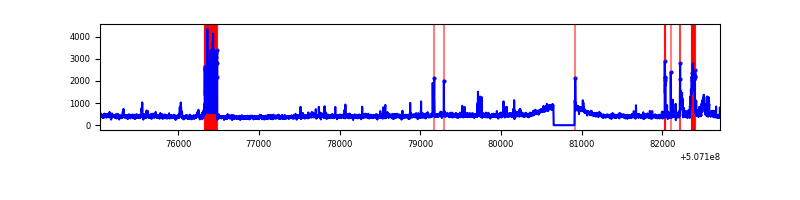 |
| B | 7684 | 7425 | 15 | 15 | 0.20% | 0.20% | 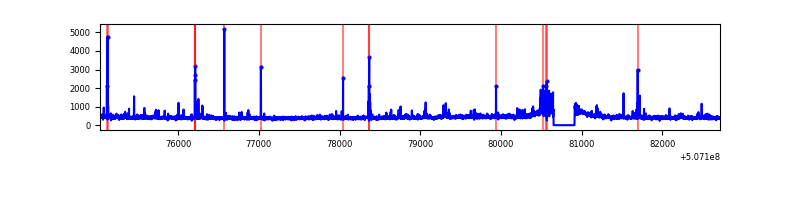 |
| C | 7683 | 7424 | 394 | 394 | 5.13% | 5.31% | 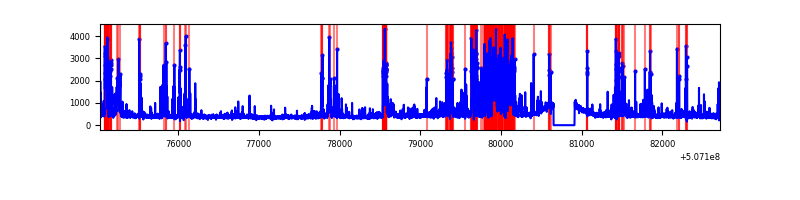 |
| D | 7684 | 7425 | 53 | 53 | 0.69% | 0.71% | 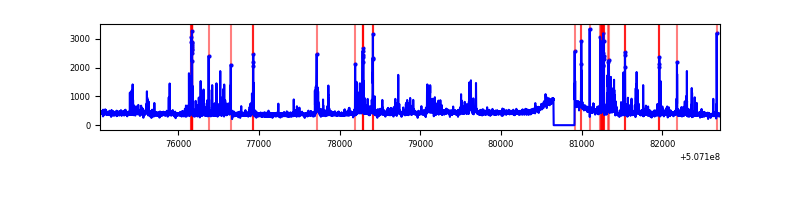 |
Top three noisy pixels from each quadrant. If the there are fewer than three noisy pixels in the level2.evt file, extra rows are filled as -1
| Pixel properties | Quadrant properties | ||||||
|---|---|---|---|---|---|---|---|
| Quadrant | DetID | PixID | Counts | Sigma | Mean | Median | Sigma |
| A | 7 | 64 | 237687 | 1253.09 | 774 | 751 | 189.1 |
| A | 12 | 115 | 226255 | 1192.63 | 774 | 751 | 189.1 |
| A | 3 | 14 | 92916 | 487.44 | 774 | 751 | 189.1 |
| B | 7 | 252 | 85594 | 511.38 | 769 | 737 | 165.9 |
| B | 0 | 213 | 74604 | 445.15 | 769 | 737 | 165.9 |
| B | 0 | 199 | 54321 | 322.92 | 769 | 737 | 165.9 |
| C | 15 | 199 | 1086587 | 5399.63 | 737 | 730 | 201.1 |
| C | 12 | 252 | 302426 | 1500.24 | 737 | 730 | 201.1 |
| C | 6 | 223 | 225328 | 1116.86 | 737 | 730 | 201.1 |
| D | 2 | 31 | 356611 | 1677.51 | 753 | 716 | 212.2 |
| D | 15 | 125 | 75930 | 354.52 | 753 | 716 | 212.2 |
| D | 8 | 160 | 66369 | 309.45 | 753 | 716 | 212.2 |
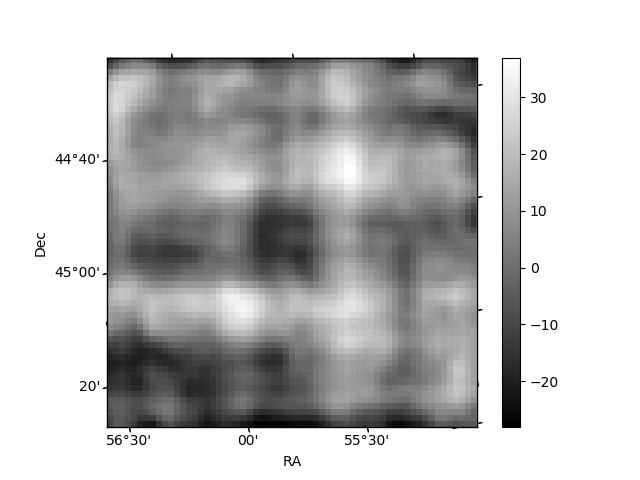
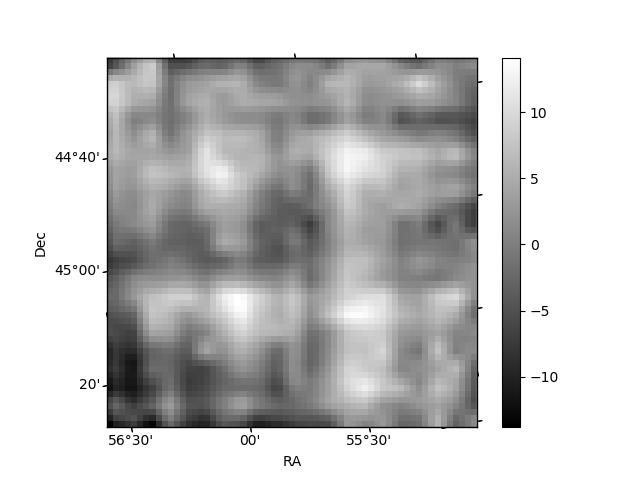
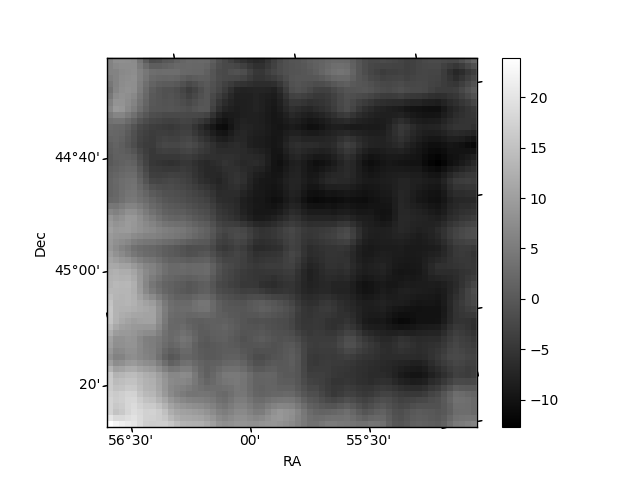
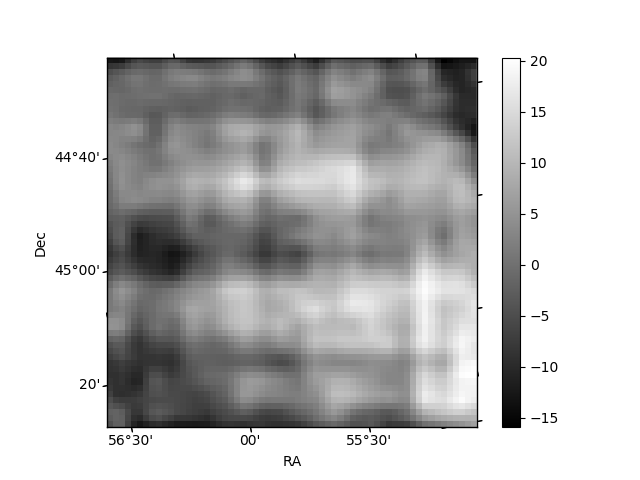
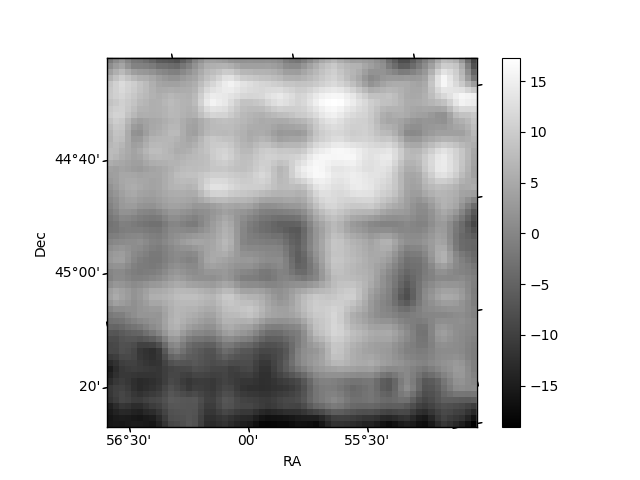
Histogram calculated using DETX and DETY for each event in the final _common_clean file
| Quadrant A | 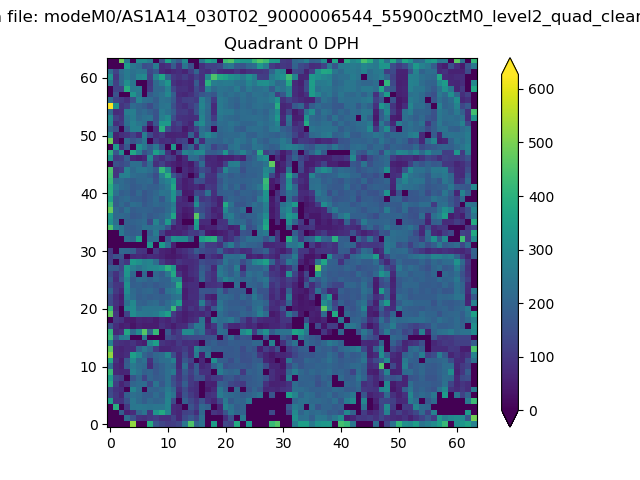 |
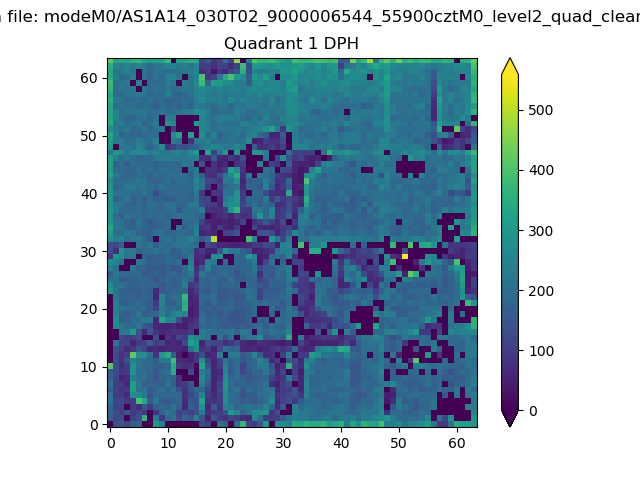 |
Quadrant B |
|---|---|---|---|
| Quadrant D | 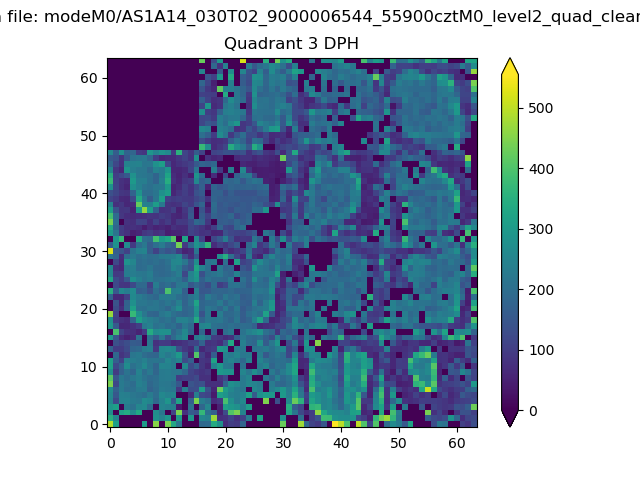 |
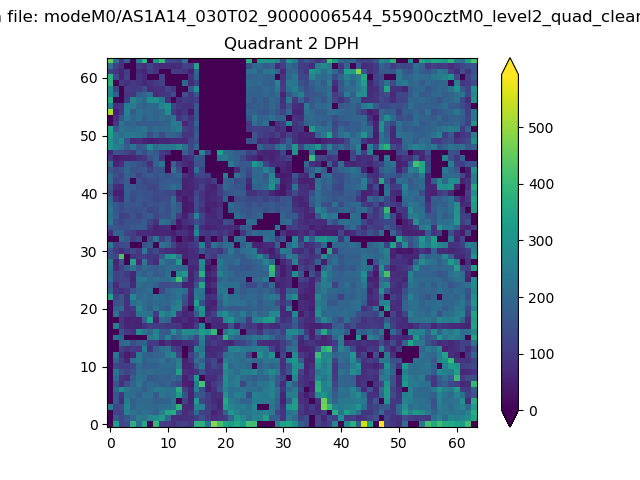 |
Quadrant C |
| Plot type | Count rate plots | Images |
|---|---|---|
| Comparison with Poisson distribution Blue bars denote a histogram of data divided into 1 sec bins. Red curve is a Poisson curve with rate = median count rate of data. |
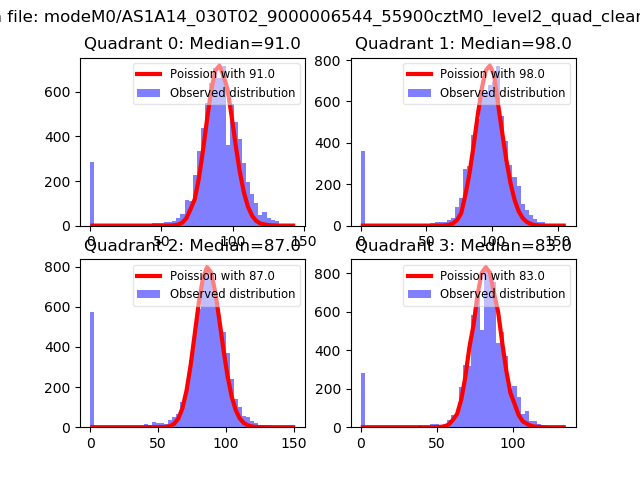 |
 |
| Quadrant-wise count rates Data is divided into 100 sec bins |
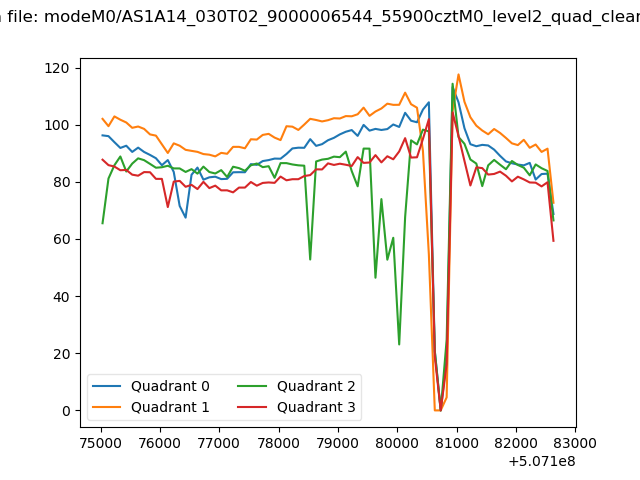 |
|
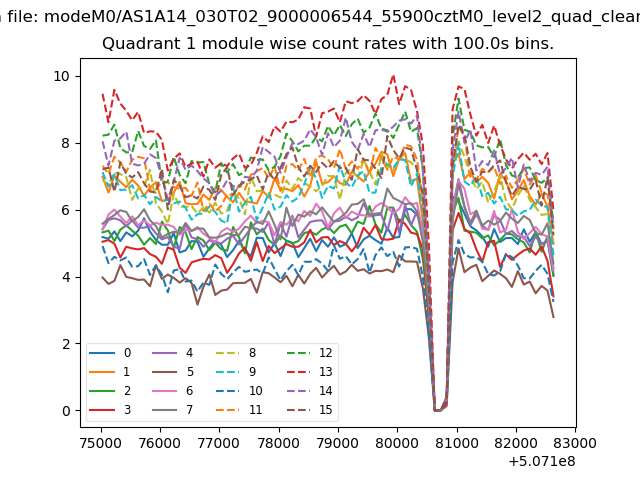
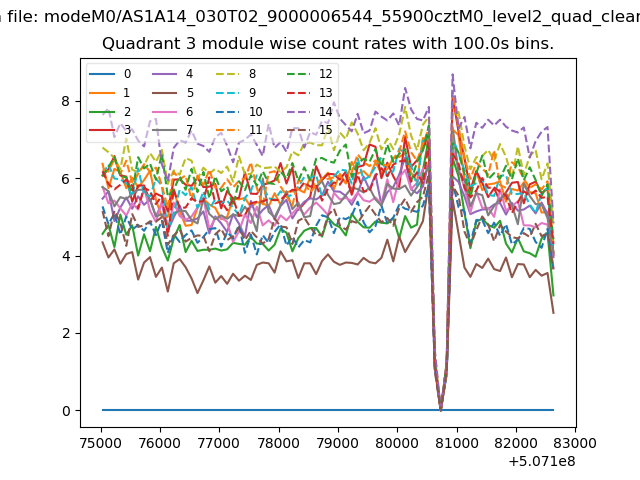
| Module-wise count rates for Quadrant A Data is divided into 100 sec bins |
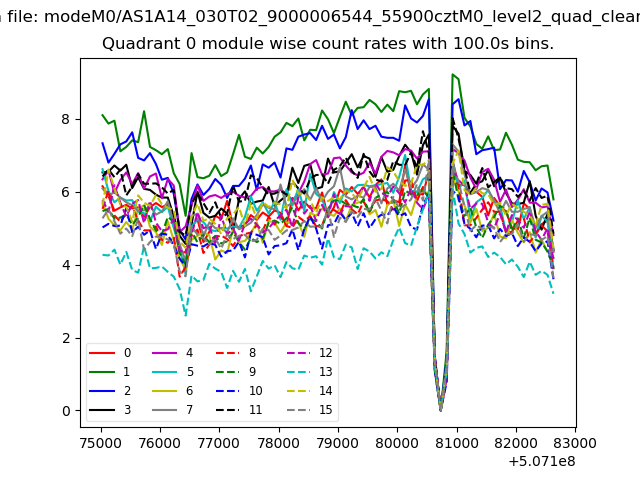 |
 |
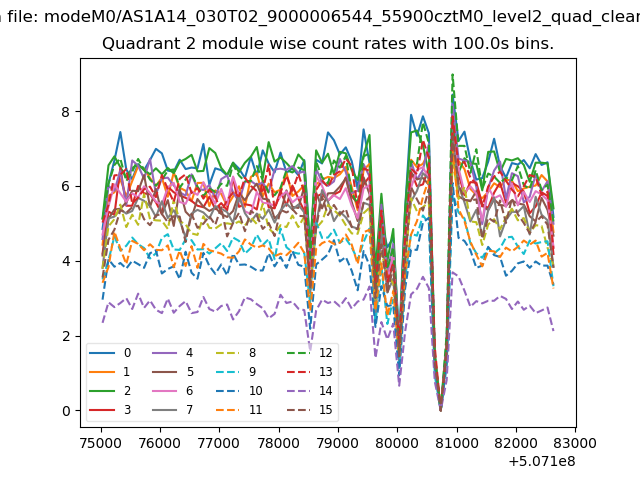
| Module-wise count rates for Quadrant B Data is divided into 100 sec bins |
 |
 |
| Module-wise count rates for Quadrant C Data is divided into 100 sec bins |
 |
 |
| Module-wise count rates for Quadrant D Data is divided into 100 sec bins |
 |
 |
| Parameter | Plot |
|---|---|
| CZT HV Monitor | 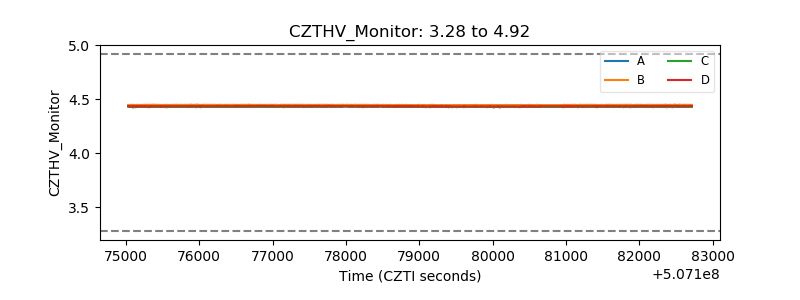 |
| D_VDD | 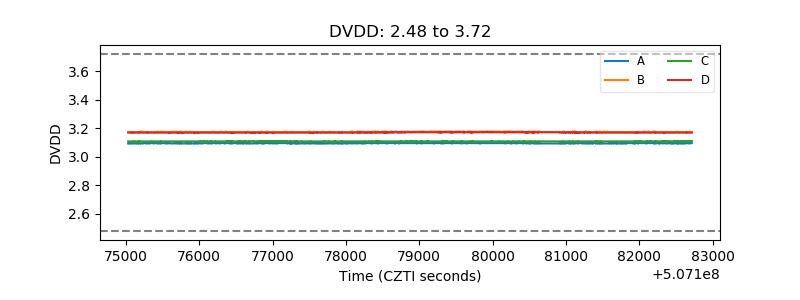 |
| Temperature 1 | 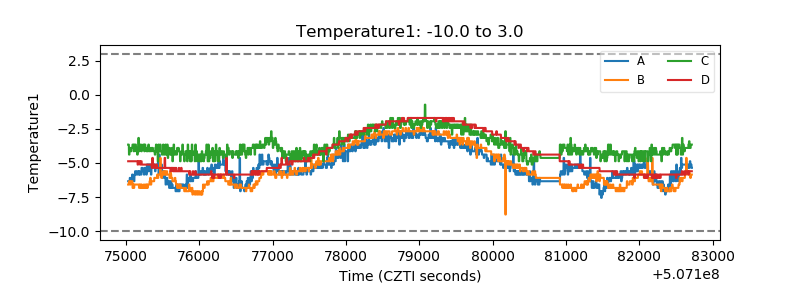 |
| Veto HV Monitor | 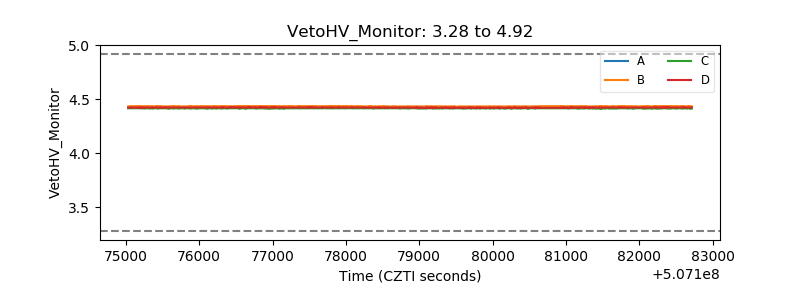 |
| Veto LLD | 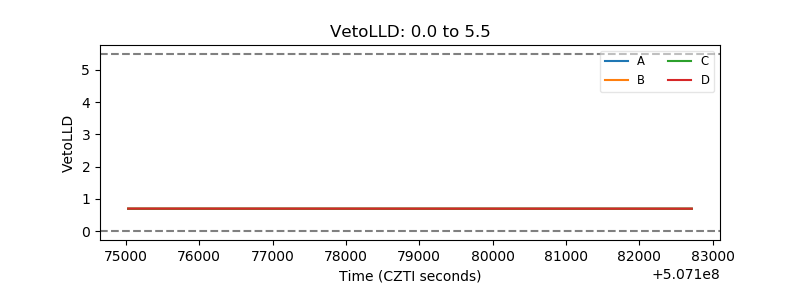 |
| Alpha Counter | 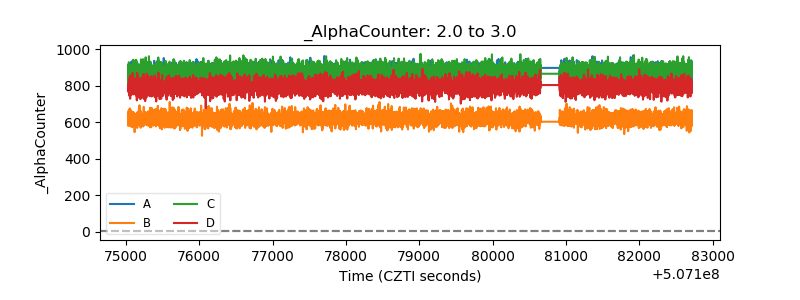 |
| _CPM_Rate | 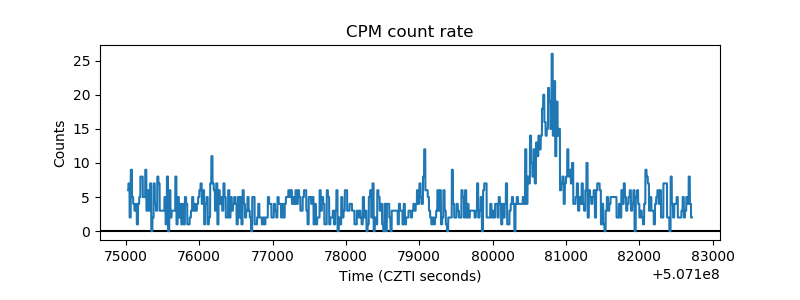 |
| CZT Counter | 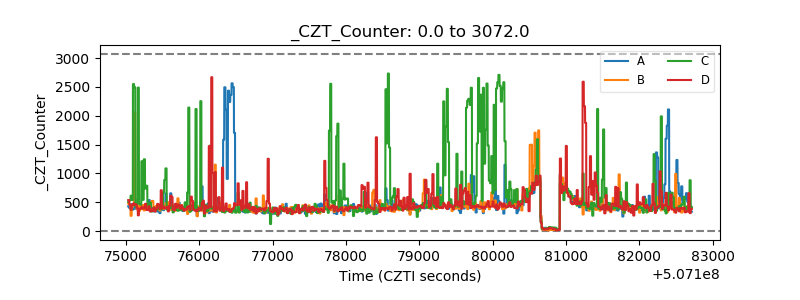 |
| +2.5 Volts monitor | 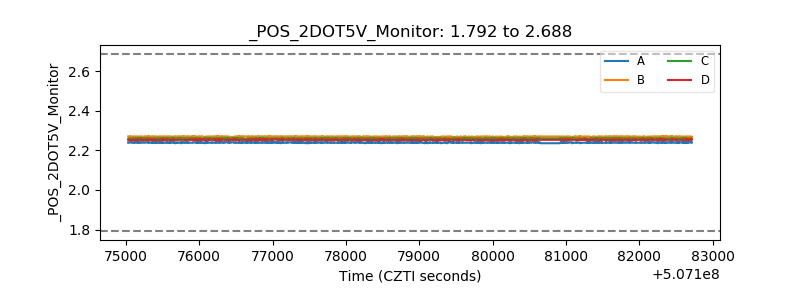 |
| +5 Volts monitor |  |
| _ROLL_ROT | 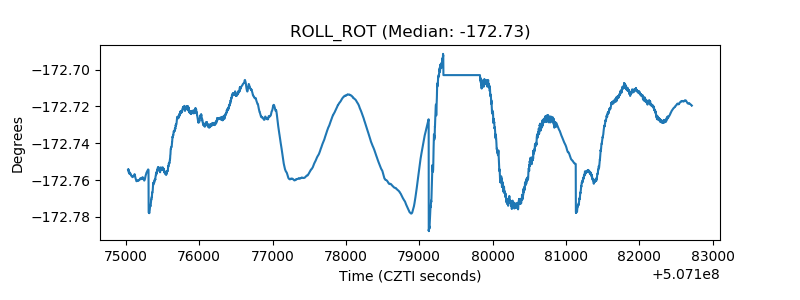 |
| _Roll_DEC | 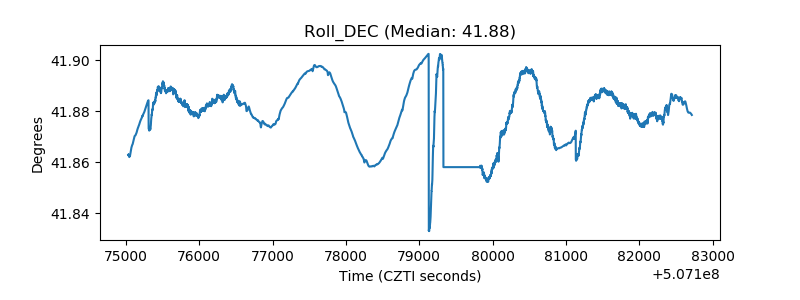 |
| _Roll_RA | 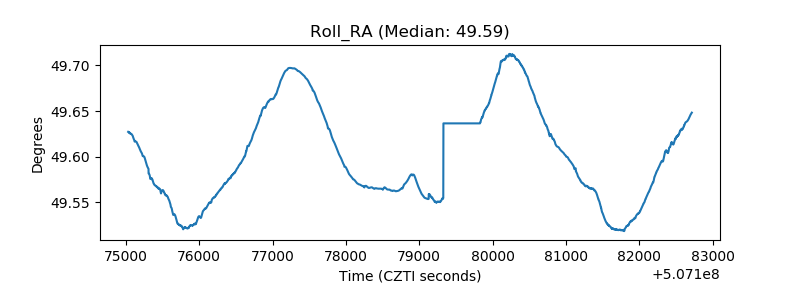 |
| Veto Counter | 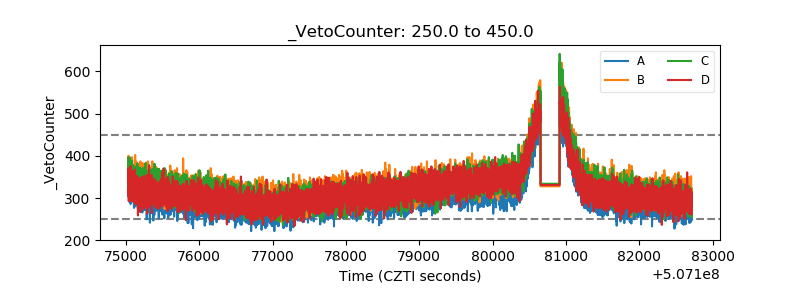 |