| Param | Original file | Final file |
|---|---|---|
| Filename | modeM0/AS1A14_030T02_9000006544_55901cztM0_level2.fits | modeM0/AS1A14_030T02_9000006544_55901cztM0_level2_quad_clean.evt |
| Size (bytes) | 560,355,840 | 123,088,320 |
| Size | 534.4 MB | 117.4 MB |
| Events in quadrant A | 4,054,528 | 806,988 |
| Events in quadrant B | 4,158,818 | 861,173 |
| Events in quadrant C | 5,748,231 | 743,980 |
| Events in quadrant D | 6,101,179 | 707,386 |
| Mode SS | |||
|---|---|---|---|
| Quadrant | BADHDUFLAG | Total packets | Discarded packets |
| A | 0 | 176 | 0 |
| B | 0 | 176 | 0 |
| C | 0 | 176 | 0 |
| D | 0 | 176 | 0 |
| Mode M9 | |||
|---|---|---|---|
| Quadrant | BADHDUFLAG | Total packets | Discarded packets |
| A | 0 | 3 | 0 |
| B | 0 | 3 | 0 |
| C | 0 | 3 | 0 |
| D | 0 | 3 | 0 |
| Mode M0 | |||
|---|---|---|---|
| Quadrant | BADHDUFLAG | Total packets | Discarded packets |
| A | 0 | 18744 | 1 |
| B | 0 | 18986 | 1 |
| C | 0 | 23476 | 1 |
| D | 0 | 24496 | 1 |
| Quadrant | Total seconds | Saturated seconds | Saturation percentage |
|---|---|---|---|
| A | 8753 | 73 | 0.834000% |
| B | 8752 | 220 | 2.513711% |
| C | 8752 | 553 | 6.318556% |
| D | 8752 | 409 | 4.673218% |
Noise dominated data is calculated using 1-second bins in cleaned event files. If a bin has >2000 counts, and if more than 50% of those come from <1% of pixels, then it is considered to be noise-dominated and hence unusable.
| Quadrant | # 1 sec bins | Bins with >0 counts | Bins with >2000 counts | High rate bins dominated by noise | Noise dominated (total time) | Noise dominated (detector-on time) | Marked lightcurve |
|---|---|---|---|---|---|---|---|
| A | 9013 | 8754 | 37 | 37 | 0.41% | 0.42% | 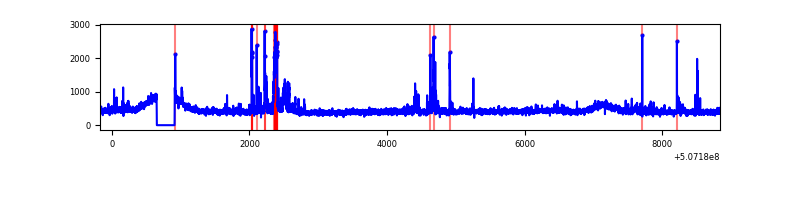 |
| B | 9012 | 8753 | 28 | 28 | 0.31% | 0.32% | 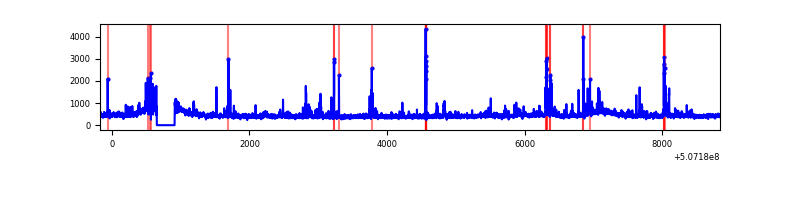 |
| C | 9012 | 8753 | 394 | 394 | 4.37% | 4.50% | 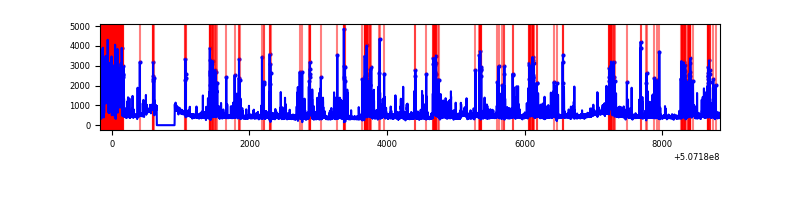 |
| D | 9012 | 8753 | 376 | 376 | 4.17% | 4.30% | 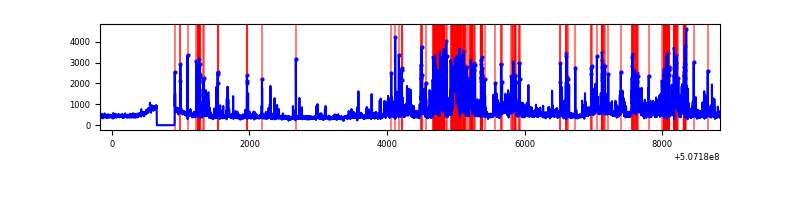 |
Top three noisy pixels from each quadrant. If the there are fewer than three noisy pixels in the level2.evt file, extra rows are filled as -1
| Pixel properties | Quadrant properties | ||||||
|---|---|---|---|---|---|---|---|
| Quadrant | DetID | PixID | Counts | Sigma | Mean | Median | Sigma |
| A | 12 | 115 | 198114 | 862.45 | 935 | 910 | 228.7 |
| A | 0 | 8 | 59986 | 258.36 | 935 | 910 | 228.7 |
| A | 3 | 14 | 52783 | 226.86 | 935 | 910 | 228.7 |
| B | 7 | 252 | 209712 | 1048.45 | 928 | 890 | 199.2 |
| B | 5 | 185 | 94471 | 469.85 | 928 | 890 | 199.2 |
| B | 0 | 199 | 66410 | 328.96 | 928 | 890 | 199.2 |
| C | 15 | 199 | 1023088 | 4213.1 | 894 | 886 | 242.6 |
| C | 12 | 252 | 710808 | 2926.01 | 894 | 886 | 242.6 |
| C | 13 | 3 | 336035 | 1381.34 | 894 | 886 | 242.6 |
| D | 11 | 129 | 912432 | 3639.29 | 894 | 854 | 250.5 |
| D | 15 | 125 | 844415 | 3367.75 | 894 | 854 | 250.5 |
| D | 2 | 31 | 479217 | 1909.77 | 894 | 854 | 250.5 |
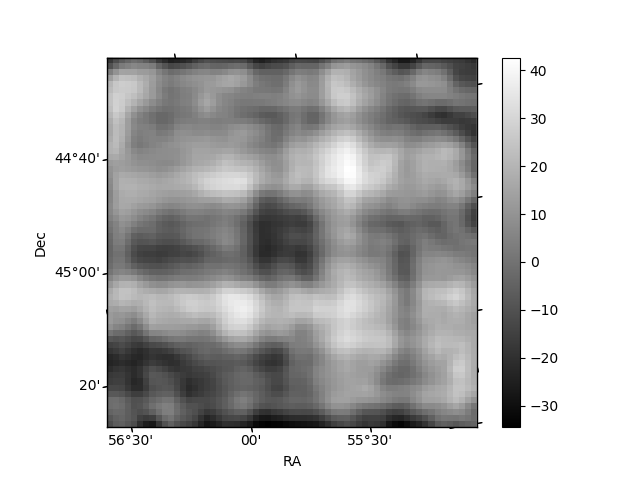
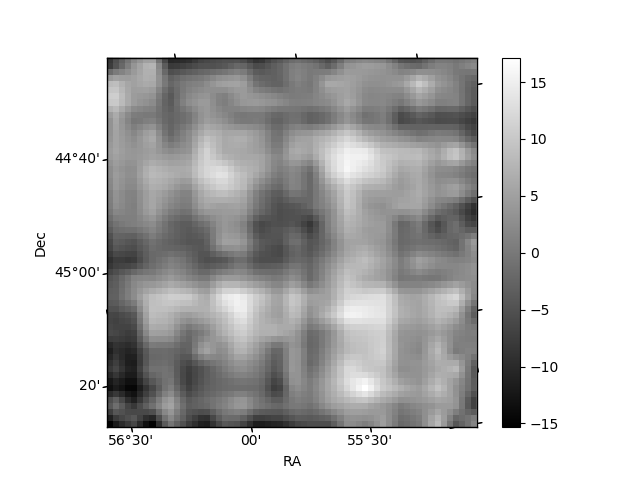
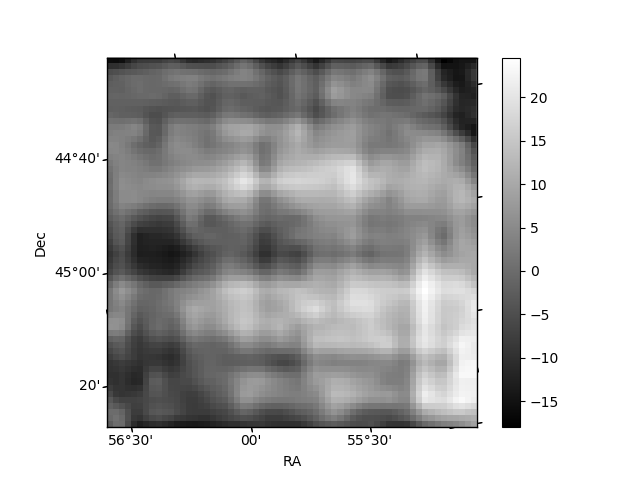
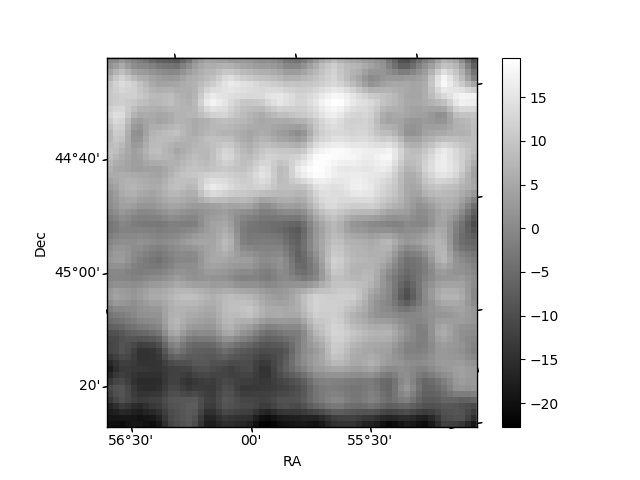
Histogram calculated using DETX and DETY for each event in the final _common_clean file
| Quadrant A | 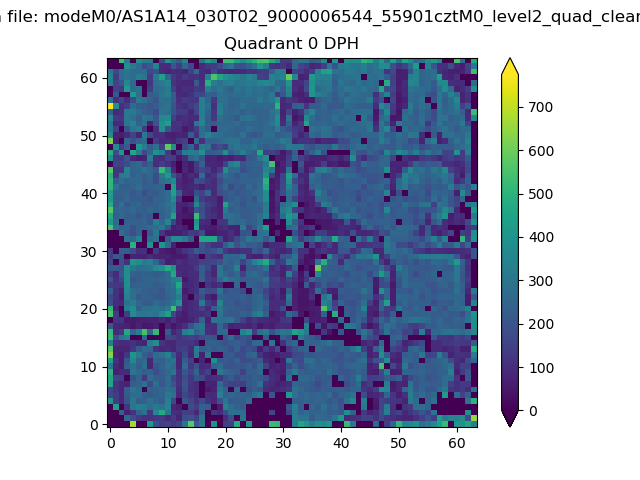 |
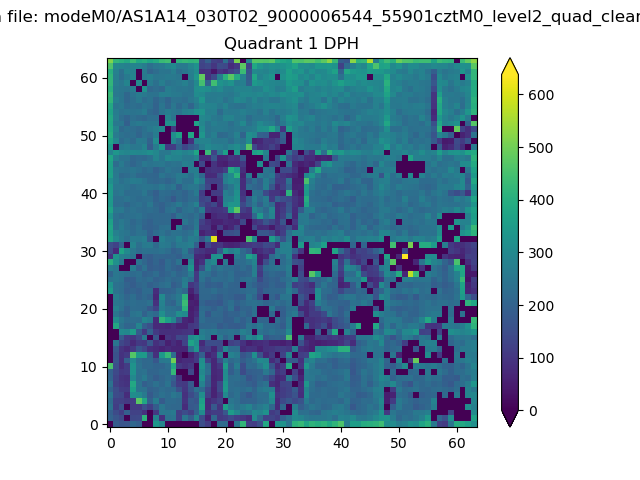 |
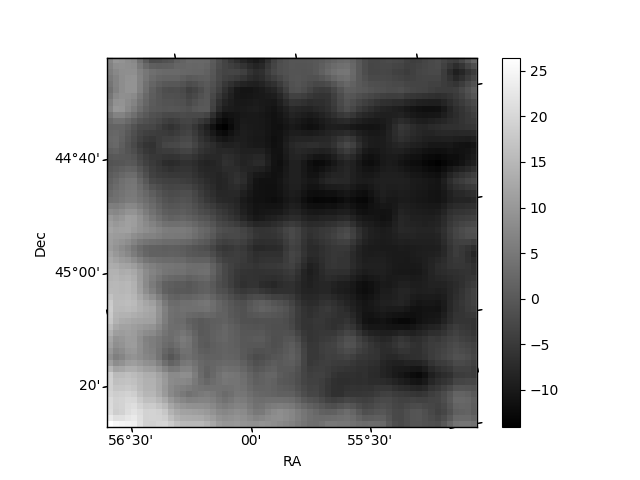
Quadrant B |
|---|---|---|---|
| Quadrant D | 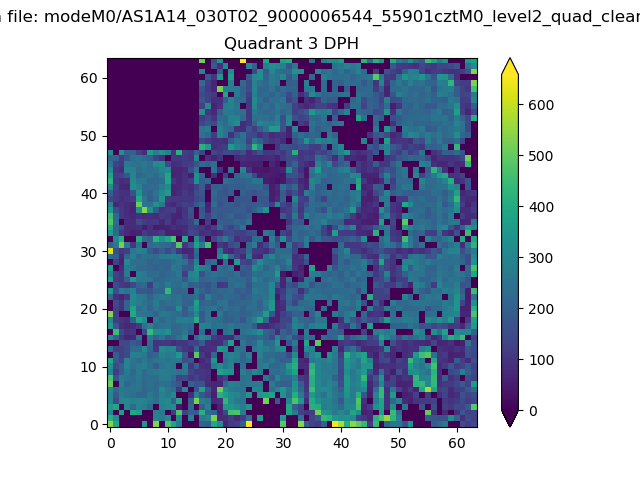 |
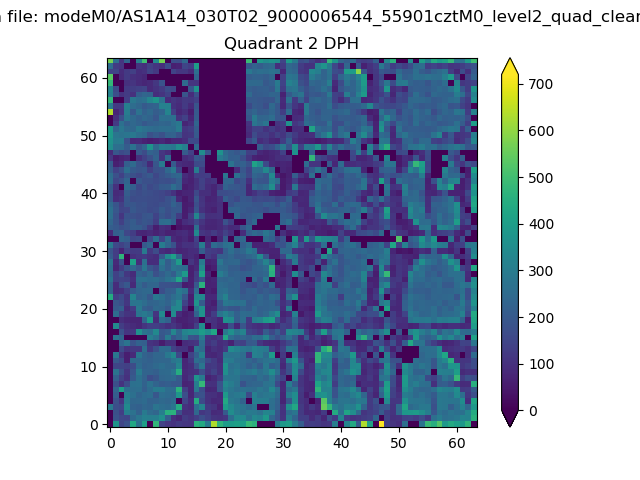 |
Quadrant C |
| Plot type | Count rate plots | Images |
|---|---|---|
| Comparison with Poisson distribution Blue bars denote a histogram of data divided into 1 sec bins. Red curve is a Poisson curve with rate = median count rate of data. |
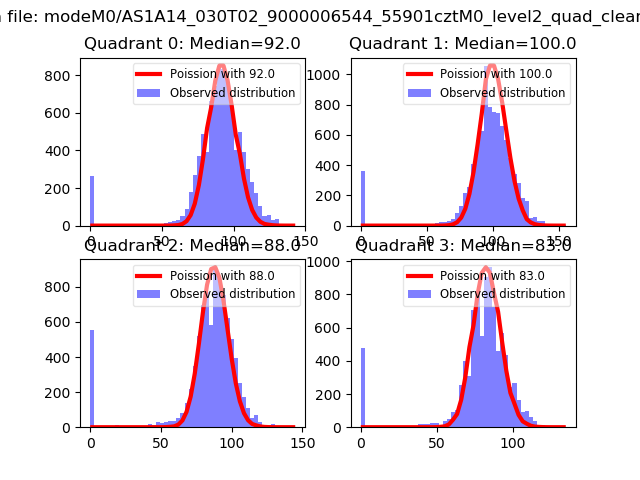 |
 |
| Quadrant-wise count rates Data is divided into 100 sec bins |
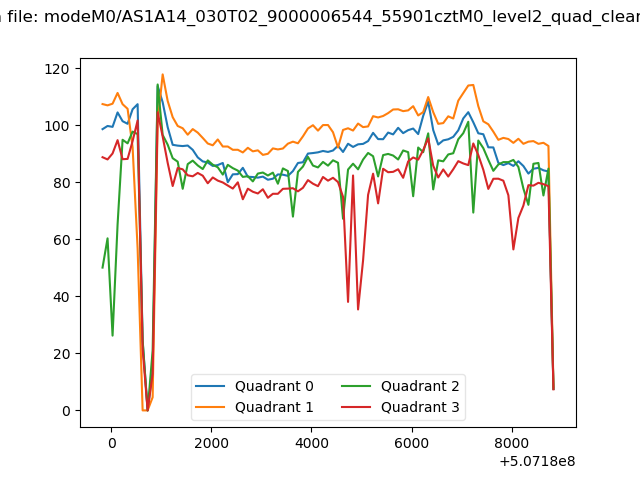 |
|
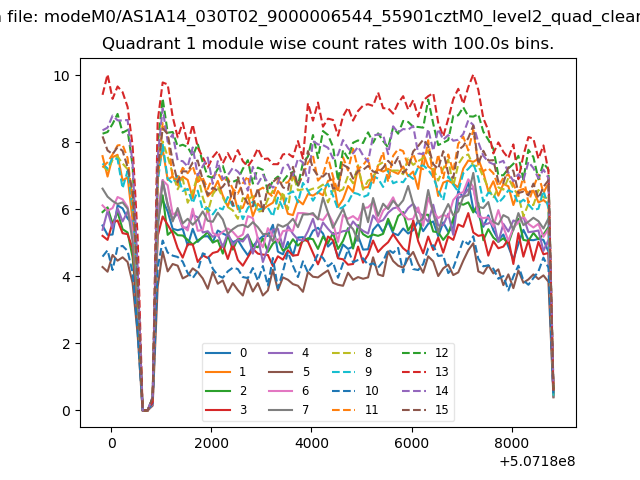
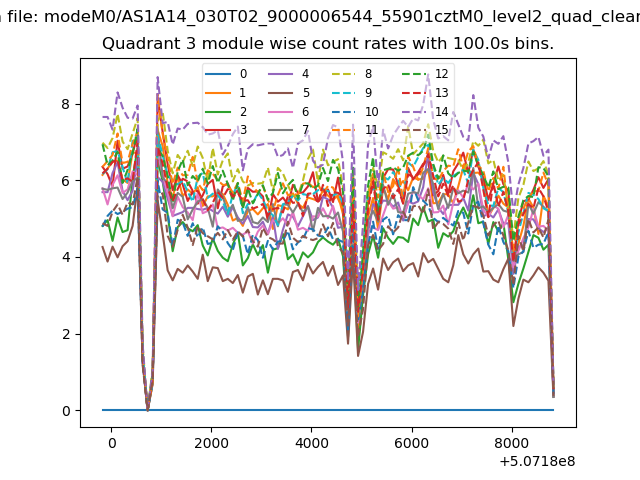
| Module-wise count rates for Quadrant A Data is divided into 100 sec bins |
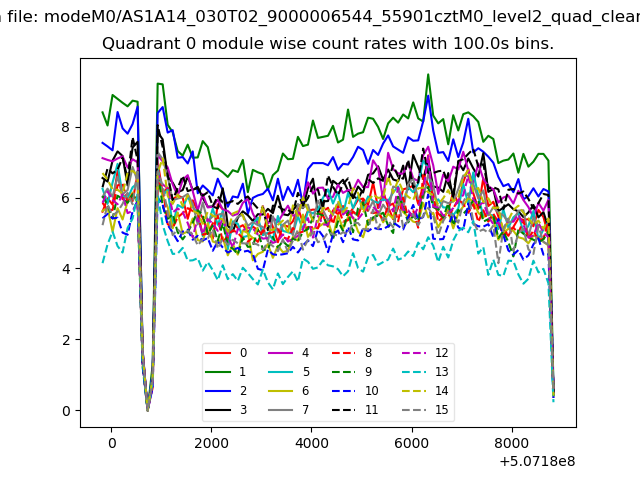 |
 |
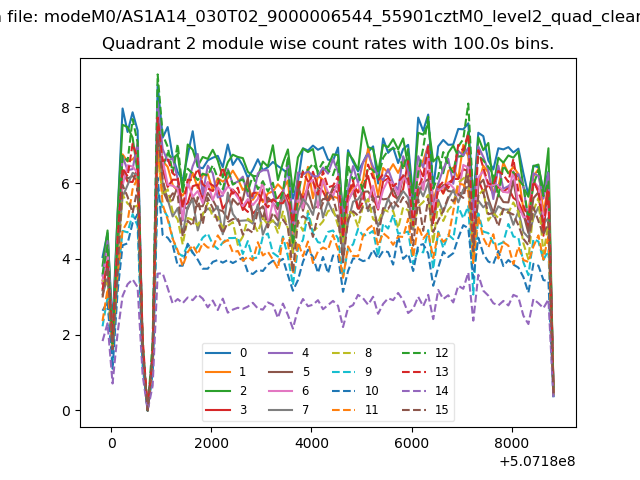
| Module-wise count rates for Quadrant B Data is divided into 100 sec bins |
 |
 |
| Module-wise count rates for Quadrant C Data is divided into 100 sec bins |
 |
 |
| Module-wise count rates for Quadrant D Data is divided into 100 sec bins |
 |
 |
| Parameter | Plot |
|---|---|
| CZT HV Monitor | 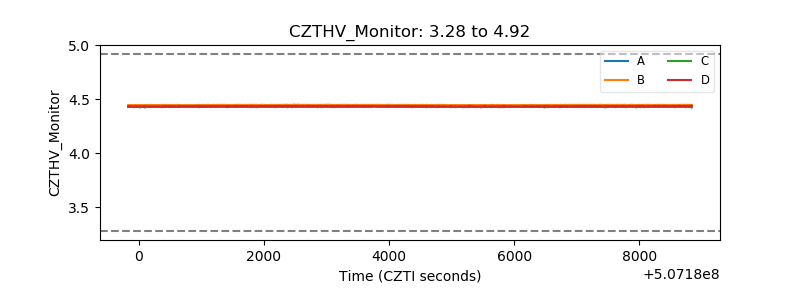 |
| D_VDD | 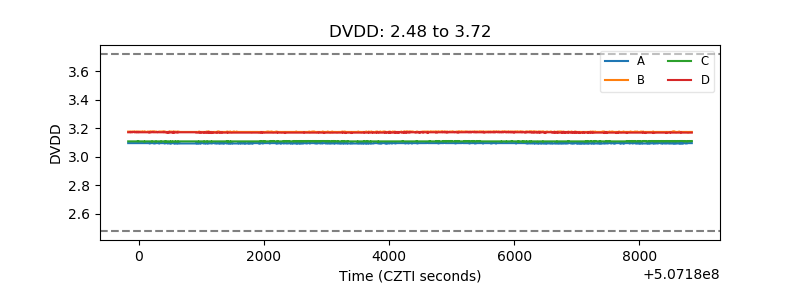 |
| Temperature 1 | 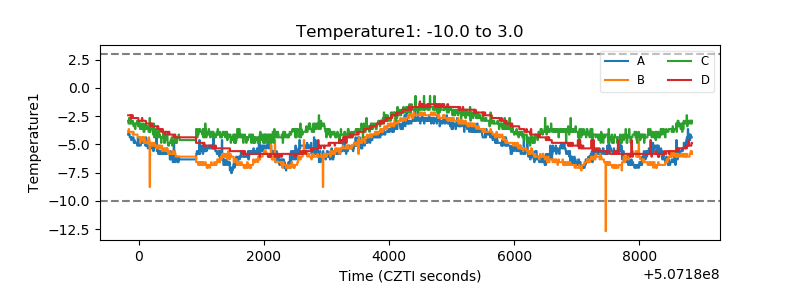 |
| Veto HV Monitor | 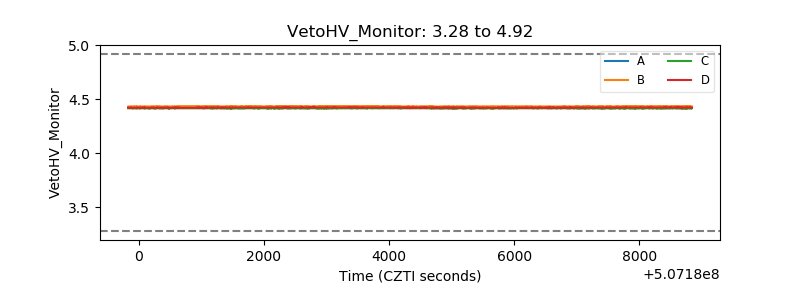 |
| Veto LLD | 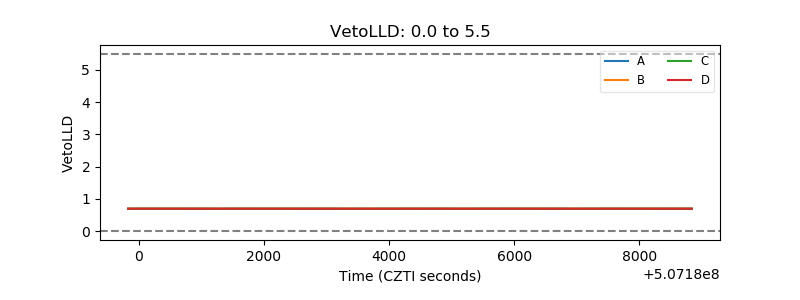 |
| Alpha Counter | 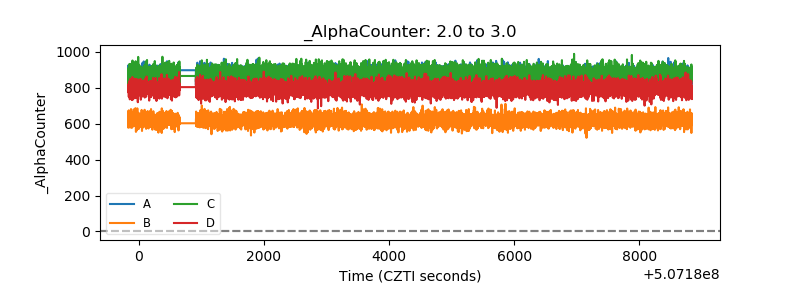 |
| _CPM_Rate | 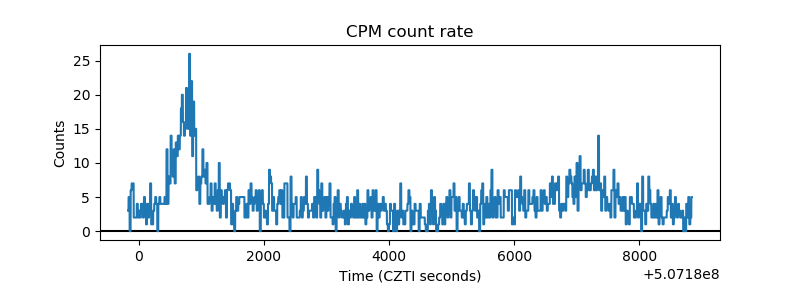 |
| CZT Counter | 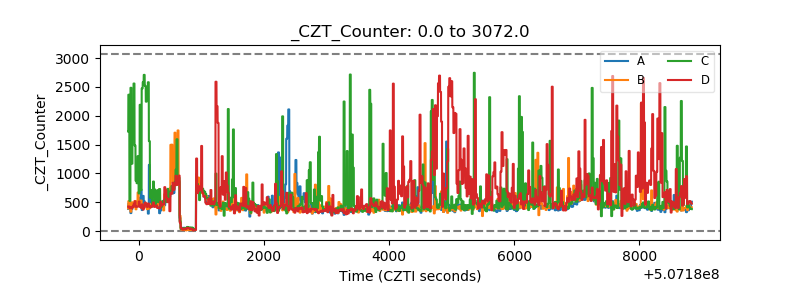 |
| +2.5 Volts monitor |  |
| +5 Volts monitor |  |
| _ROLL_ROT | 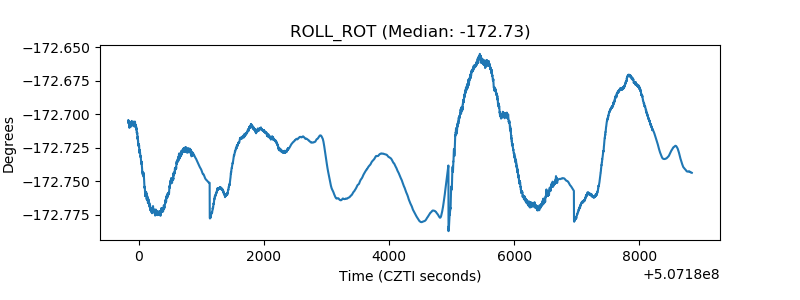 |
| _Roll_DEC | 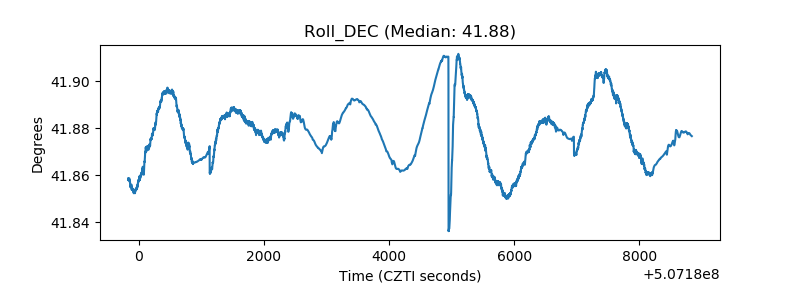 |
| _Roll_RA | 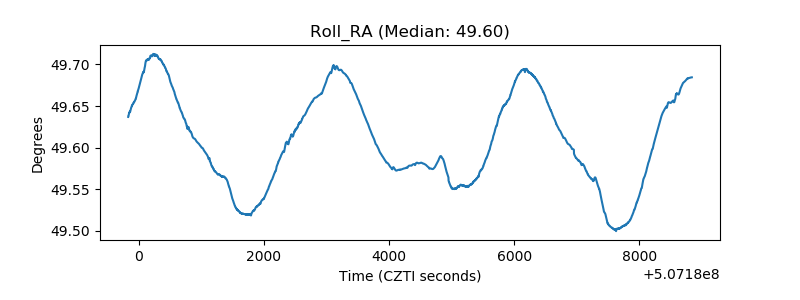 |
| Veto Counter | 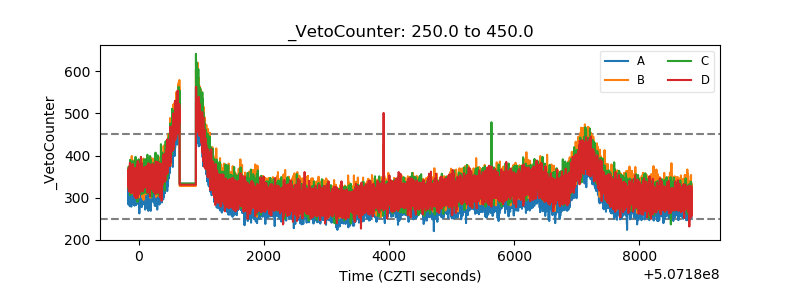 |