| Param | Original file | Final file |
|---|---|---|
| Filename | modeM0/AS1A14_030T02_9000006544_55902cztM0_level2.fits | modeM0/AS1A14_030T02_9000006544_55902cztM0_level2_quad_clean.evt |
| Size (bytes) | 644,351,040 | 122,872,320 |
| Size | 614.5 MB | 117.2 MB |
| Events in quadrant A | 4,678,122 | 804,223 |
| Events in quadrant B | 4,036,753 | 884,525 |
| Events in quadrant C | 5,515,572 | 768,886 |
| Events in quadrant D | 8,929,414 | 643,676 |
| Mode SS | |||
|---|---|---|---|
| Quadrant | BADHDUFLAG | Total packets | Discarded packets |
| A | 0 | 178 | 0 |
| B | 0 | 178 | 0 |
| C | 0 | 178 | 0 |
| D | 0 | 178 | 0 |
| Mode M0 | |||
|---|---|---|---|
| Quadrant | BADHDUFLAG | Total packets | Discarded packets |
| A | 0 | 20537 | 0 |
| B | 0 | 18715 | 0 |
| C | 0 | 22746 | 0 |
| D | 0 | 32726 | 0 |
| Quadrant | Total seconds | Saturated seconds | Saturation percentage |
|---|---|---|---|
| A | 8917 | 193 | 2.164405% |
| B | 8917 | 48 | 0.538298% |
| C | 8917 | 342 | 3.835371% |
| D | 8917 | 1266 | 14.197600% |
Noise dominated data is calculated using 1-second bins in cleaned event files. If a bin has >2000 counts, and if more than 50% of those come from <1% of pixels, then it is considered to be noise-dominated and hence unusable.
| Quadrant | # 1 sec bins | Bins with >0 counts | Bins with >2000 counts | High rate bins dominated by noise | Noise dominated (total time) | Noise dominated (detector-on time) | Marked lightcurve |
|---|---|---|---|---|---|---|---|
| A | 8917 | 8917 | 174 | 174 | 1.95% | 1.95% | 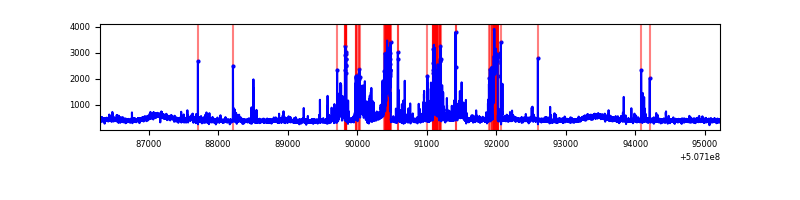 |
| B | 8917 | 8917 | 19 | 19 | 0.21% | 0.21% | 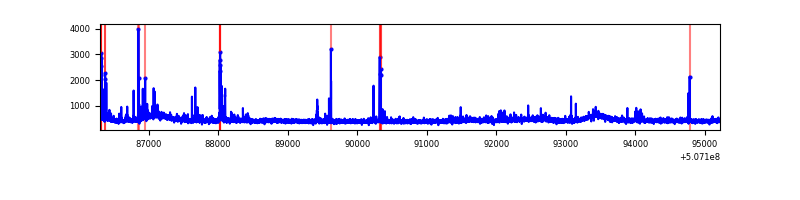 |
| C | 8917 | 8917 | 216 | 216 | 2.42% | 2.42% | 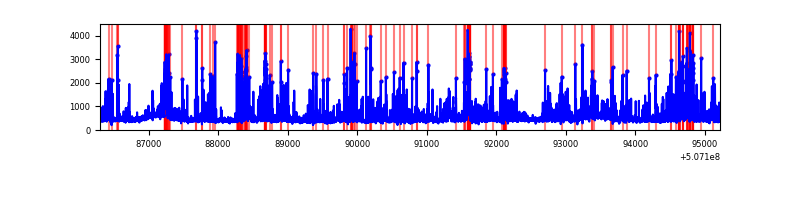 |
| D | 8917 | 8917 | 1138 | 1138 | 12.76% | 12.76% | 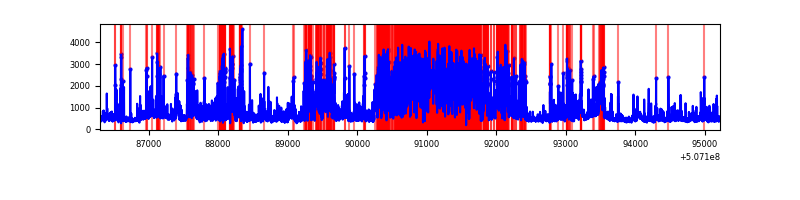 |
Top three noisy pixels from each quadrant. If the there are fewer than three noisy pixels in the level2.evt file, extra rows are filled as -1
| Pixel properties | Quadrant properties | ||||||
|---|---|---|---|---|---|---|---|
| Quadrant | DetID | PixID | Counts | Sigma | Mean | Median | Sigma |
| A | 4 | 249 | 726579 | 3184.5 | 927 | 899 | 227.9 |
| A | 15 | 32 | 217444 | 950.26 | 927 | 899 | 227.9 |
| A | 3 | 62 | 50215 | 216.41 | 927 | 899 | 227.9 |
| B | 7 | 252 | 113343 | 561.86 | 932 | 896 | 200.1 |
| B | 0 | 199 | 79357 | 392.05 | 932 | 896 | 200.1 |
| B | 5 | 185 | 49384 | 242.28 | 932 | 896 | 200.1 |
| C | 12 | 252 | 1097730 | 4477.71 | 903 | 896 | 245.0 |
| C | 13 | 3 | 403323 | 1642.87 | 903 | 896 | 245.0 |
| C | 15 | 199 | 331198 | 1348.42 | 903 | 896 | 245.0 |
| D | 11 | 129 | 4227513 | 17614.18 | 858 | 821 | 240.0 |
| D | 6 | 31 | 467275 | 1943.89 | 858 | 821 | 240.0 |
| D | 2 | 31 | 438466 | 1823.83 | 858 | 821 | 240.0 |
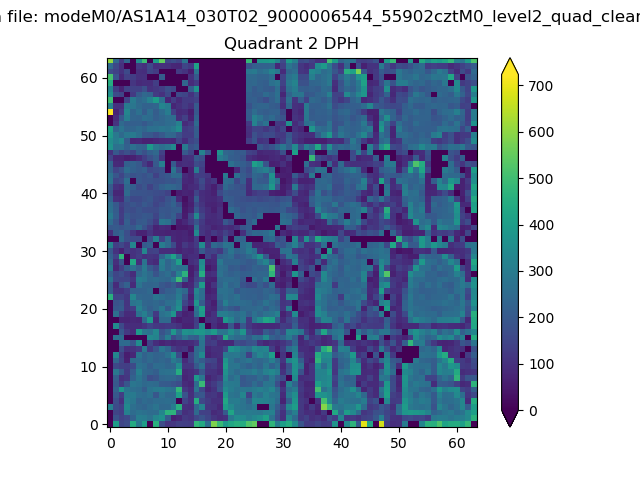
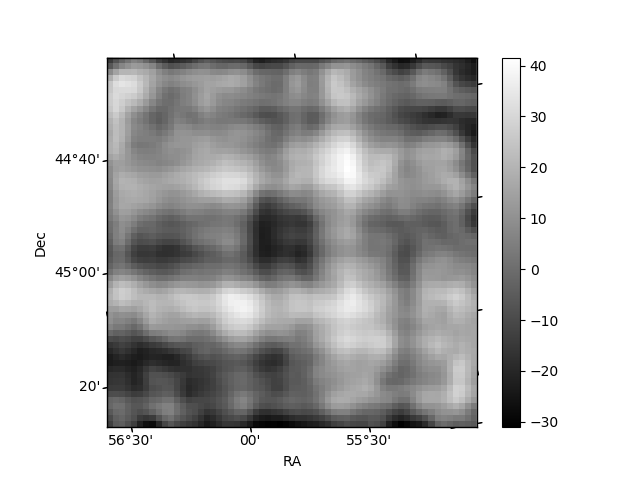
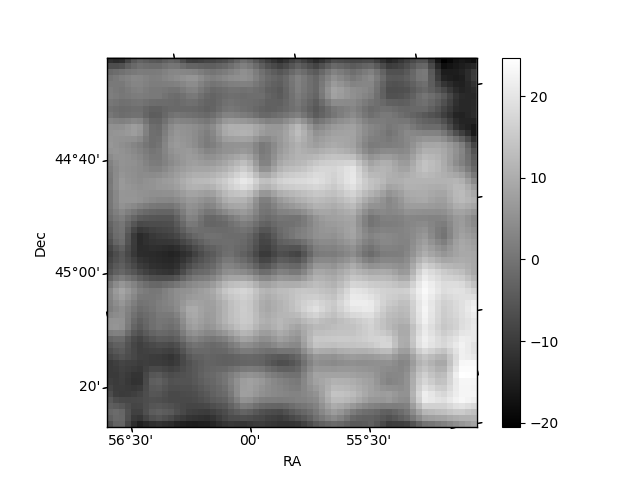
Histogram calculated using DETX and DETY for each event in the final _common_clean file
| Quadrant A | 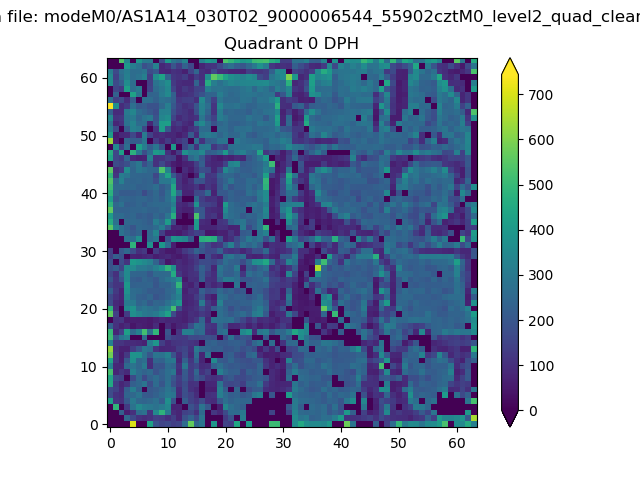 |
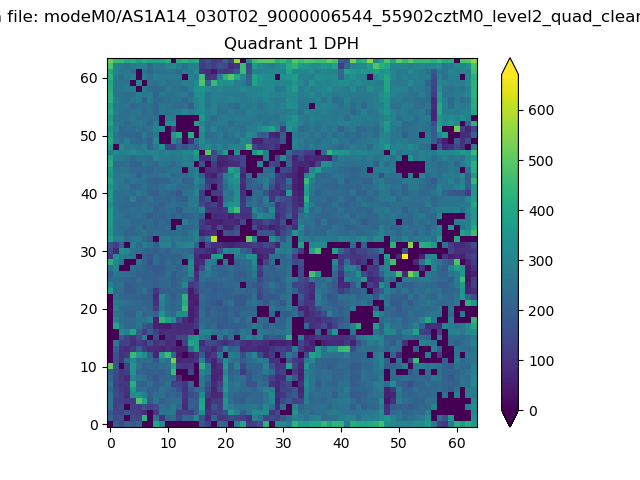 |
Quadrant B |
|---|---|---|---|
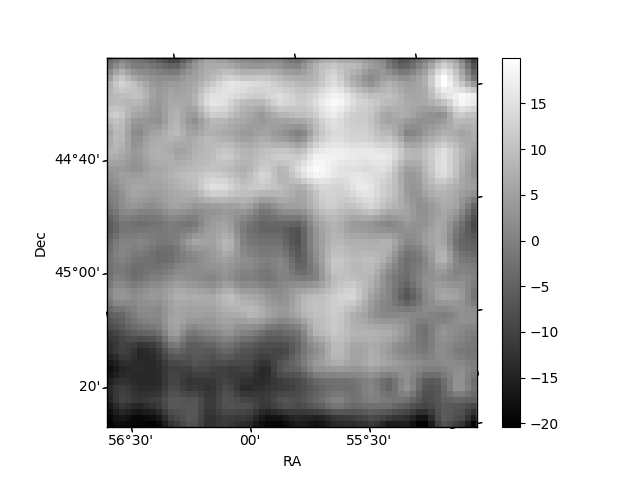
| Quadrant D | 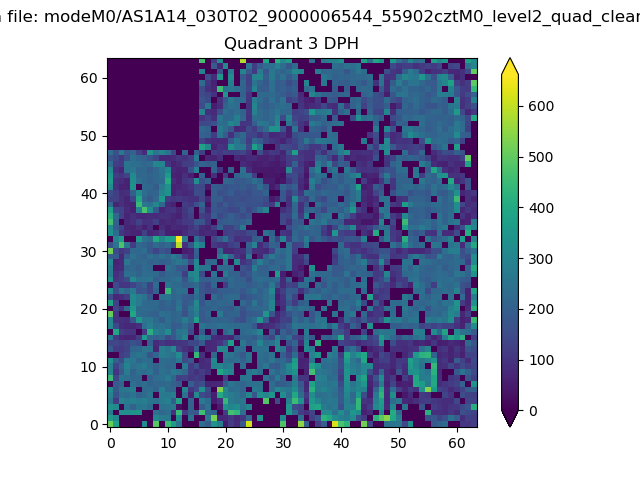 |
 |
Quadrant C |
| Plot type | Count rate plots | Images |
|---|---|---|
| Comparison with Poisson distribution Blue bars denote a histogram of data divided into 1 sec bins. Red curve is a Poisson curve with rate = median count rate of data. |
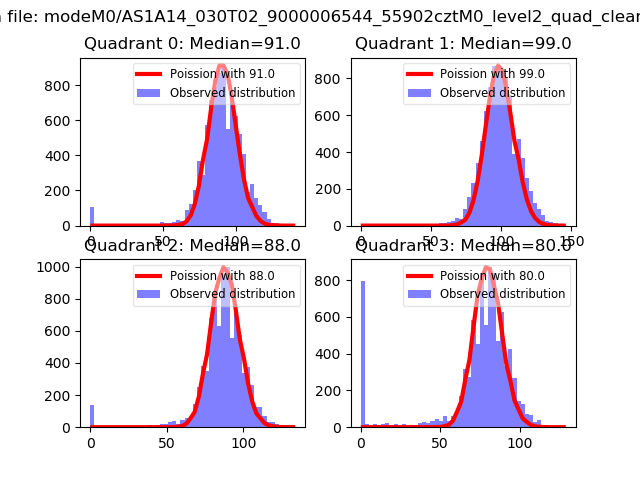 |
 |
| Quadrant-wise count rates Data is divided into 100 sec bins |
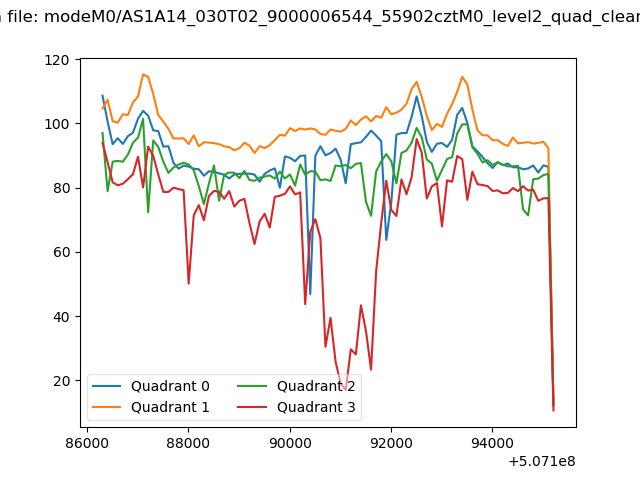 |
|
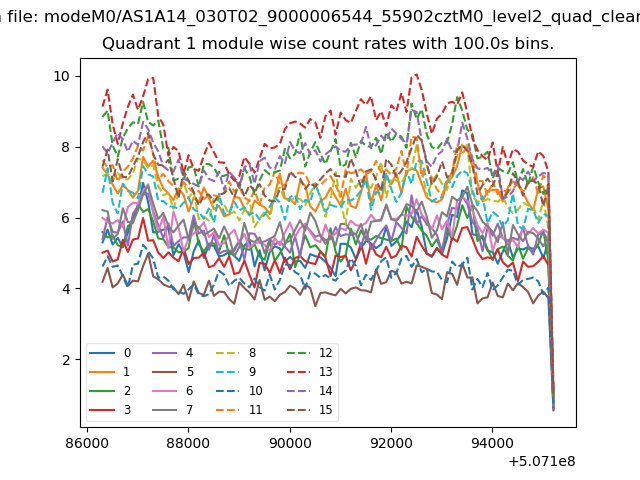
| Module-wise count rates for Quadrant A Data is divided into 100 sec bins |
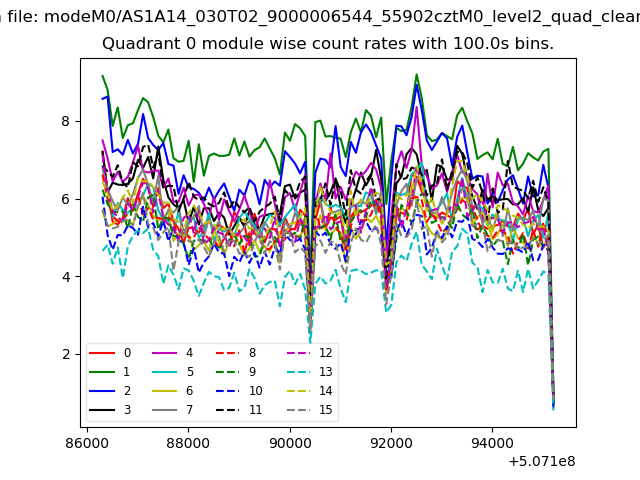 |
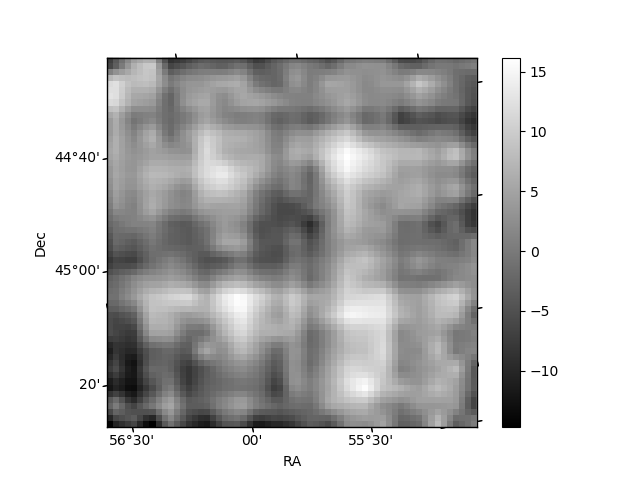 |
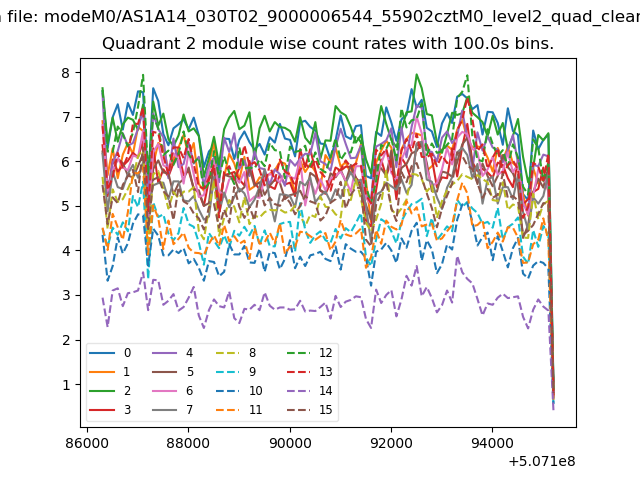
| Module-wise count rates for Quadrant B Data is divided into 100 sec bins |
 |
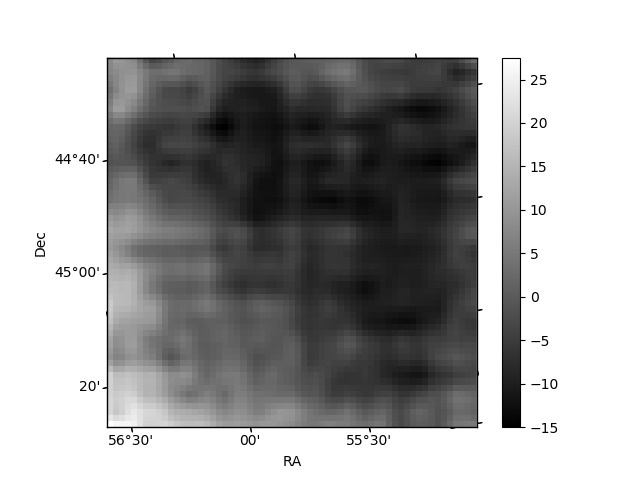 |
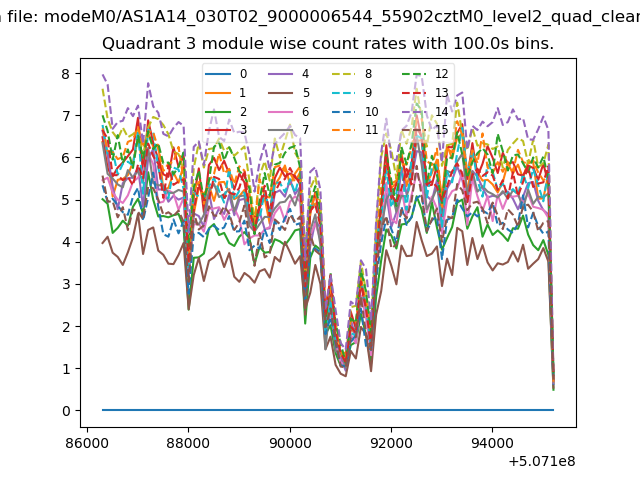
| Module-wise count rates for Quadrant C Data is divided into 100 sec bins |
 |
 |
| Module-wise count rates for Quadrant D Data is divided into 100 sec bins |
 |
 |
| Parameter | Plot |
|---|---|
| CZT HV Monitor | 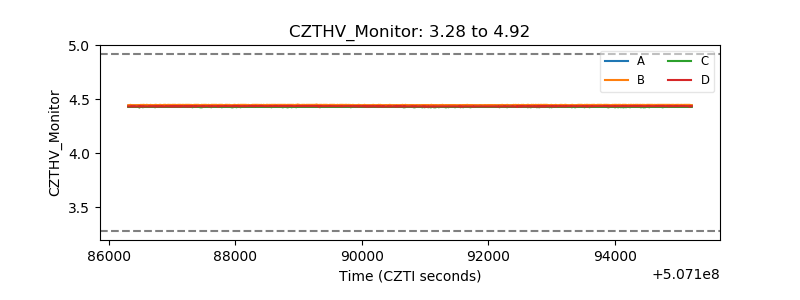 |
| D_VDD | 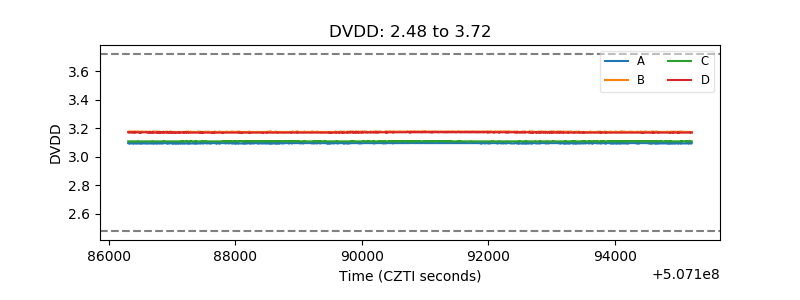 |
| Temperature 1 | 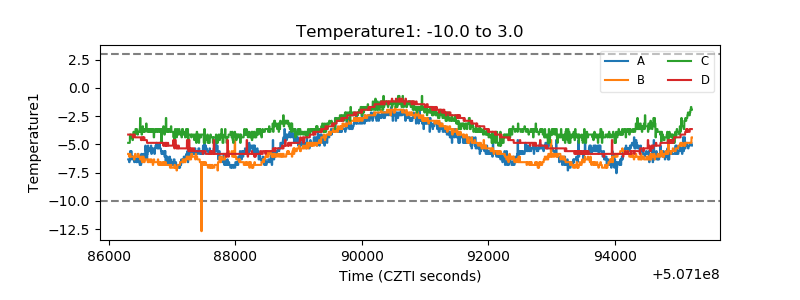 |
| Veto HV Monitor | 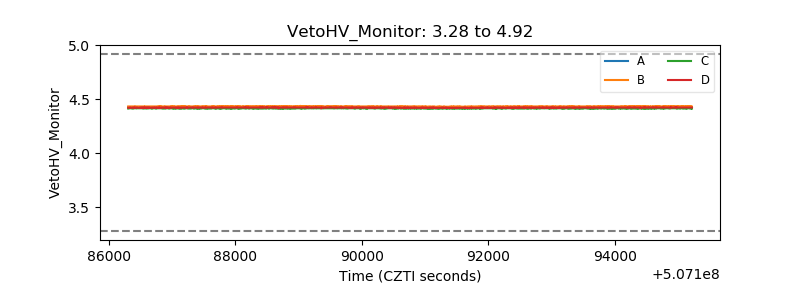 |
| Veto LLD | 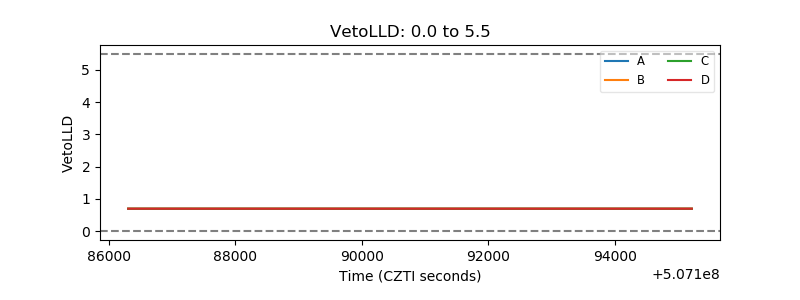 |
| Alpha Counter | 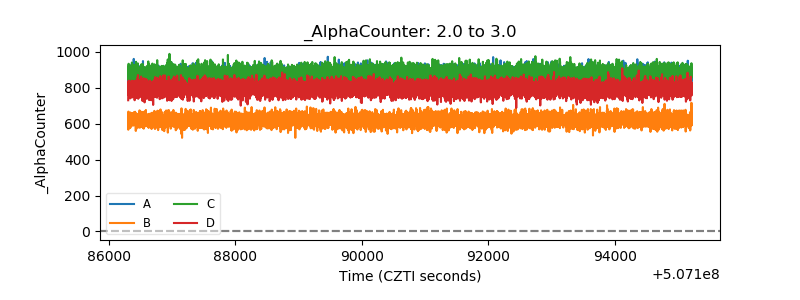 |
| _CPM_Rate | 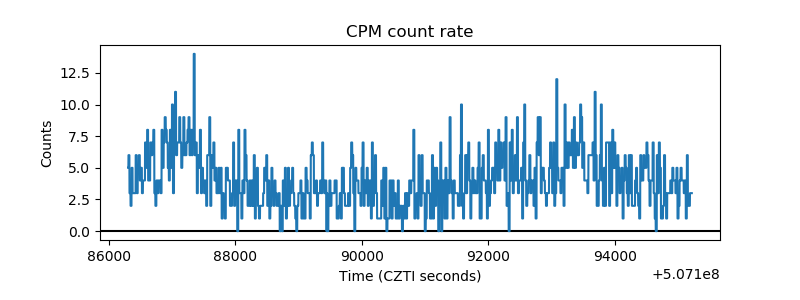 |
| CZT Counter | 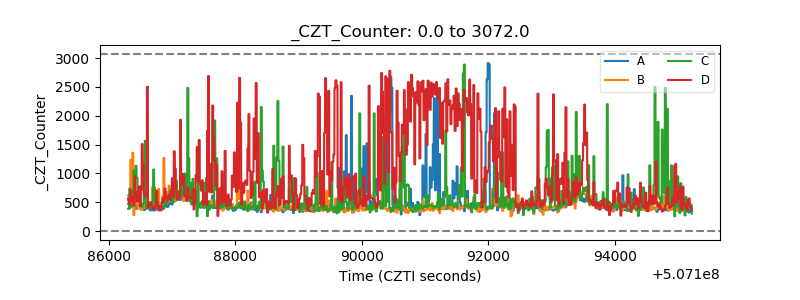 |
| +2.5 Volts monitor |  |
| +5 Volts monitor |  |
| _ROLL_ROT | 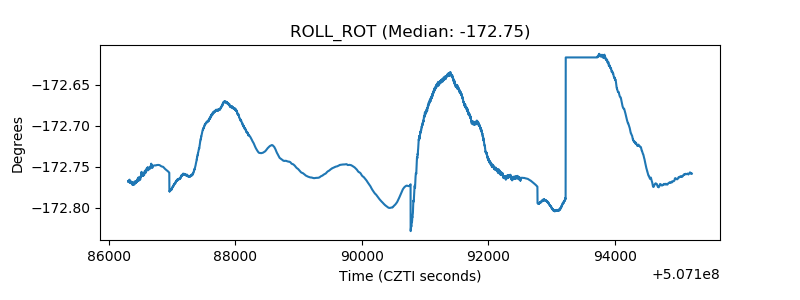 |
| _Roll_DEC | 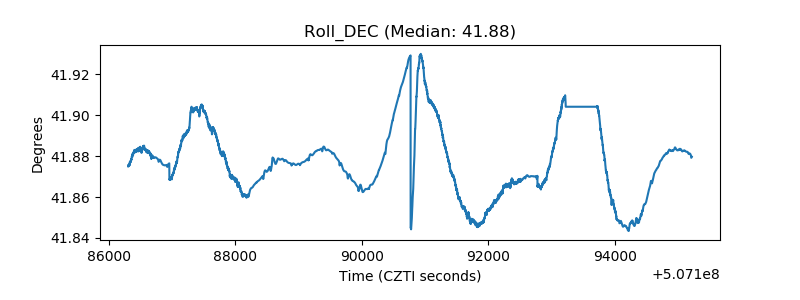 |
| _Roll_RA | 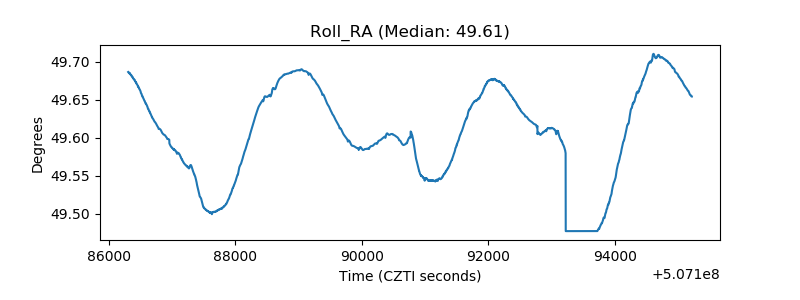 |
| Veto Counter | 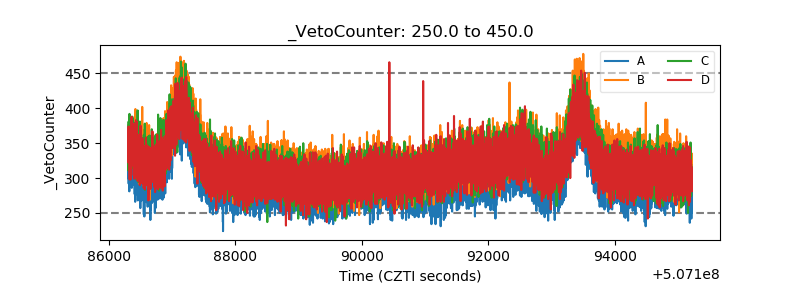 |