| Param | Original file | Final file |
|---|---|---|
| Filename | modeM0/AS1A14_030T02_9000006544_55905cztM0_level2.fits | modeM0/AS1A14_030T02_9000006544_55905cztM0_level2_quad_clean.evt |
| Size (bytes) | 1,280,194,560 | 266,451,840 |
| Size | 1.2 GB | 254.1 MB |
| Events in quadrant A | 10,000,305 | 1,719,875 |
| Events in quadrant B | 9,120,211 | 1,871,833 |
| Events in quadrant C | 11,980,229 | 1,637,310 |
| Events in quadrant D | 14,781,876 | 1,498,897 |
| Mode SS | |||
|---|---|---|---|
| Quadrant | BADHDUFLAG | Total packets | Discarded packets |
| A | 0 | 392 | 0 |
| B | 0 | 392 | 0 |
| C | 0 | 392 | 0 |
| D | 0 | 392 | 0 |
| Mode M9 | |||
|---|---|---|---|
| Quadrant | BADHDUFLAG | Total packets | Discarded packets |
| A | 0 | 9 | 0 |
| B | 0 | 9 | 0 |
| C | 0 | 9 | 0 |
| D | 0 | 9 | 0 |
| Mode M0 | |||
|---|---|---|---|
| Quadrant | BADHDUFLAG | Total packets | Discarded packets |
| A | 0 | 44529 | 2 |
| B | 0 | 41786 | 2 |
| C | 0 | 50156 | 2 |
| D | 0 | 57595 | 2 |
| Quadrant | Total seconds | Saturated seconds | Saturation percentage |
|---|---|---|---|
| A | 19443 | 588 | 3.024225% |
| B | 19443 | 563 | 2.895644% |
| C | 19443 | 979 | 5.035231% |
| D | 19444 | 1534 | 7.889323% |
Noise dominated data is calculated using 1-second bins in cleaned event files. If a bin has >2000 counts, and if more than 50% of those come from <1% of pixels, then it is considered to be noise-dominated and hence unusable.
| Quadrant | # 1 sec bins | Bins with >0 counts | Bins with >2000 counts | High rate bins dominated by noise | Noise dominated (total time) | Noise dominated (detector-on time) | Marked lightcurve |
|---|---|---|---|---|---|---|---|
| A | 20288 | 19443 | 244 | 244 | 1.20% | 1.25% | 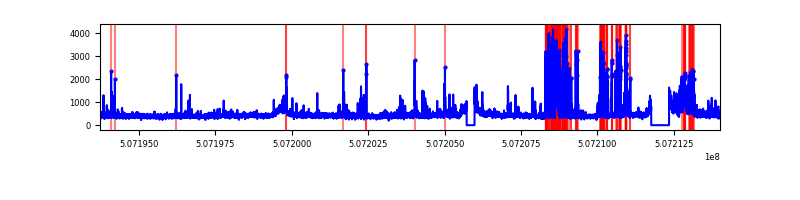 |
| B | 20288 | 19444 | 139 | 139 | 0.69% | 0.71% | 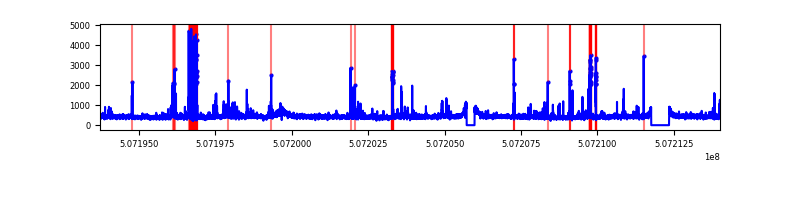 |
| C | 20288 | 19445 | 645 | 645 | 3.18% | 3.32% | 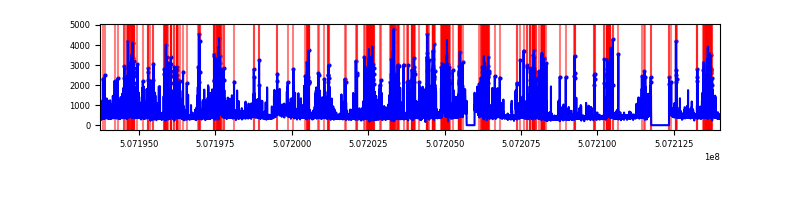 |
| D | 20289 | 19446 | 1144 | 1144 | 5.64% | 5.88% | 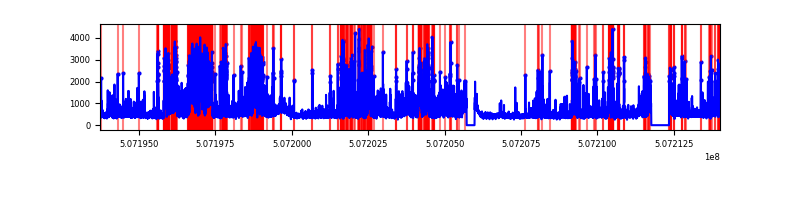 |
Top three noisy pixels from each quadrant. If the there are fewer than three noisy pixels in the level2.evt file, extra rows are filled as -1
| Pixel properties | Quadrant properties | ||||||
|---|---|---|---|---|---|---|---|
| Quadrant | DetID | PixID | Counts | Sigma | Mean | Median | Sigma |
| A | 0 | 8 | 669094 | 1333.11 | 2043 | 1989 | 500.4 |
| A | 4 | 249 | 580210 | 1155.49 | 2043 | 1989 | 500.4 |
| A | 12 | 115 | 496662 | 988.53 | 2043 | 1989 | 500.4 |
| B | 5 | 185 | 476681 | 1100.01 | 2016 | 1938 | 431.6 |
| B | 7 | 252 | 154415 | 353.3 | 2016 | 1938 | 431.6 |
| B | 7 | 0 | 109631 | 249.53 | 2016 | 1938 | 431.6 |
| C | 12 | 252 | 2085131 | 3885.0 | 1960 | 1941 | 536.2 |
| C | 15 | 199 | 1085699 | 2021.13 | 1960 | 1941 | 536.2 |
| C | 13 | 3 | 916993 | 1706.51 | 1960 | 1941 | 536.2 |
| D | 11 | 129 | 4286859 | 7853.02 | 1949 | 1858 | 545.6 |
| D | 8 | 240 | 605811 | 1106.85 | 1949 | 1858 | 545.6 |
| D | 3 | 12 | 573363 | 1047.38 | 1949 | 1858 | 545.6 |
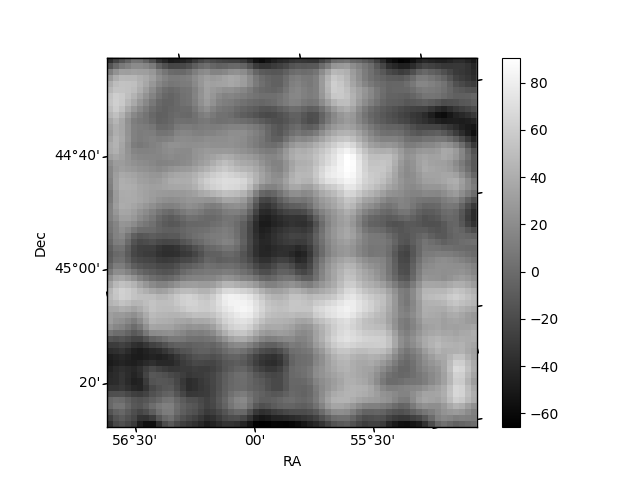
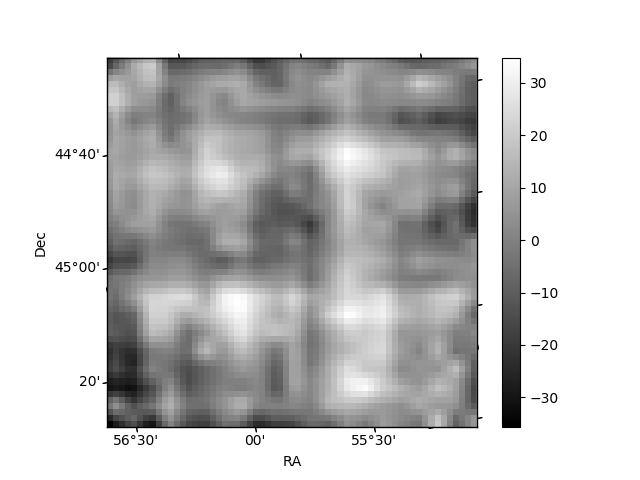
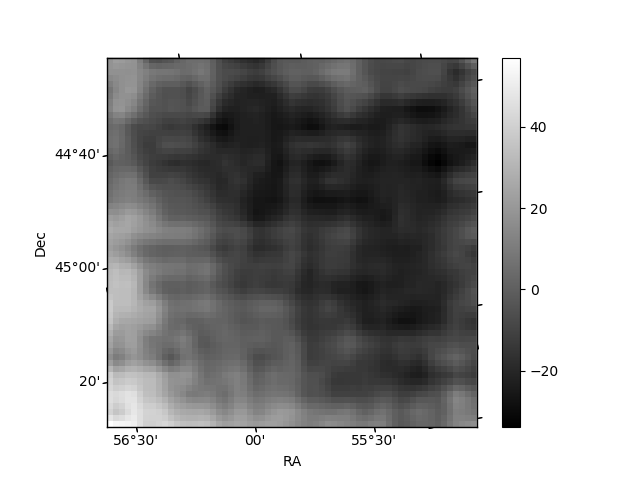
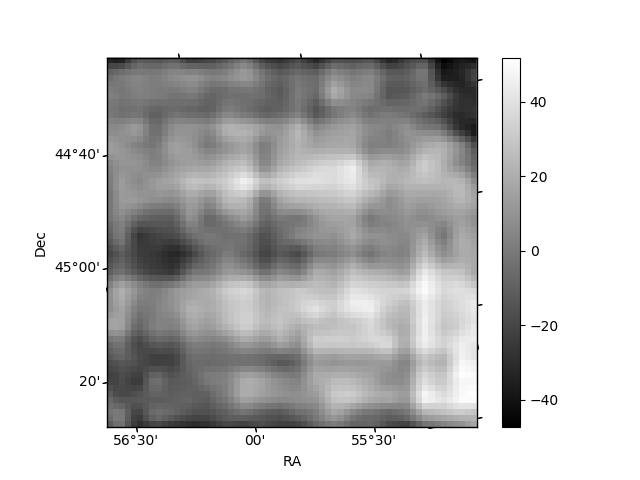
Histogram calculated using DETX and DETY for each event in the final _common_clean file
| Quadrant A | 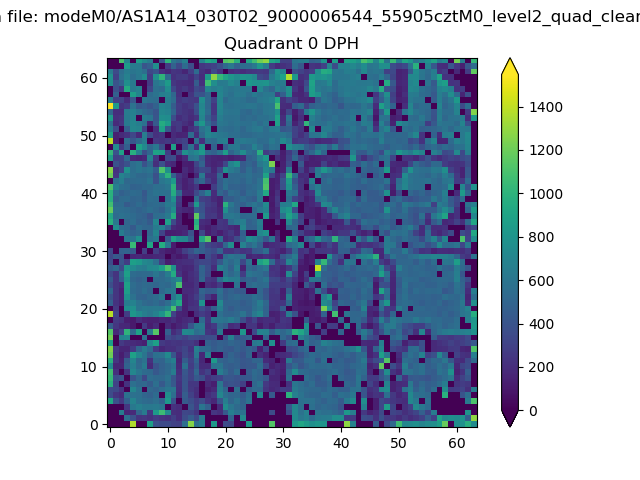 |
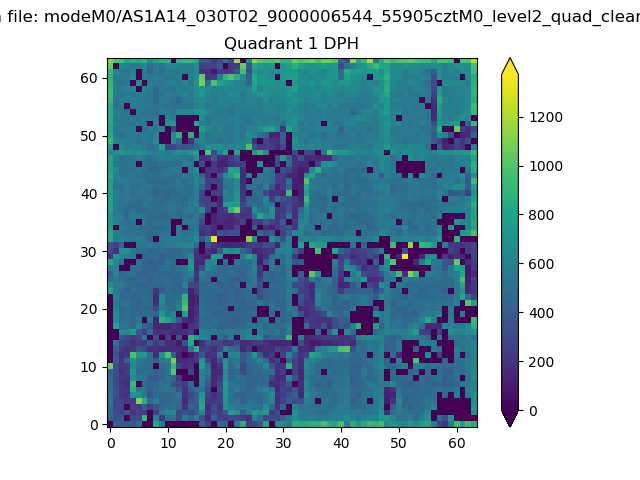 |
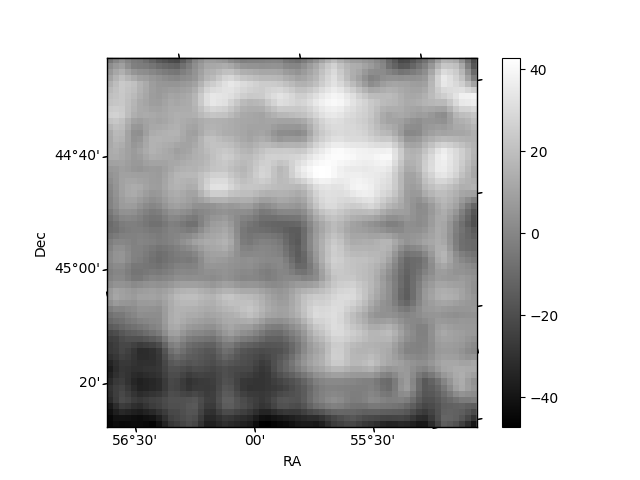
Quadrant B |
|---|---|---|---|
| Quadrant D | 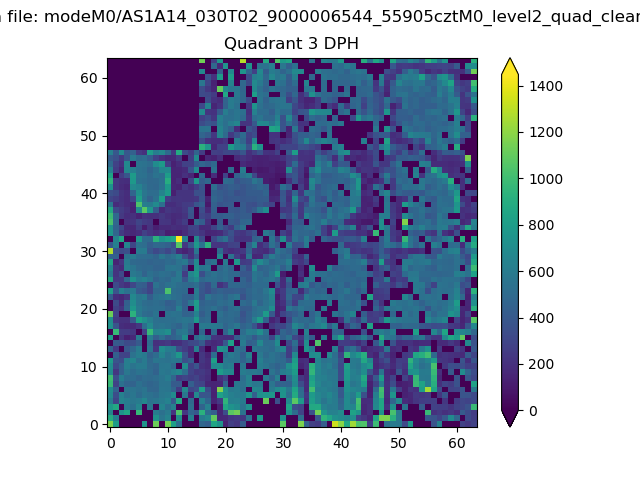 |
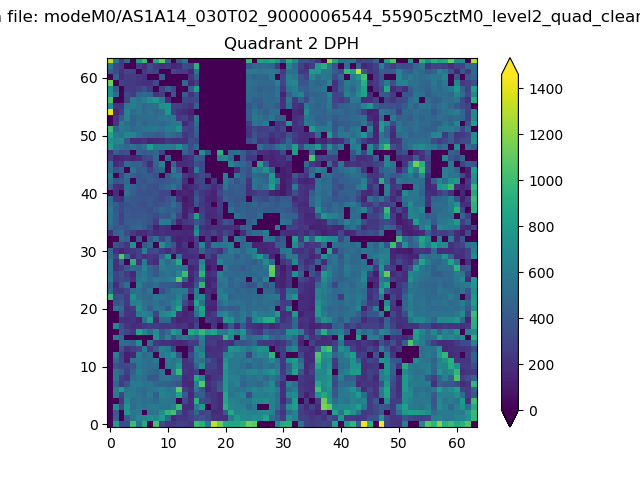 |
Quadrant C |
| Plot type | Count rate plots | Images |
|---|---|---|
| Comparison with Poisson distribution Blue bars denote a histogram of data divided into 1 sec bins. Red curve is a Poisson curve with rate = median count rate of data. |
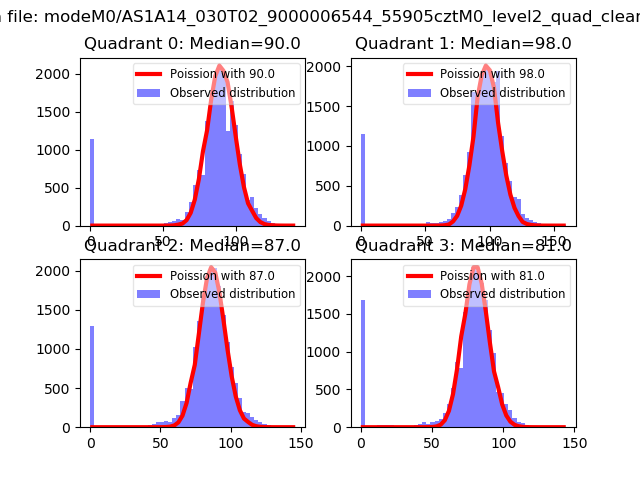 |
 |
| Quadrant-wise count rates Data is divided into 100 sec bins |
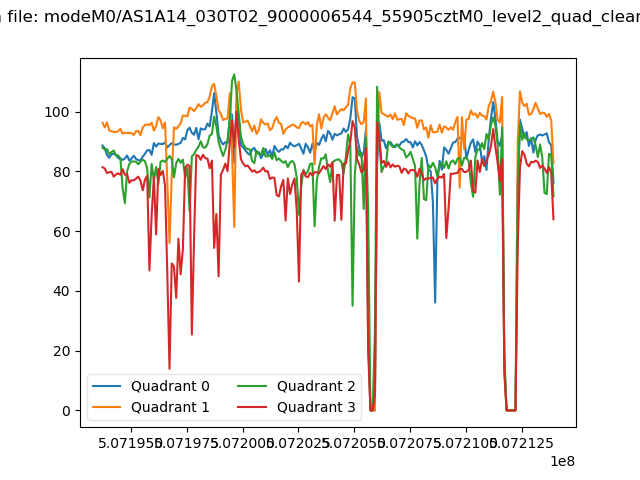 |
|
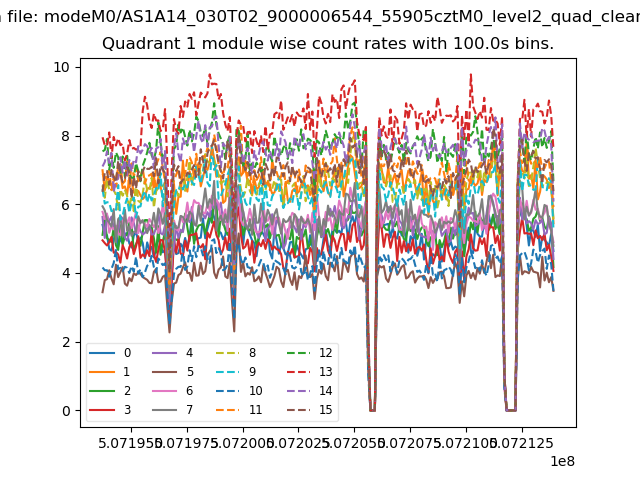
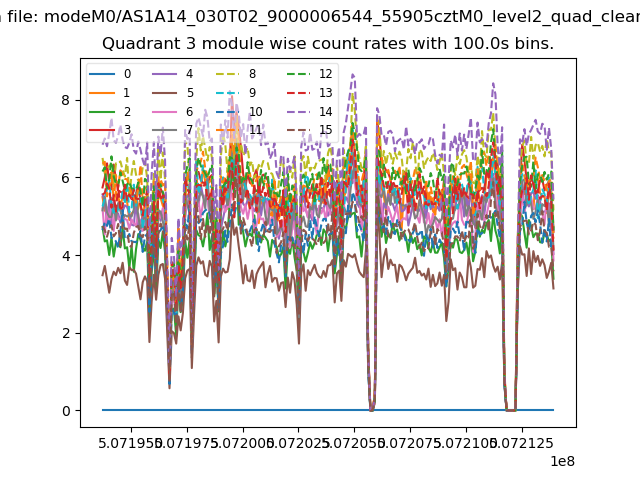
| Module-wise count rates for Quadrant A Data is divided into 100 sec bins |
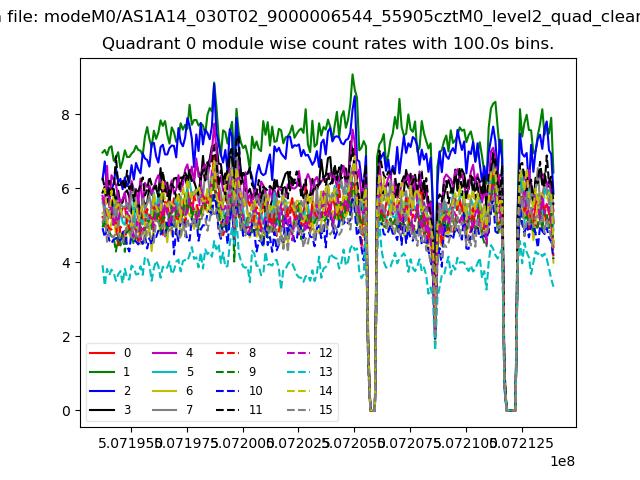 |
 |
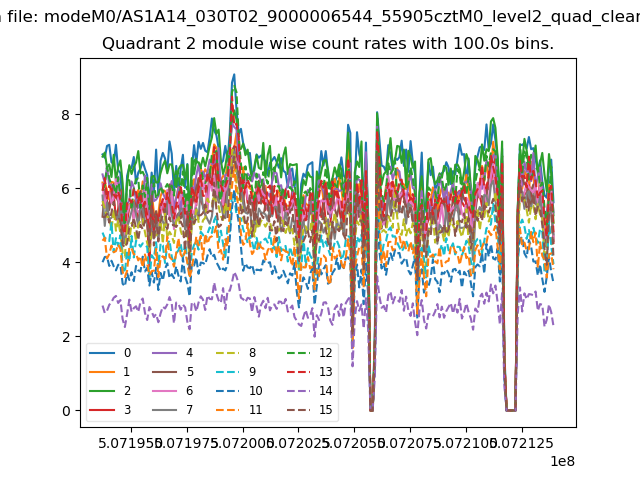
| Module-wise count rates for Quadrant B Data is divided into 100 sec bins |
 |
 |
| Module-wise count rates for Quadrant C Data is divided into 100 sec bins |
 |
 |
| Module-wise count rates for Quadrant D Data is divided into 100 sec bins |
 |
 |
| Parameter | Plot |
|---|---|
| CZT HV Monitor | 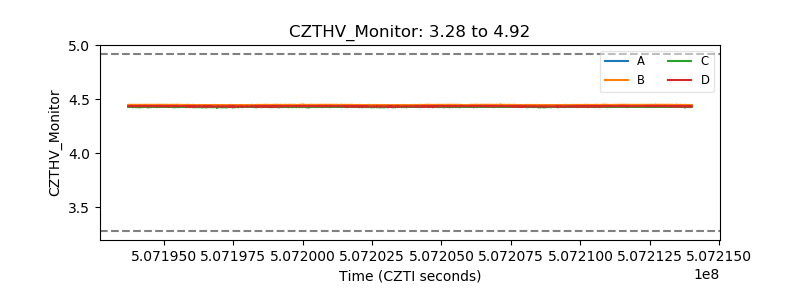 |
| D_VDD | 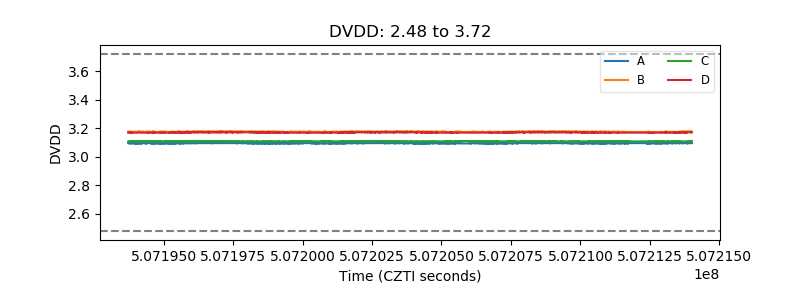 |
| Temperature 1 | 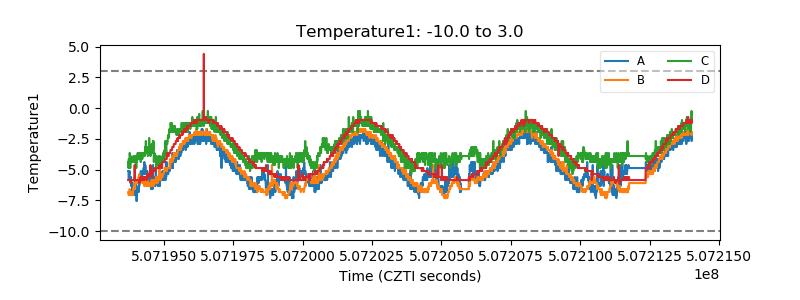 |
| Veto HV Monitor | 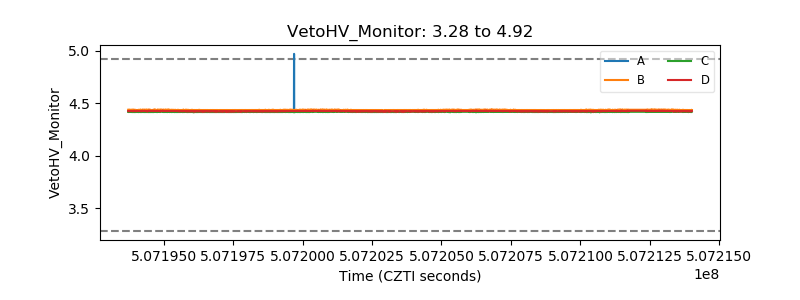 |
| Veto LLD | 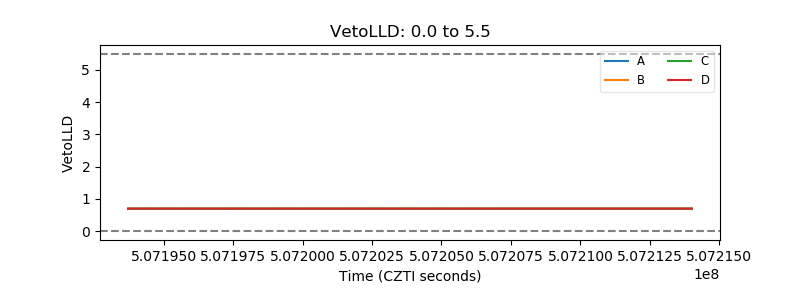 |
| Alpha Counter | 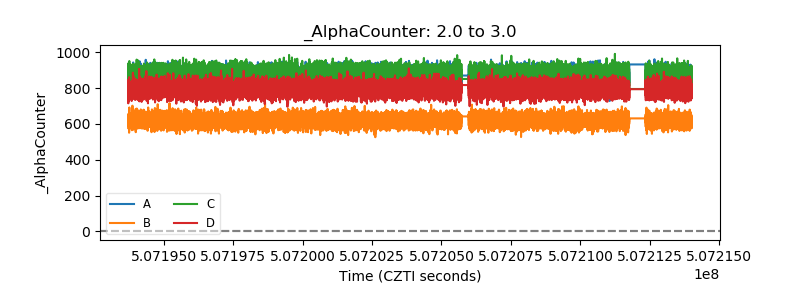 |
| _CPM_Rate | 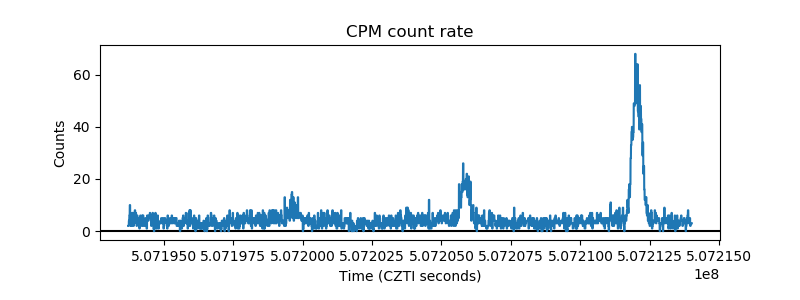 |
| CZT Counter | 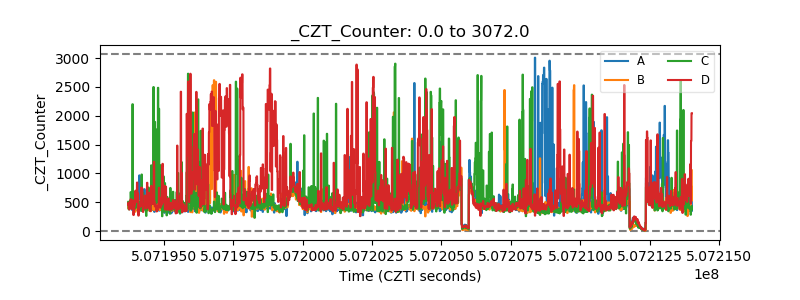 |
| +2.5 Volts monitor | 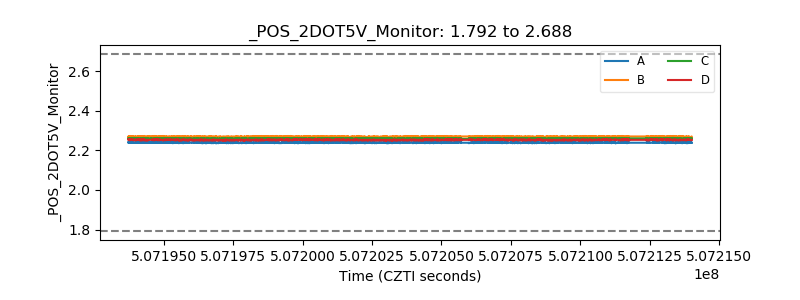 |
| +5 Volts monitor | 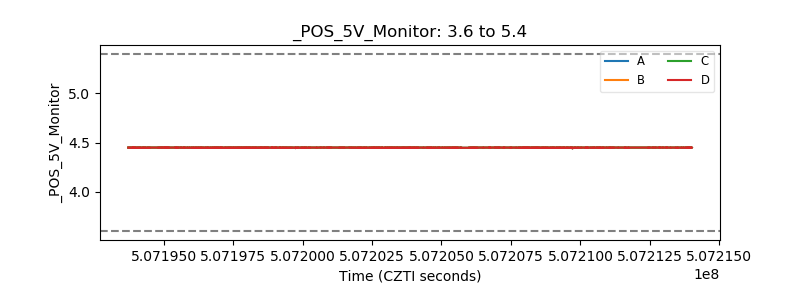 |
| _ROLL_ROT | 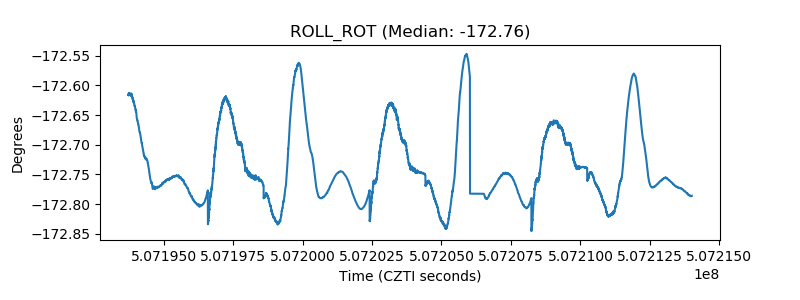 |
| _Roll_DEC | 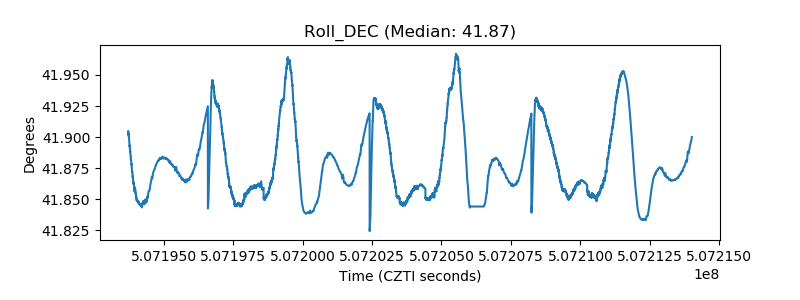 |
| _Roll_RA | 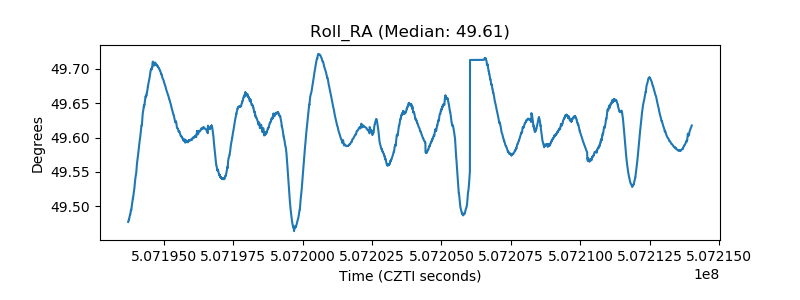 |
| Veto Counter | 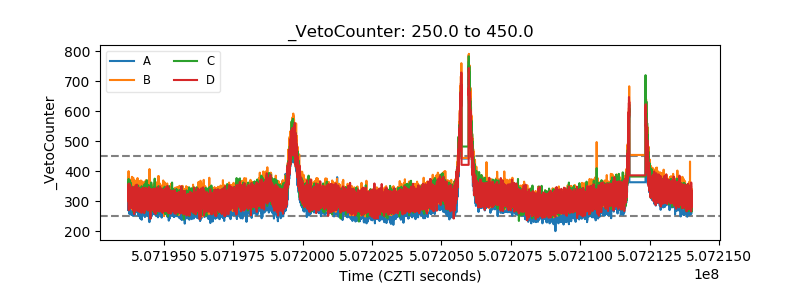 |