| Param | Original file | Final file |
|---|---|---|
| Filename | modeM0/AS1A14_030T02_9000006544_55906cztM0_level2.fits | modeM0/AS1A14_030T02_9000006544_55906cztM0_level2_quad_clean.evt |
| Size (bytes) | 459,910,080 | 93,110,400 |
| Size | 438.6 MB | 88.8 MB |
| Events in quadrant A | 4,212,469 | 603,993 |
| Events in quadrant B | 2,918,476 | 661,244 |
| Events in quadrant C | 3,854,921 | 574,176 |
| Events in quadrant D | 5,522,398 | 516,867 |
| Mode SS | |||
|---|---|---|---|
| Quadrant | BADHDUFLAG | Total packets | Discarded packets |
| A | 0 | 134 | 0 |
| B | 0 | 134 | 0 |
| C | 0 | 134 | 0 |
| D | 0 | 134 | 0 |
| Mode M9 | |||
|---|---|---|---|
| Quadrant | BADHDUFLAG | Total packets | Discarded packets |
| A | 0 | 8 | 0 |
| B | 0 | 8 | 0 |
| C | 0 | 8 | 0 |
| D | 0 | 8 | 0 |
| Mode M0 | |||
|---|---|---|---|
| Quadrant | BADHDUFLAG | Total packets | Discarded packets |
| A | 0 | 17243 | 2 |
| B | 0 | 13714 | 1 |
| C | 0 | 16531 | 1 |
| D | 0 | 20977 | 1 |
| Quadrant | Total seconds | Saturated seconds | Saturation percentage |
|---|---|---|---|
| A | 6641 | 242 | 3.644030% |
| B | 6642 | 57 | 0.858175% |
| C | 6642 | 235 | 3.538091% |
| D | 6642 | 527 | 7.934357% |
Noise dominated data is calculated using 1-second bins in cleaned event files. If a bin has >2000 counts, and if more than 50% of those come from <1% of pixels, then it is considered to be noise-dominated and hence unusable.
| Quadrant | # 1 sec bins | Bins with >0 counts | Bins with >2000 counts | High rate bins dominated by noise | Noise dominated (total time) | Noise dominated (detector-on time) | Marked lightcurve |
|---|---|---|---|---|---|---|---|
| A | 7426 | 6642 | 178 | 178 | 2.40% | 2.68% | 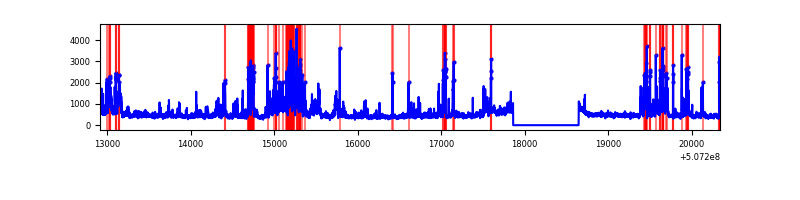 |
| B | 7427 | 6643 | 2 | 2 | 0.03% | 0.03% | 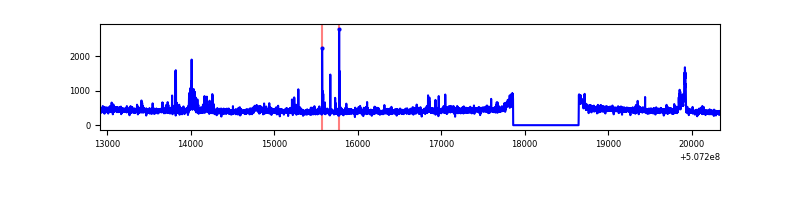 |
| C | 7427 | 6643 | 162 | 162 | 2.18% | 2.44% | 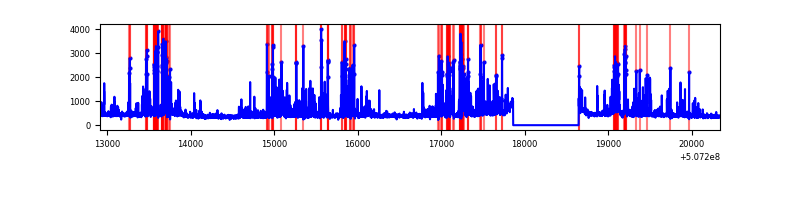 |
| D | 7427 | 6643 | 504 | 504 | 6.79% | 7.59% | 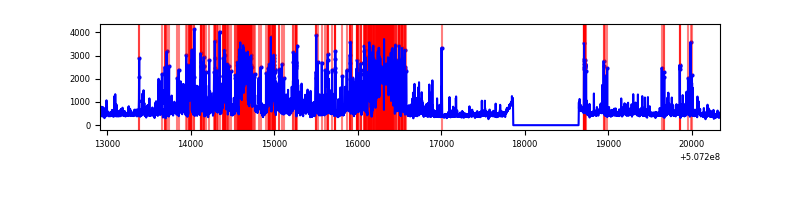 |
Top three noisy pixels from each quadrant. If the there are fewer than three noisy pixels in the level2.evt file, extra rows are filled as -1
| Pixel properties | Quadrant properties | ||||||
|---|---|---|---|---|---|---|---|
| Quadrant | DetID | PixID | Counts | Sigma | Mean | Median | Sigma |
| A | 12 | 115 | 618072 | 3616.21 | 688 | 670 | 170.7 |
| A | 0 | 8 | 492123 | 2878.51 | 688 | 670 | 170.7 |
| A | 15 | 32 | 273397 | 1597.4 | 688 | 670 | 170.7 |
| B | 7 | 0 | 66521 | 447.57 | 682 | 657 | 147.2 |
| B | 5 | 185 | 48423 | 324.59 | 682 | 657 | 147.2 |
| B | 6 | 255 | 44642 | 298.89 | 682 | 657 | 147.2 |
| C | 12 | 252 | 905325 | 4964.93 | 662 | 656 | 182.2 |
| C | 15 | 199 | 209978 | 1148.78 | 662 | 656 | 182.2 |
| C | 12 | 250 | 61328 | 332.98 | 662 | 656 | 182.2 |
| D | 11 | 129 | 1927060 | 10383.58 | 653 | 624 | 185.5 |
| D | 8 | 240 | 455085 | 2449.56 | 653 | 624 | 185.5 |
| D | 3 | 12 | 196443 | 1055.47 | 653 | 624 | 185.5 |
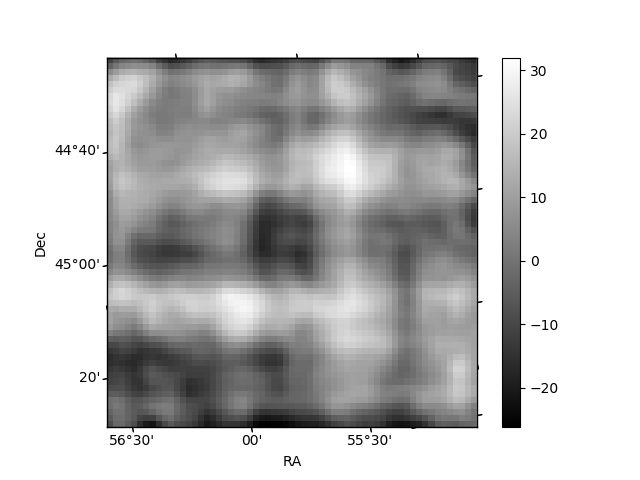
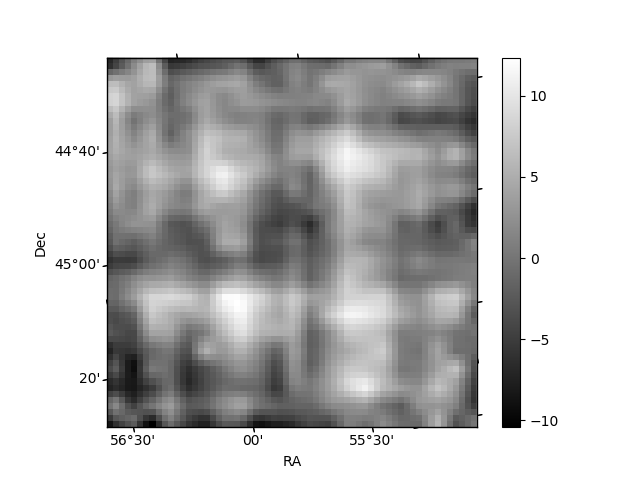
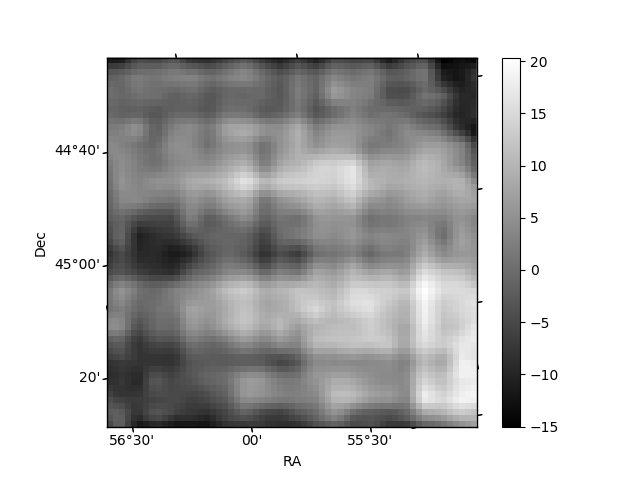
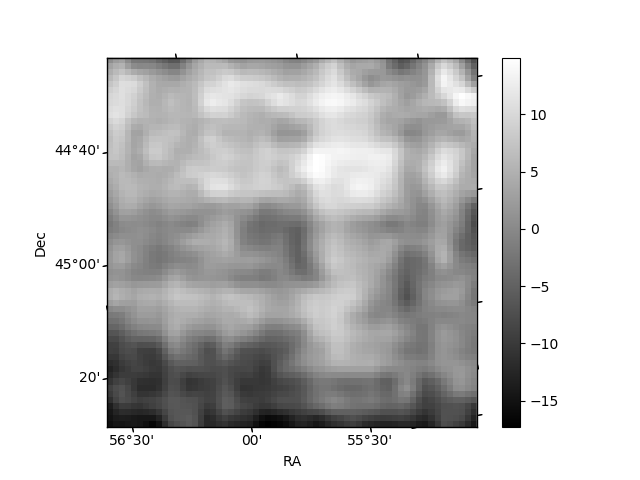
Histogram calculated using DETX and DETY for each event in the final _common_clean file
| Quadrant A | 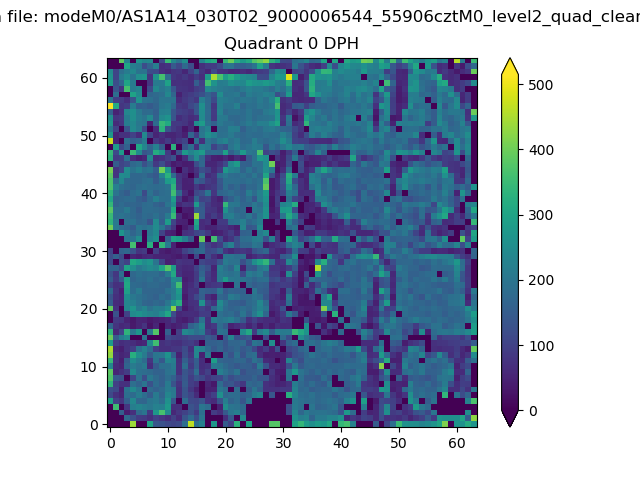 |
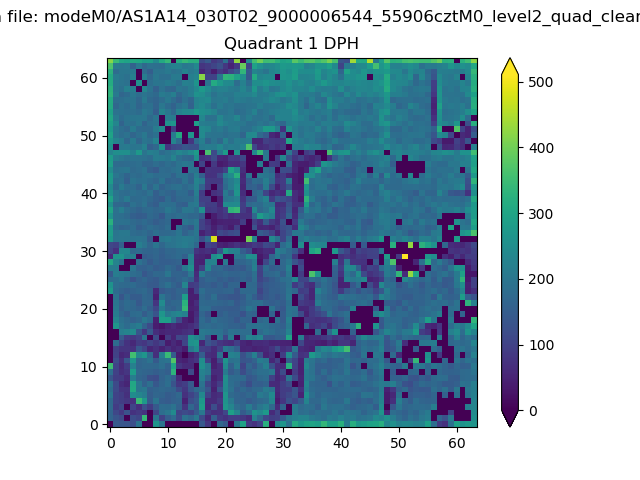 |
Quadrant B |
|---|---|---|---|
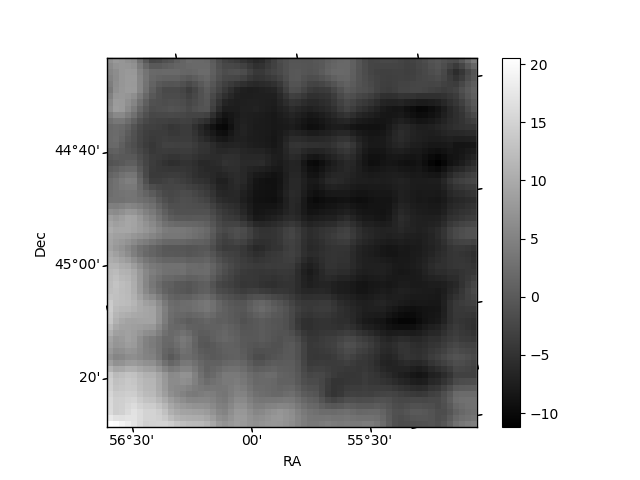
| Quadrant D | 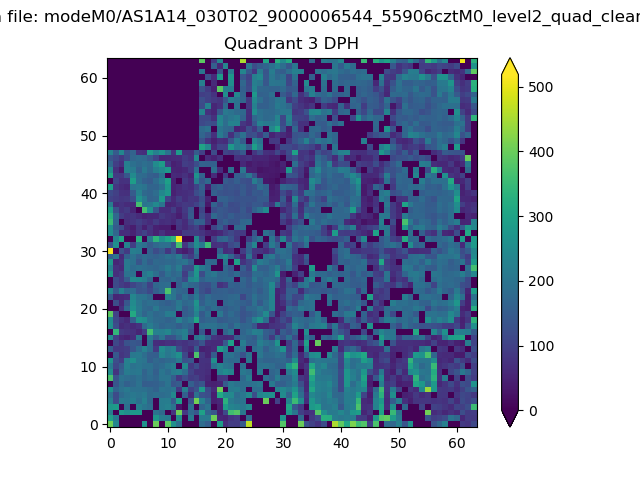 |
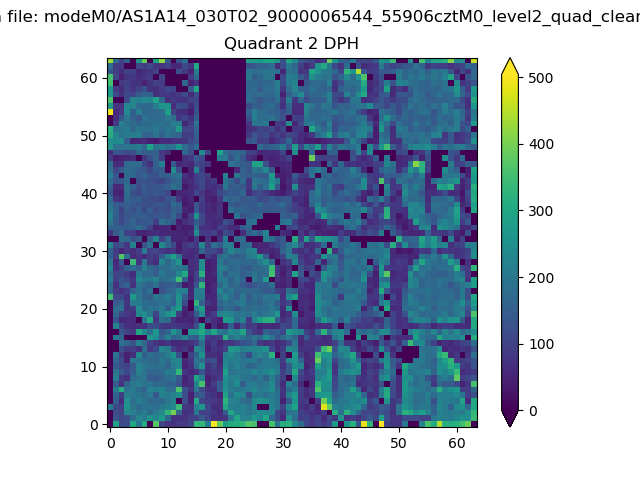 |
Quadrant C |
| Plot type | Count rate plots | Images |
|---|---|---|
| Comparison with Poisson distribution Blue bars denote a histogram of data divided into 1 sec bins. Red curve is a Poisson curve with rate = median count rate of data. |
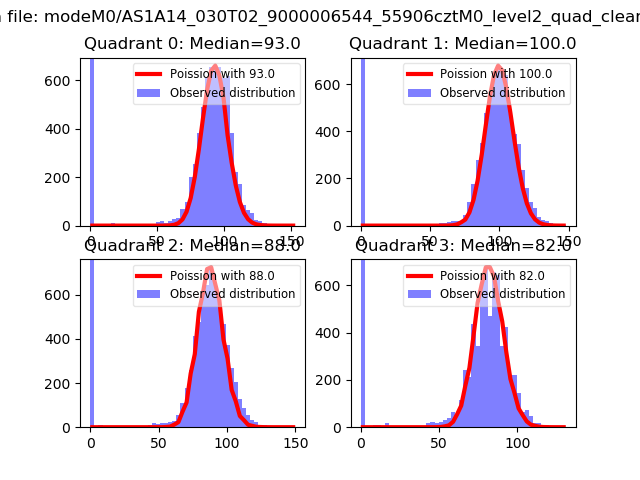 |
 |
| Quadrant-wise count rates Data is divided into 100 sec bins |
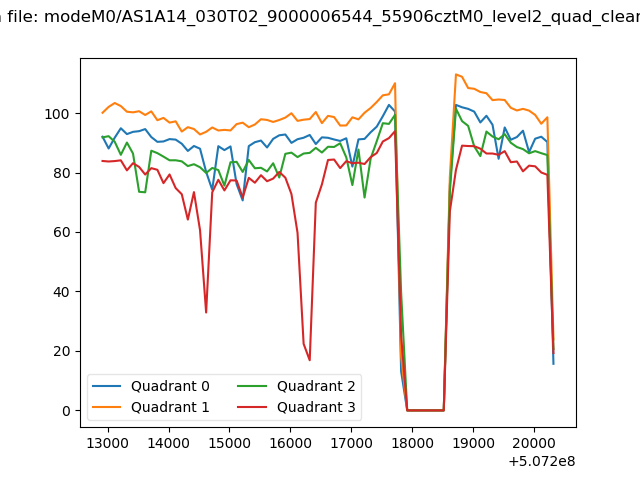 |
|
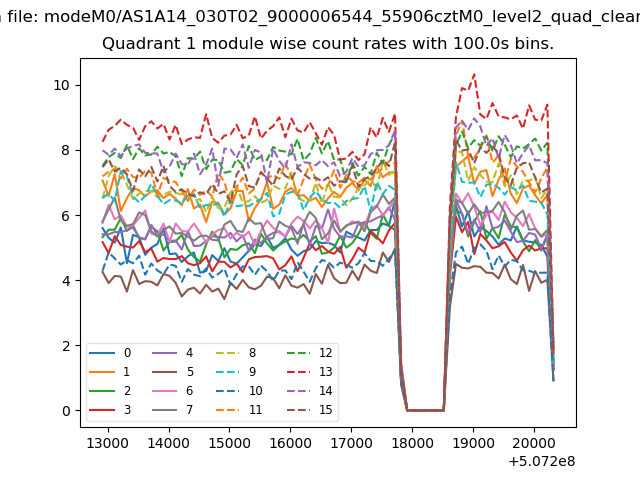
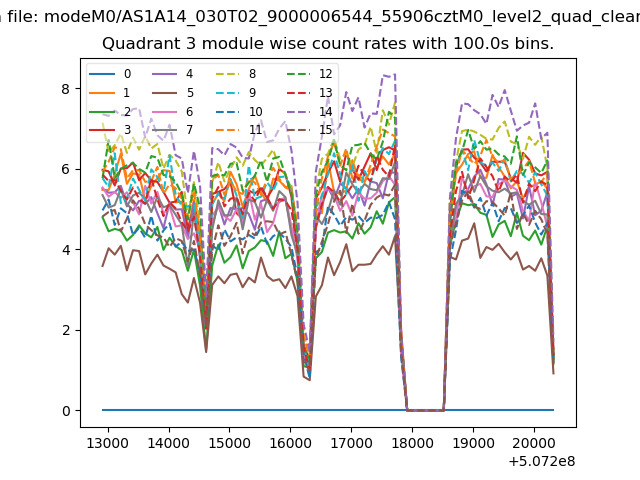
| Module-wise count rates for Quadrant A Data is divided into 100 sec bins |
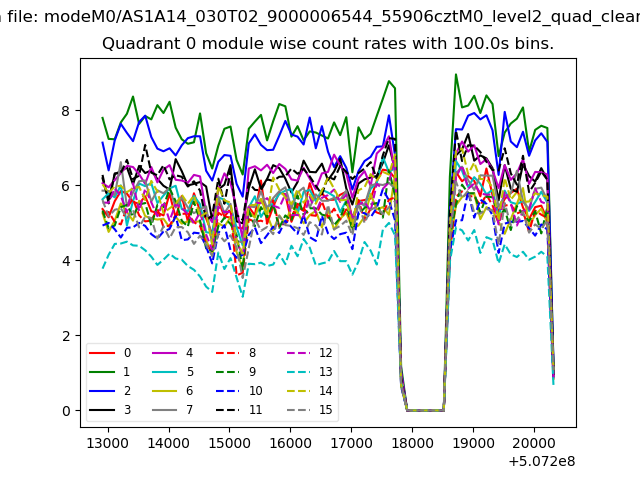 |
 |
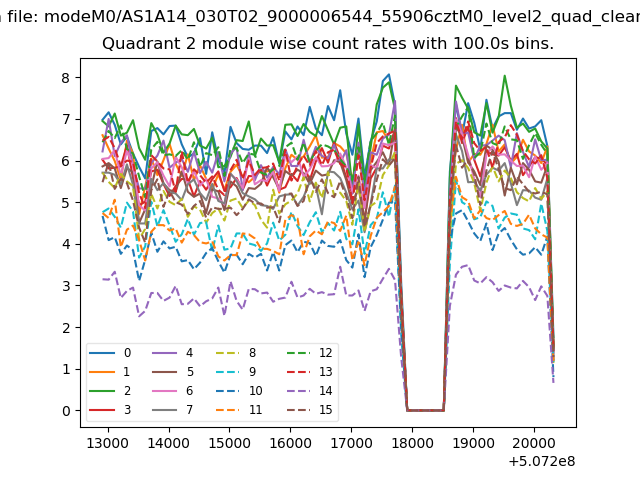
| Module-wise count rates for Quadrant B Data is divided into 100 sec bins |
 |
 |
| Module-wise count rates for Quadrant C Data is divided into 100 sec bins |
 |
 |
| Module-wise count rates for Quadrant D Data is divided into 100 sec bins |
 |
 |
| Parameter | Plot |
|---|---|
| CZT HV Monitor | 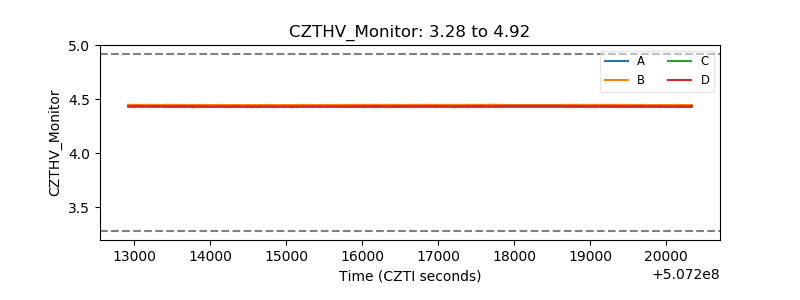 |
| D_VDD | 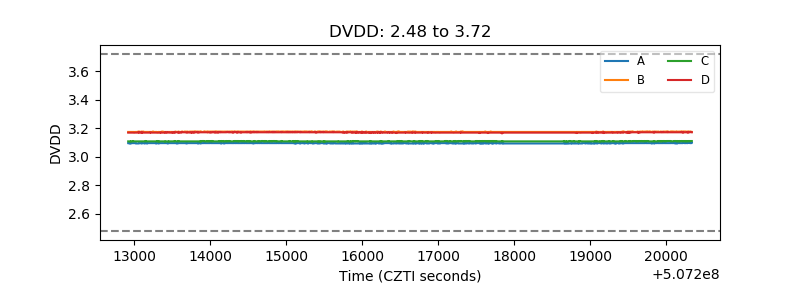 |
| Temperature 1 | 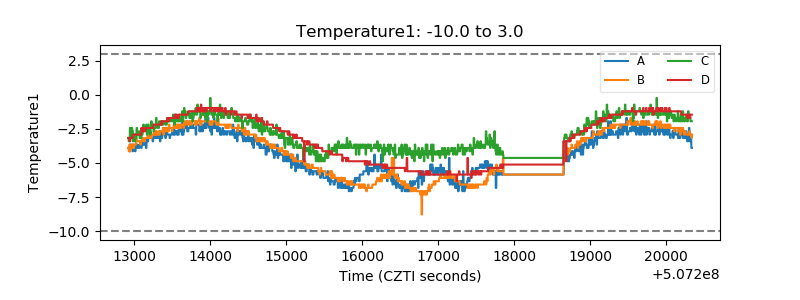 |
| Veto HV Monitor | 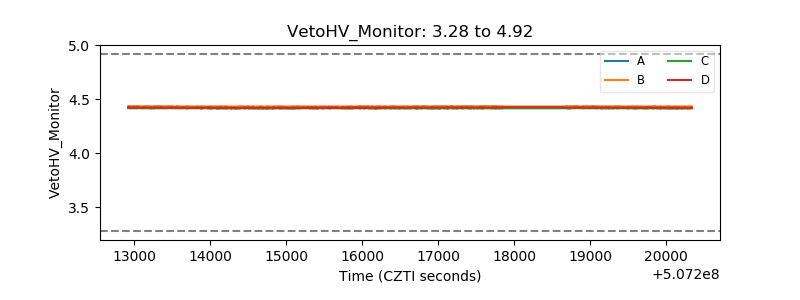 |
| Veto LLD | 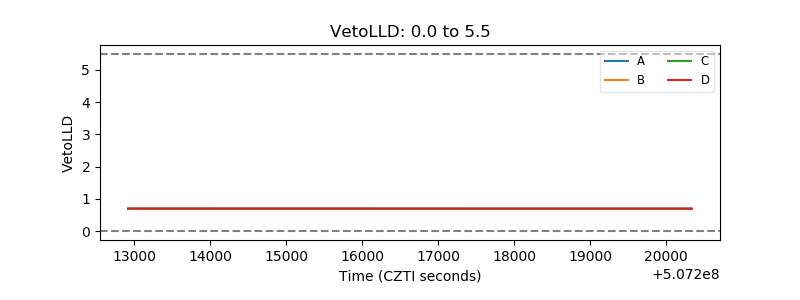 |
| Alpha Counter | 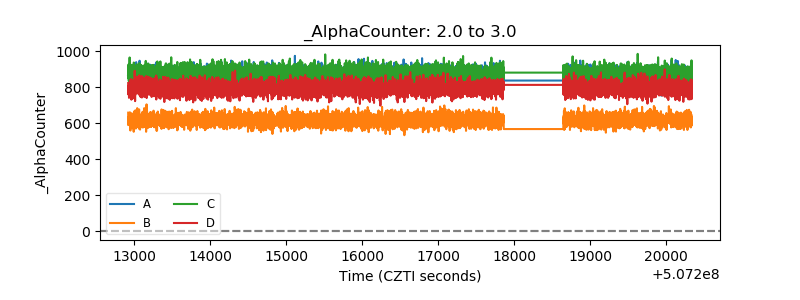 |
| _CPM_Rate | 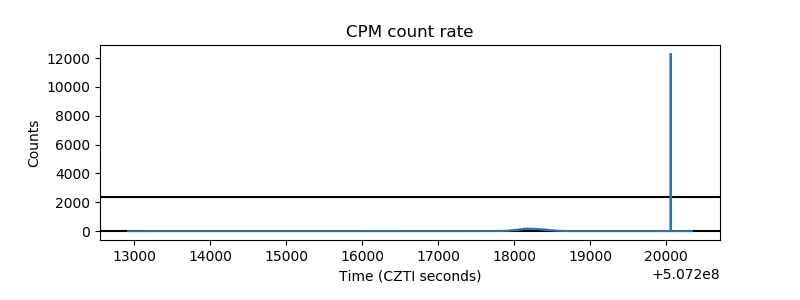 |
| CZT Counter | 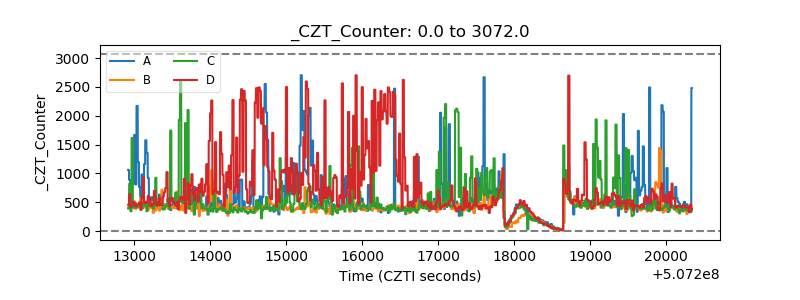 |
| +2.5 Volts monitor | 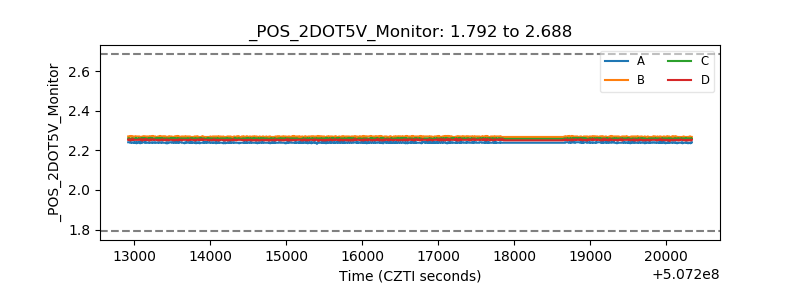 |
| +5 Volts monitor |  |
| _ROLL_ROT | 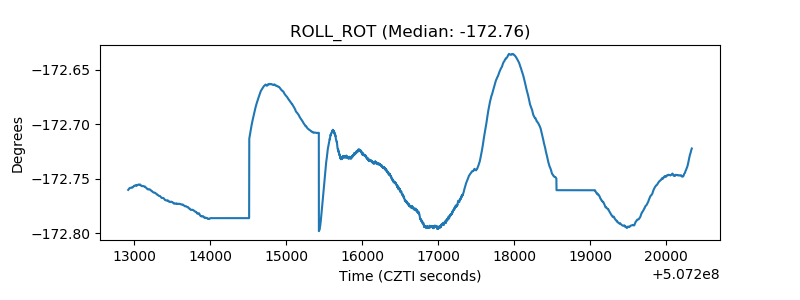 |
| _Roll_DEC | 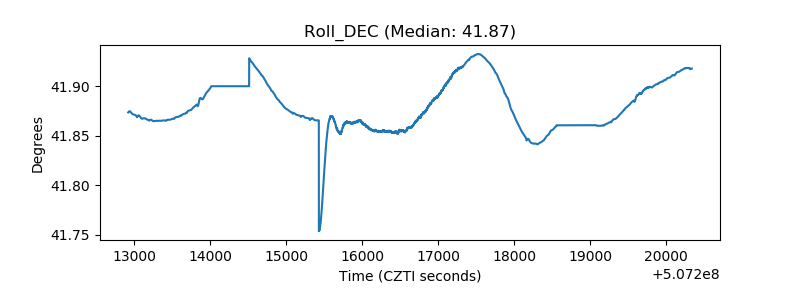 |
| _Roll_RA | 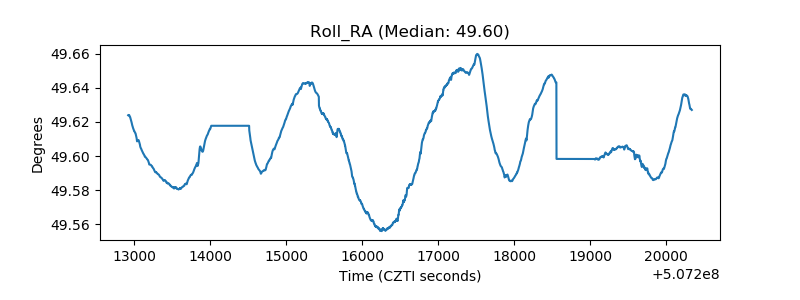 |
| Veto Counter | 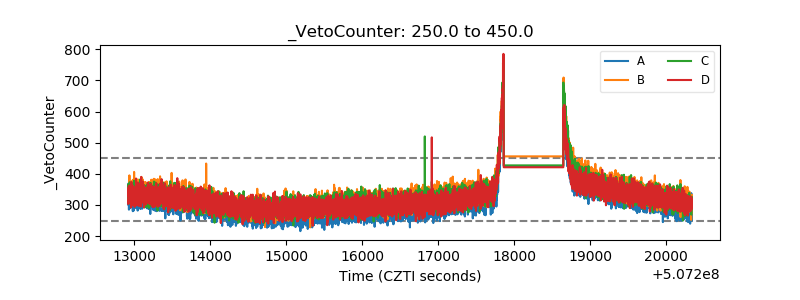 |