| Param | Original file | Final file |
|---|---|---|
| Filename | modeM0/AS1A14_030T02_9000006544_55911cztM0_level2.fits | modeM0/AS1A14_030T02_9000006544_55911cztM0_level2_quad_clean.evt |
| Size (bytes) | 436,561,920 | 95,198,400 |
| Size | 416.3 MB | 90.8 MB |
| Events in quadrant A | 3,812,456 | 626,907 |
| Events in quadrant B | 2,905,392 | 689,151 |
| Events in quadrant C | 3,444,388 | 605,640 |
| Events in quadrant D | 5,493,153 | 508,876 |
| Mode SS | |||
|---|---|---|---|
| Quadrant | BADHDUFLAG | Total packets | Discarded packets |
| A | 0 | 132 | 0 |
| B | 0 | 132 | 0 |
| C | 0 | 132 | 0 |
| D | 0 | 132 | 0 |
| Mode M9 | |||
|---|---|---|---|
| Quadrant | BADHDUFLAG | Total packets | Discarded packets |
| A | 0 | 24 | 0 |
| B | 0 | 24 | 0 |
| C | 0 | 24 | 0 |
| D | 0 | 24 | 0 |
| Mode M0 | |||
|---|---|---|---|
| Quadrant | BADHDUFLAG | Total packets | Discarded packets |
| A | 0 | 16273 | 2 |
| B | 0 | 13493 | 2 |
| C | 0 | 14999 | 2 |
| D | 0 | 20820 | 2 |
| Quadrant | Total seconds | Saturated seconds | Saturation percentage |
|---|---|---|---|
| A | 6486 | 150 | 2.312673% |
| B | 6486 | 55 | 0.847980% |
| C | 6487 | 120 | 1.849854% |
| D | 6487 | 814 | 12.548173% |
Noise dominated data is calculated using 1-second bins in cleaned event files. If a bin has >2000 counts, and if more than 50% of those come from <1% of pixels, then it is considered to be noise-dominated and hence unusable.
| Quadrant | # 1 sec bins | Bins with >0 counts | Bins with >2000 counts | High rate bins dominated by noise | Noise dominated (total time) | Noise dominated (detector-on time) | Marked lightcurve |
|---|---|---|---|---|---|---|---|
| A | 8831 | 6488 | 101 | 101 | 1.14% | 1.56% | 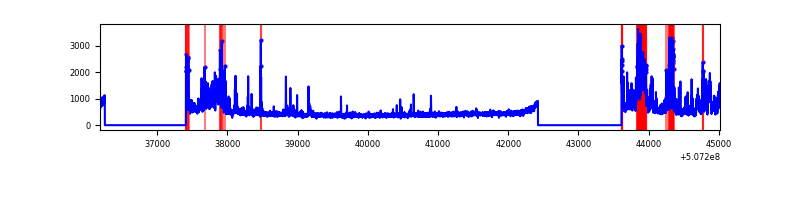 |
| B | 8831 | 6488 | 7 | 7 | 0.08% | 0.11% | 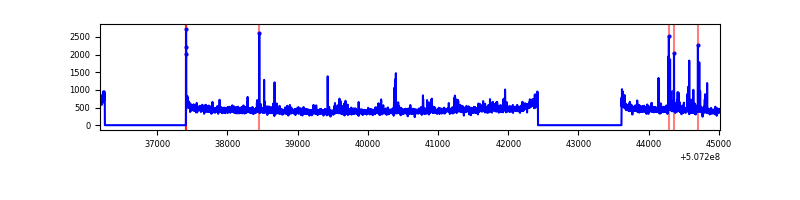 |
| C | 8832 | 6489 | 81 | 81 | 0.92% | 1.25% | 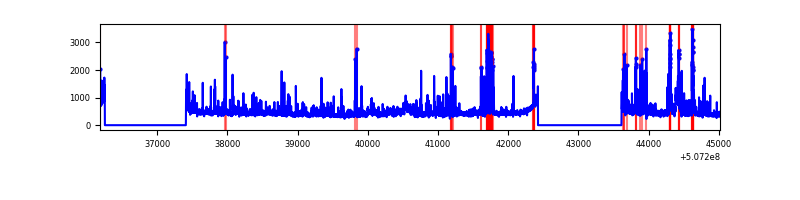 |
| D | 8831 | 6488 | 757 | 757 | 8.57% | 11.67% | 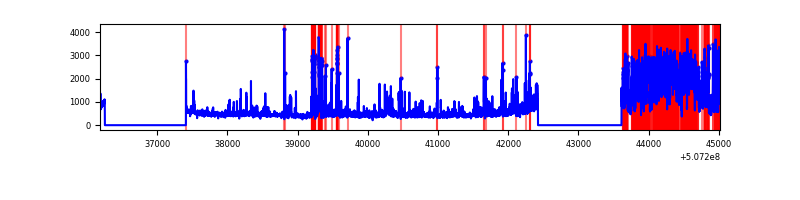 |
Top three noisy pixels from each quadrant. If the there are fewer than three noisy pixels in the level2.evt file, extra rows are filled as -1
| Pixel properties | Quadrant properties | ||||||
|---|---|---|---|---|---|---|---|
| Quadrant | DetID | PixID | Counts | Sigma | Mean | Median | Sigma |
| A | 12 | 115 | 572656 | 3386.12 | 686 | 668 | 168.9 |
| A | 15 | 32 | 380883 | 2250.84 | 686 | 668 | 168.9 |
| A | 3 | 14 | 53107 | 310.43 | 686 | 668 | 168.9 |
| B | 0 | 199 | 41749 | 279.75 | 690 | 665 | 146.9 |
| B | 5 | 185 | 39905 | 267.19 | 690 | 665 | 146.9 |
| B | 7 | 252 | 37047 | 247.73 | 690 | 665 | 146.9 |
| C | 12 | 252 | 444532 | 2383.4 | 682 | 675 | 186.2 |
| C | 15 | 199 | 259364 | 1389.09 | 682 | 675 | 186.2 |
| C | 13 | 3 | 50466 | 267.37 | 682 | 675 | 186.2 |
| D | 11 | 129 | 2336319 | 12895.4 | 641 | 612 | 181.1 |
| D | 3 | 12 | 380144 | 2095.39 | 641 | 612 | 181.1 |
| D | 7 | 96 | 94583 | 518.81 | 641 | 612 | 181.1 |
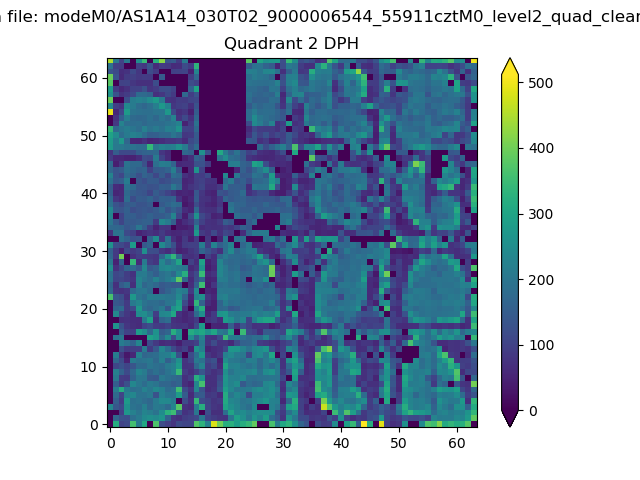
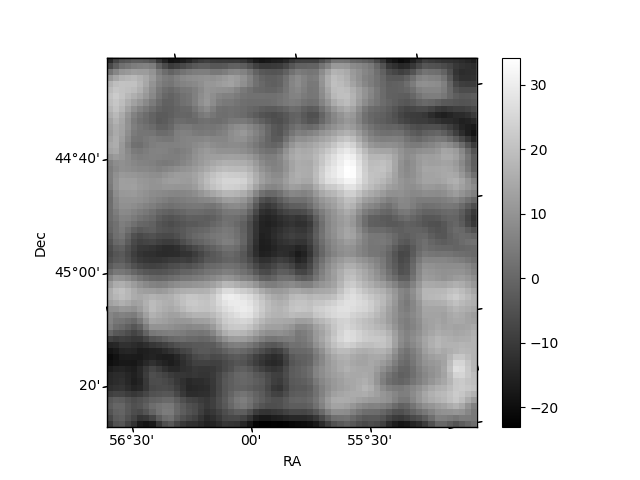
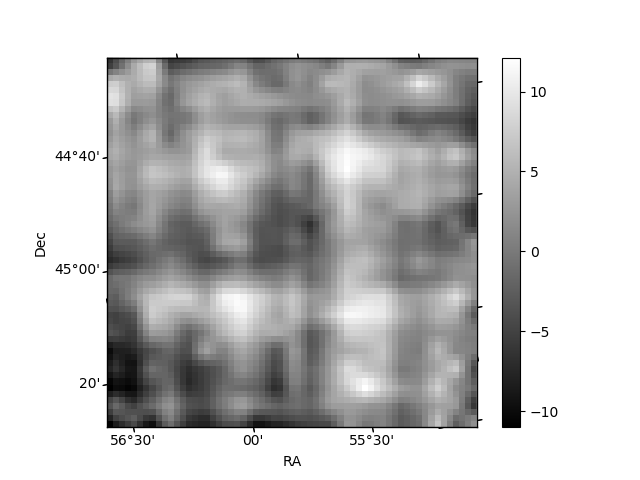
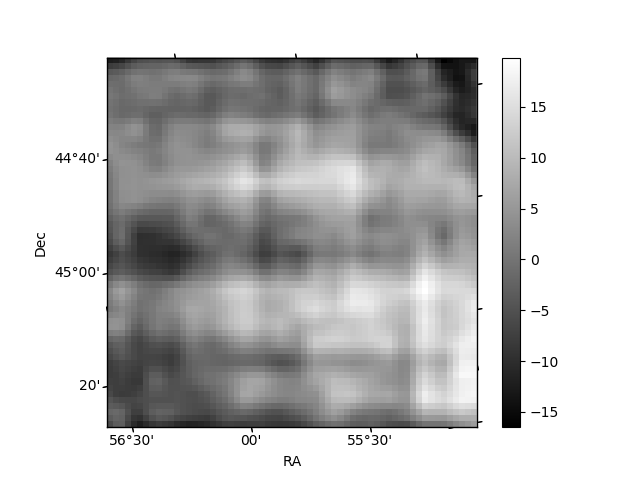
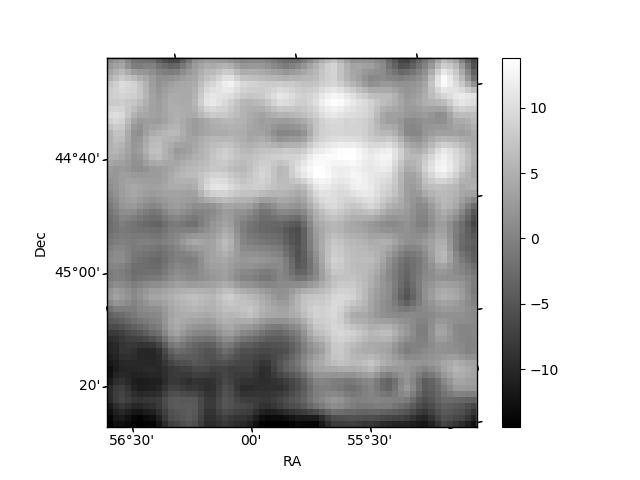
Histogram calculated using DETX and DETY for each event in the final _common_clean file
| Quadrant A | 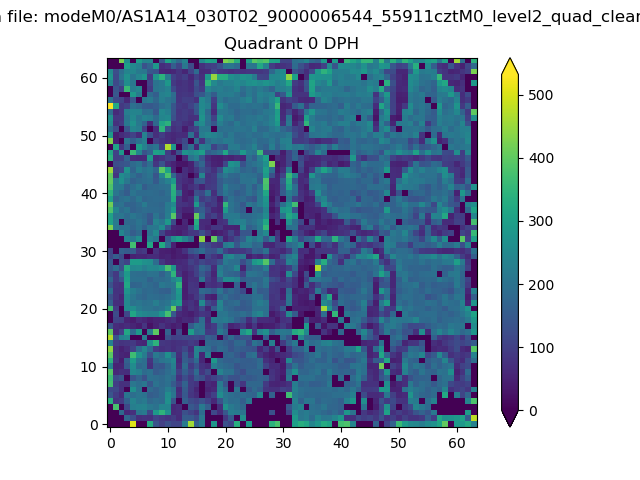 |
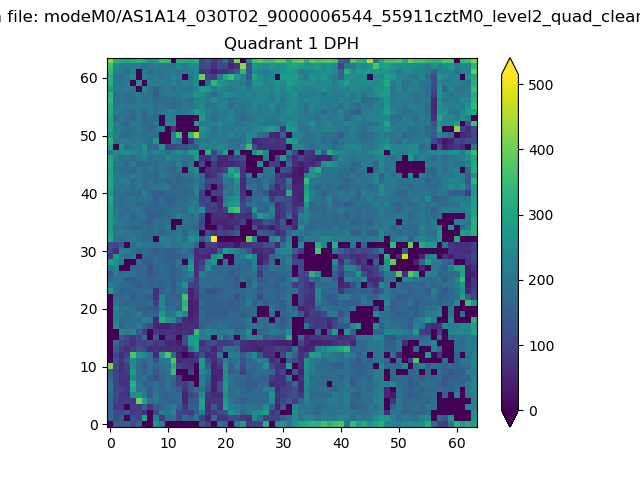 |
Quadrant B |
|---|---|---|---|
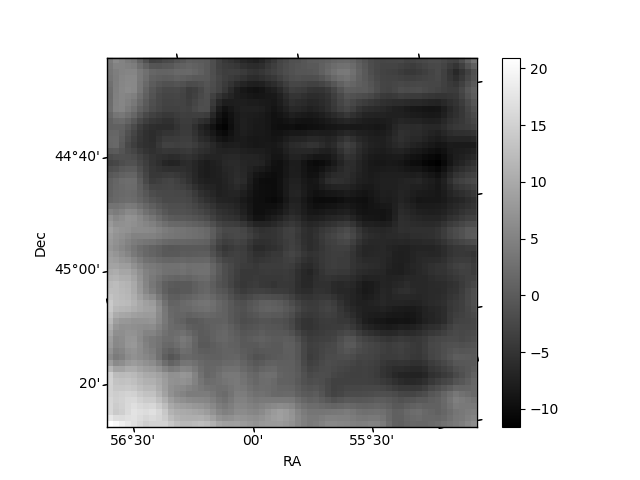
| Quadrant D | 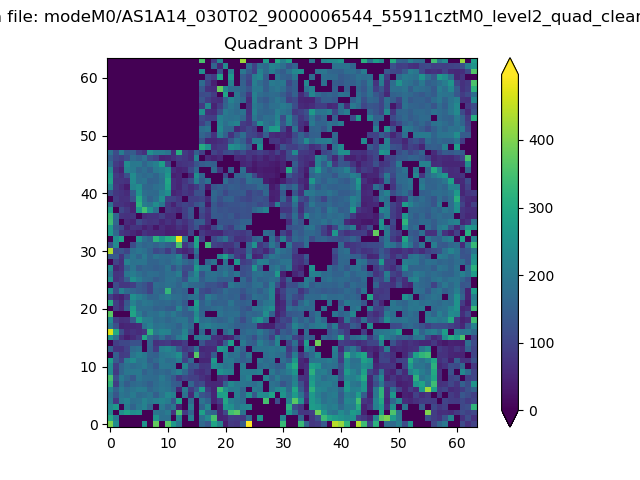 |
 |
Quadrant C |
| Plot type | Count rate plots | Images |
|---|---|---|
| Comparison with Poisson distribution Blue bars denote a histogram of data divided into 1 sec bins. Red curve is a Poisson curve with rate = median count rate of data. |
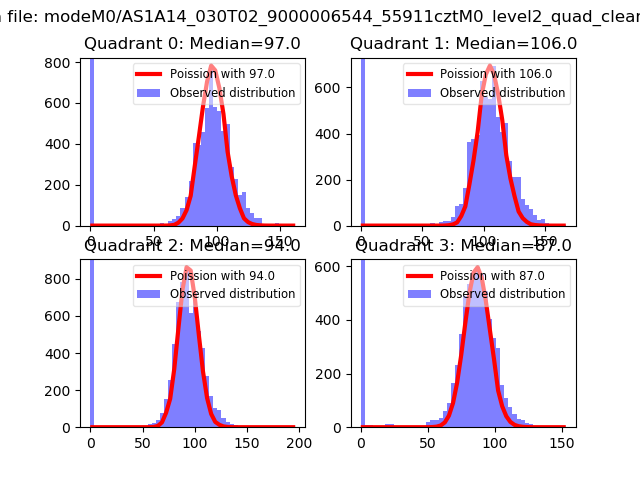 |
 |
| Quadrant-wise count rates Data is divided into 100 sec bins |
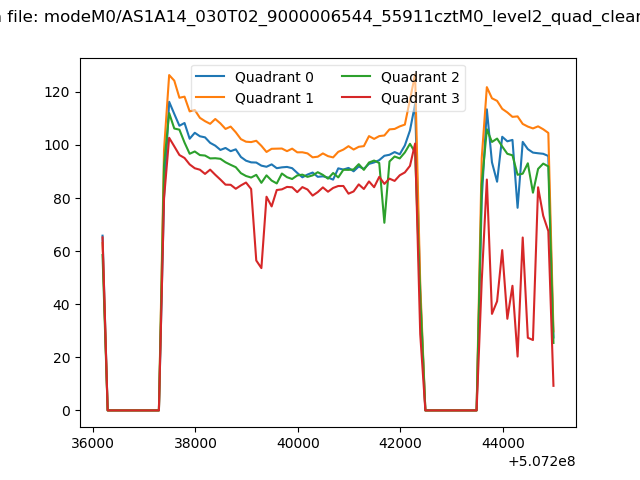 |
|
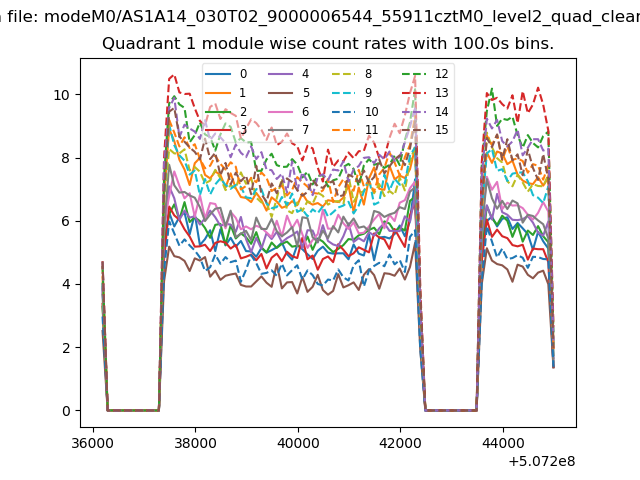
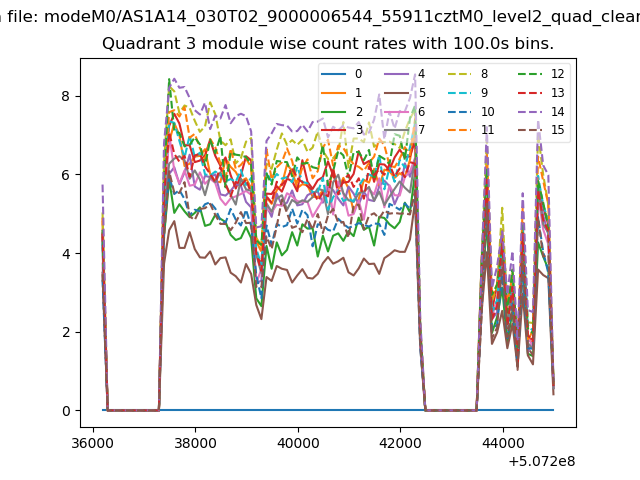
| Module-wise count rates for Quadrant A Data is divided into 100 sec bins |
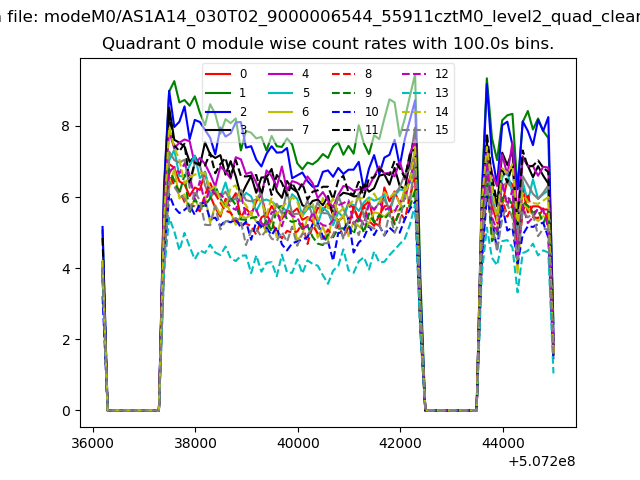 |
 |
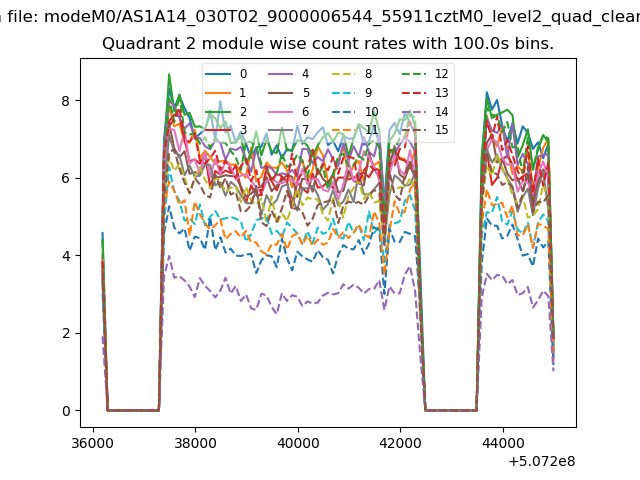
| Module-wise count rates for Quadrant B Data is divided into 100 sec bins |
 |
 |
| Module-wise count rates for Quadrant C Data is divided into 100 sec bins |
 |
 |
| Module-wise count rates for Quadrant D Data is divided into 100 sec bins |
 |
 |
| Parameter | Plot |
|---|---|
| CZT HV Monitor |  |
| D_VDD | 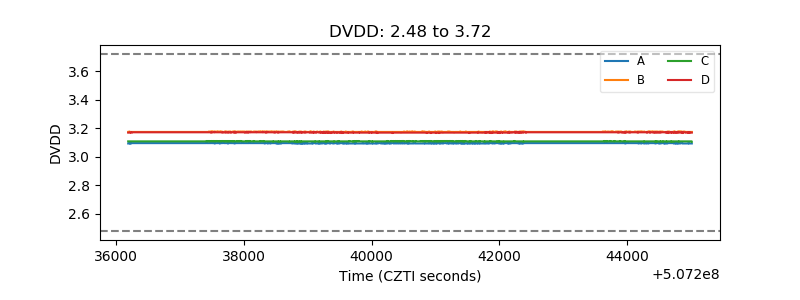 |
| Temperature 1 | 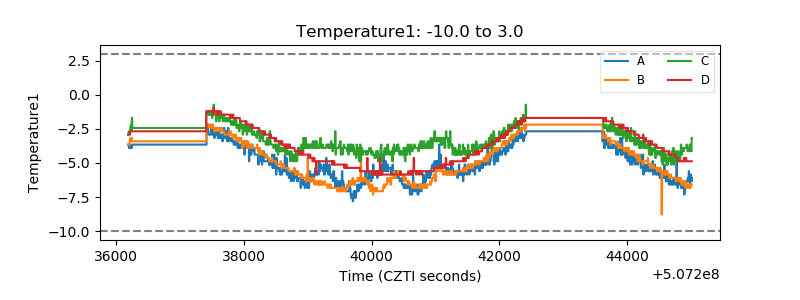 |
| Veto HV Monitor | 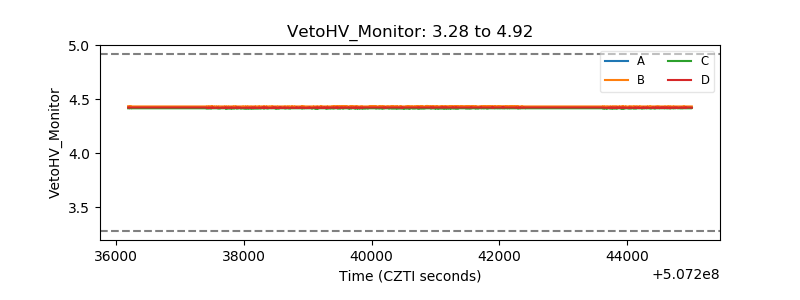 |
| Veto LLD | 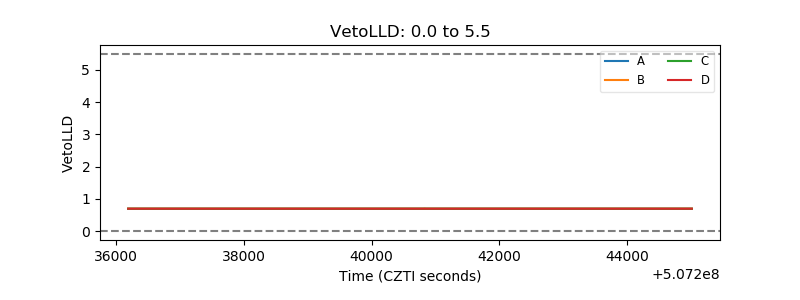 |
| Alpha Counter | 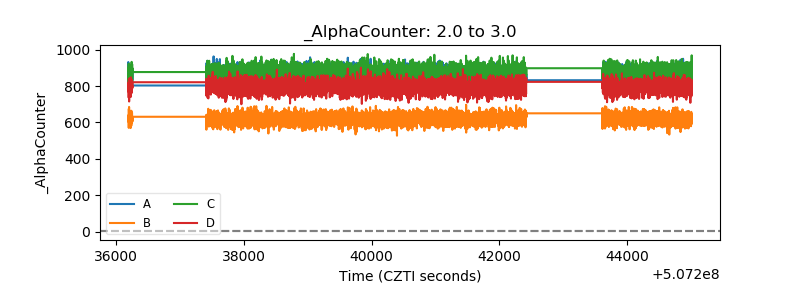 |
| _CPM_Rate | 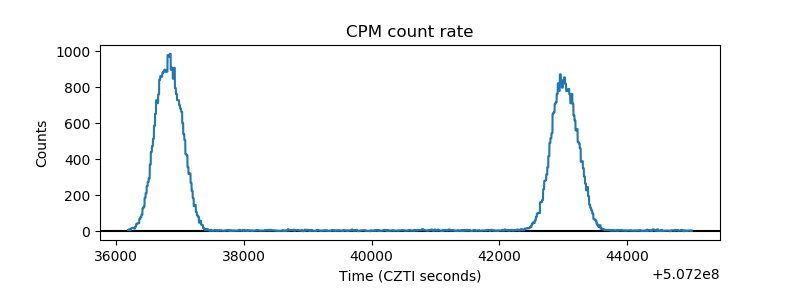 |
| CZT Counter | 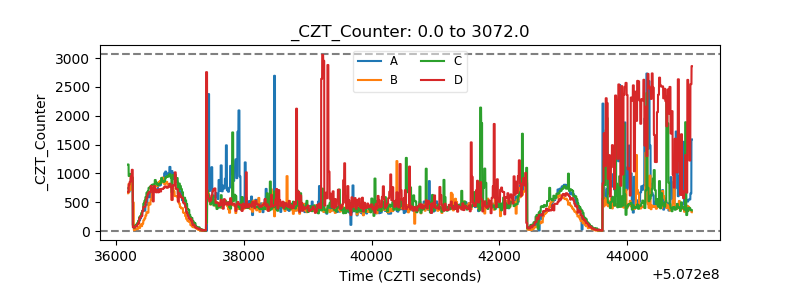 |
| +2.5 Volts monitor | 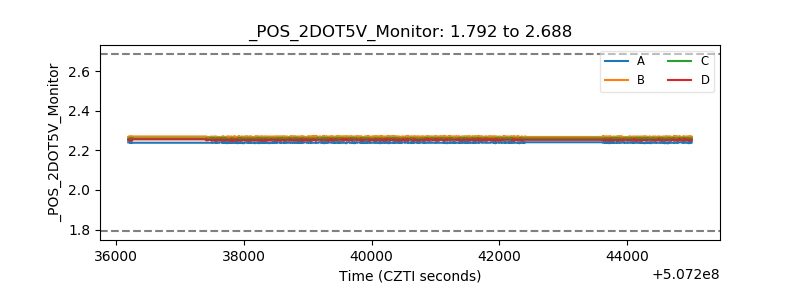 |
| +5 Volts monitor |  |
| _ROLL_ROT | 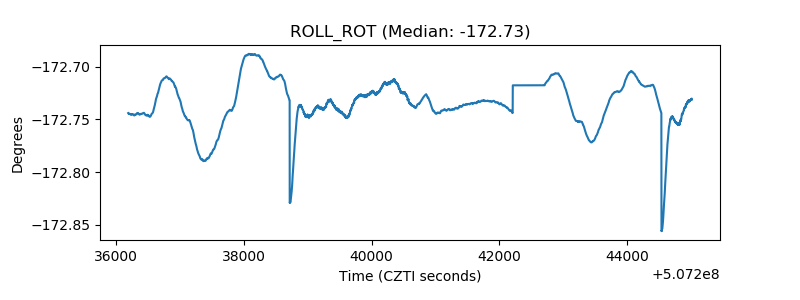 |
| _Roll_DEC | 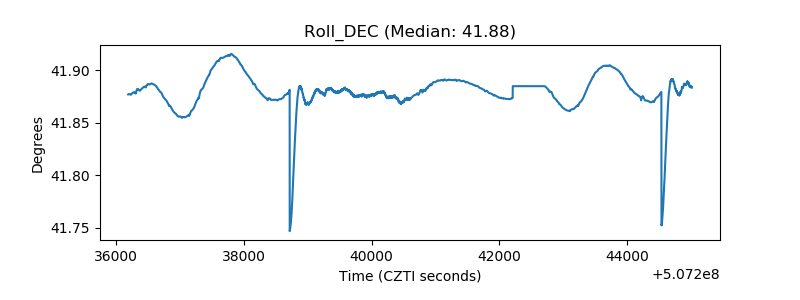 |
| _Roll_RA | 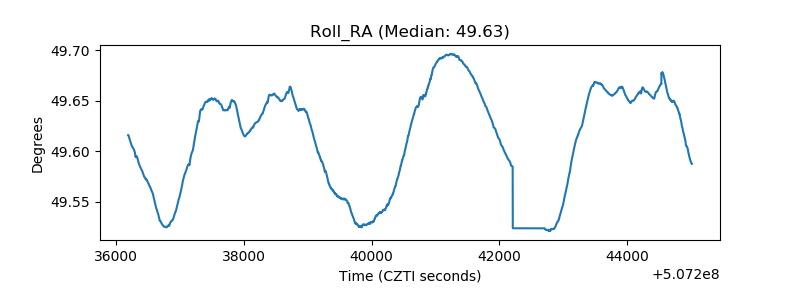 |
| Veto Counter | 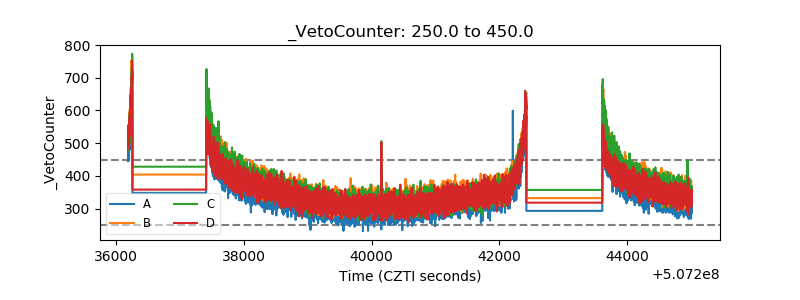 |