| Param | Original file | Final file |
|---|---|---|
| Filename | modeM0/AS1A14_030T02_9000006544_55912cztM0_level2.fits | modeM0/AS1A14_030T02_9000006544_55912cztM0_level2_quad_clean.evt |
| Size (bytes) | 514,154,880 | 91,244,160 |
| Size | 490.3 MB | 87.0 MB |
| Events in quadrant A | 4,383,962 | 603,789 |
| Events in quadrant B | 2,856,918 | 672,863 |
| Events in quadrant C | 3,378,486 | 592,661 |
| Events in quadrant D | 7,914,980 | 446,141 |
| Mode SS | |||
|---|---|---|---|
| Quadrant | BADHDUFLAG | Total packets | Discarded packets |
| A | 0 | 130 | 0 |
| B | 0 | 130 | 0 |
| C | 0 | 130 | 0 |
| D | 0 | 130 | 0 |
| Mode M9 | |||
|---|---|---|---|
| Quadrant | BADHDUFLAG | Total packets | Discarded packets |
| A | 0 | 20 | 0 |
| B | 0 | 21 | 0 |
| C | 0 | 21 | 0 |
| D | 0 | 21 | 0 |
| Mode M0 | |||
|---|---|---|---|
| Quadrant | BADHDUFLAG | Total packets | Discarded packets |
| A | 0 | 17586 | 2 |
| B | 0 | 13342 | 2 |
| C | 0 | 14889 | 2 |
| D | 0 | 27926 | 2 |
| Quadrant | Total seconds | Saturated seconds | Saturation percentage |
|---|---|---|---|
| A | 6413 | 161 | 2.510525% |
| B | 6413 | 23 | 0.358646% |
| C | 6413 | 83 | 1.294246% |
| D | 6413 | 1478 | 23.046936% |
Noise dominated data is calculated using 1-second bins in cleaned event files. If a bin has >2000 counts, and if more than 50% of those come from <1% of pixels, then it is considered to be noise-dominated and hence unusable.
| Quadrant | # 1 sec bins | Bins with >0 counts | Bins with >2000 counts | High rate bins dominated by noise | Noise dominated (total time) | Noise dominated (detector-on time) | Marked lightcurve |
|---|---|---|---|---|---|---|---|
| A | 7583 | 6414 | 165 | 165 | 2.18% | 2.57% | 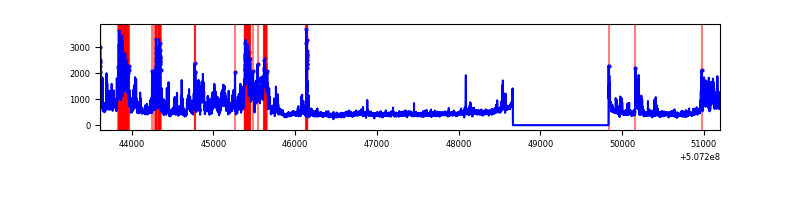 |
| B | 7583 | 6414 | 4 | 4 | 0.05% | 0.06% | 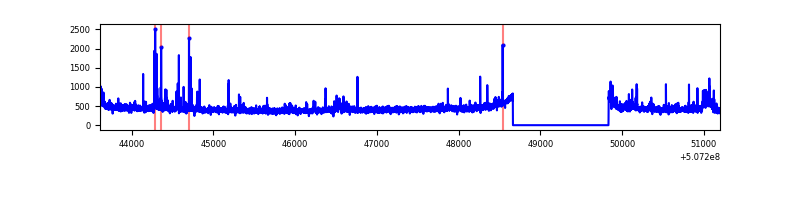 |
| C | 7582 | 6413 | 68 | 68 | 0.90% | 1.06% | 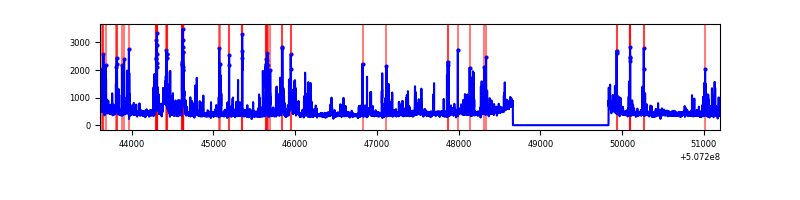 |
| D | 7583 | 6413 | 1447 | 1447 | 19.08% | 22.56% | 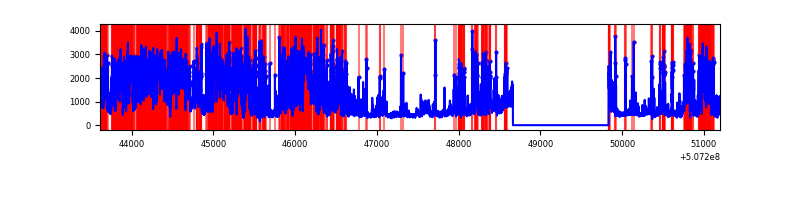 |
Top three noisy pixels from each quadrant. If the there are fewer than three noisy pixels in the level2.evt file, extra rows are filled as -1
| Pixel properties | Quadrant properties | ||||||
|---|---|---|---|---|---|---|---|
| Quadrant | DetID | PixID | Counts | Sigma | Mean | Median | Sigma |
| A | 12 | 115 | 1263116 | 7676.29 | 663 | 647 | 164.5 |
| A | 15 | 32 | 311345 | 1889.16 | 663 | 647 | 164.5 |
| A | 4 | 249 | 84532 | 510.05 | 663 | 647 | 164.5 |
| B | 5 | 185 | 92914 | 649.22 | 670 | 647 | 142.1 |
| B | 7 | 252 | 37073 | 256.3 | 670 | 647 | 142.1 |
| B | 12 | 111 | 17329 | 117.38 | 670 | 647 | 142.1 |
| C | 12 | 252 | 465579 | 2557.23 | 660 | 652 | 181.8 |
| C | 15 | 199 | 299549 | 1644.02 | 660 | 652 | 181.8 |
| C | 13 | 3 | 25153 | 134.76 | 660 | 652 | 181.8 |
| D | 11 | 129 | 5129291 | 30827.13 | 590 | 565 | 166.4 |
| D | 7 | 129 | 147601 | 883.79 | 590 | 565 | 166.4 |
| D | 3 | 12 | 119271 | 713.5 | 590 | 565 | 166.4 |
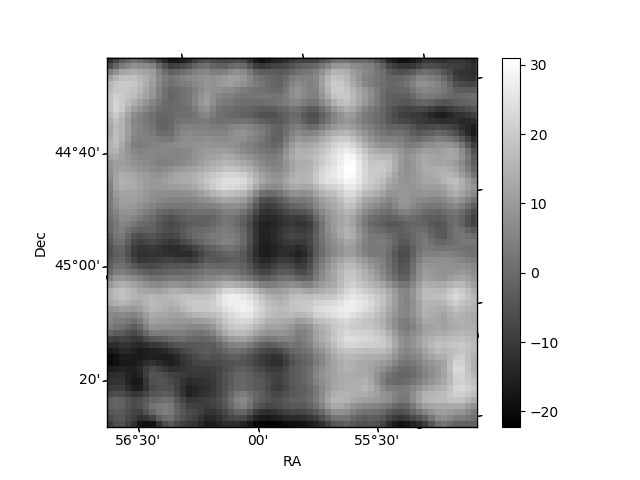
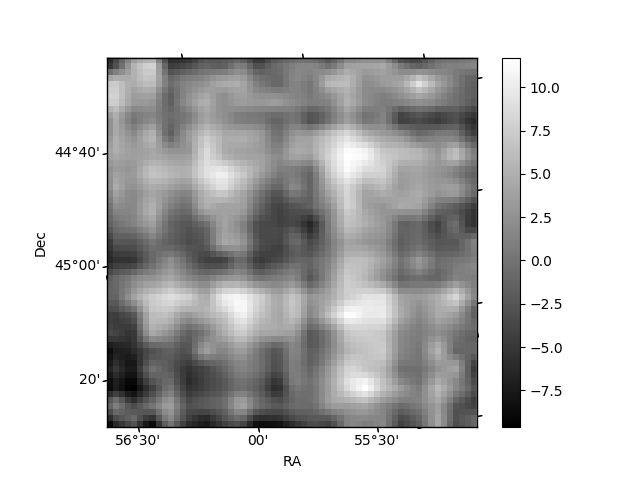
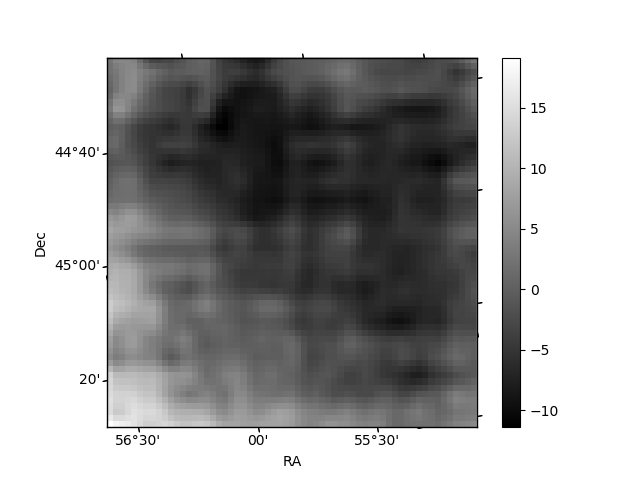
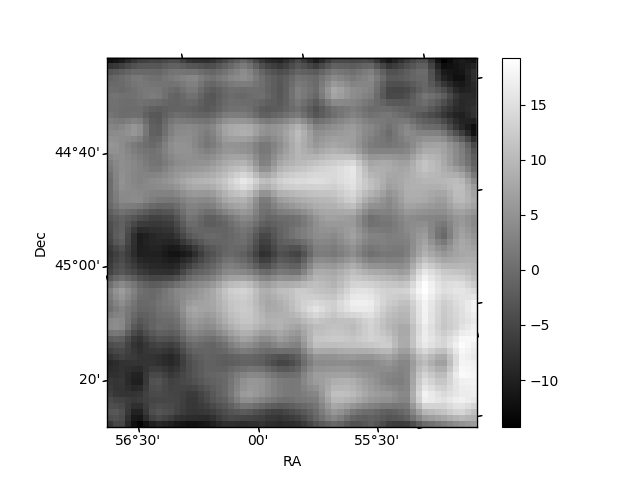
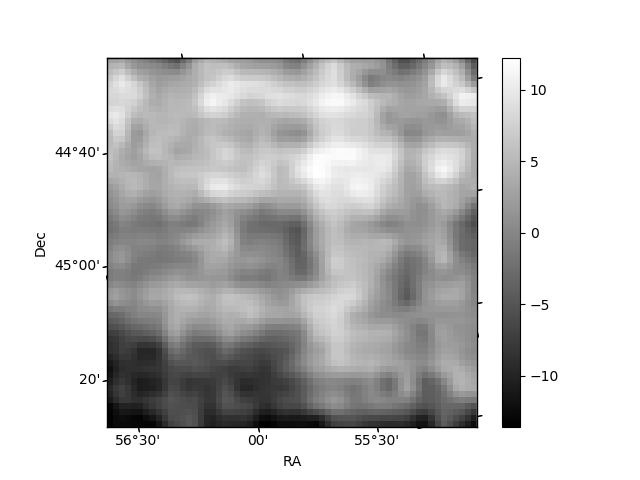
Histogram calculated using DETX and DETY for each event in the final _common_clean file
| Quadrant A | 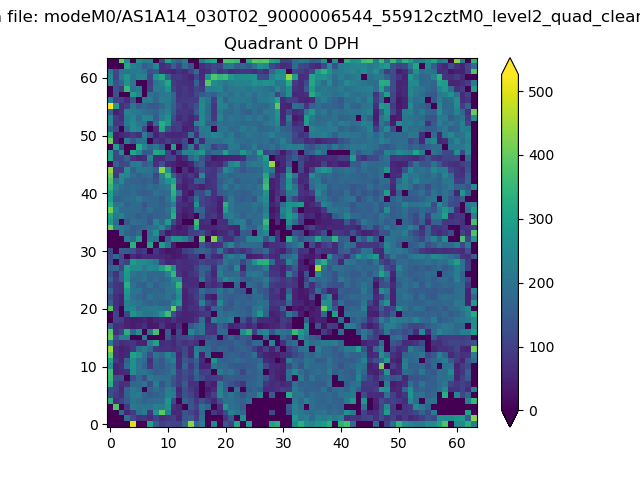 |
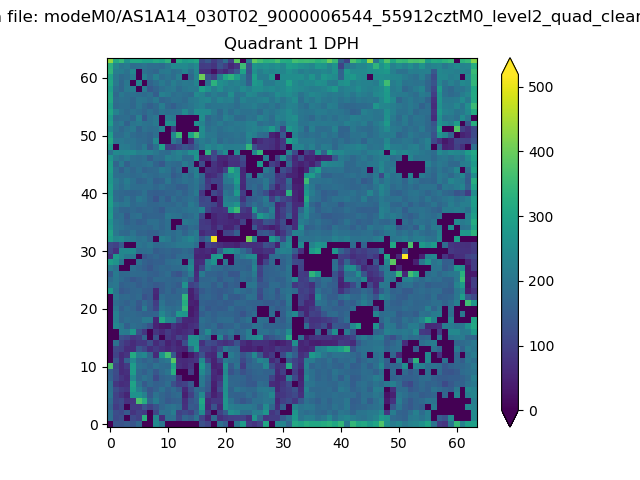 |
Quadrant B |
|---|---|---|---|
| Quadrant D | 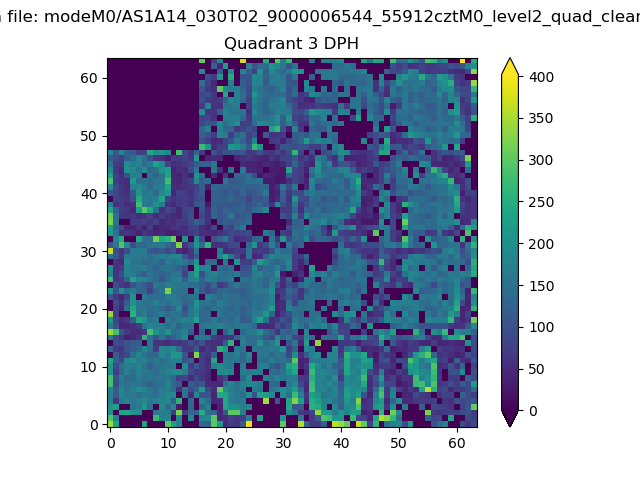 |
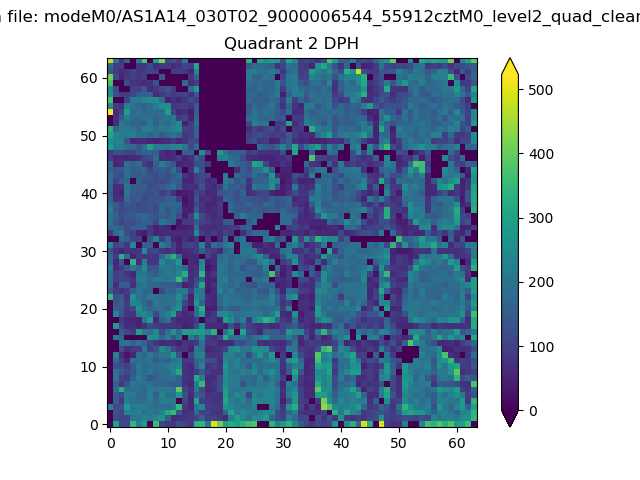 |
Quadrant C |
| Plot type | Count rate plots | Images |
|---|---|---|
| Comparison with Poisson distribution Blue bars denote a histogram of data divided into 1 sec bins. Red curve is a Poisson curve with rate = median count rate of data. |
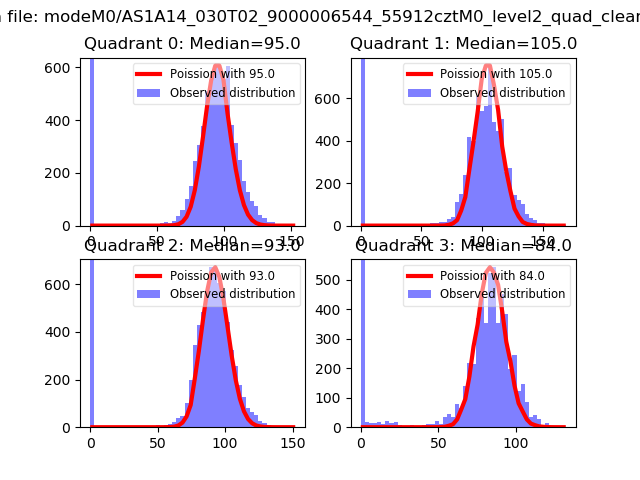 |
 |
| Quadrant-wise count rates Data is divided into 100 sec bins |
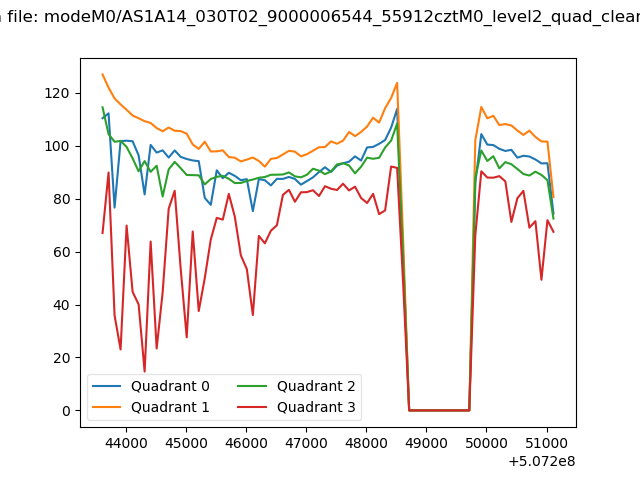 |
|
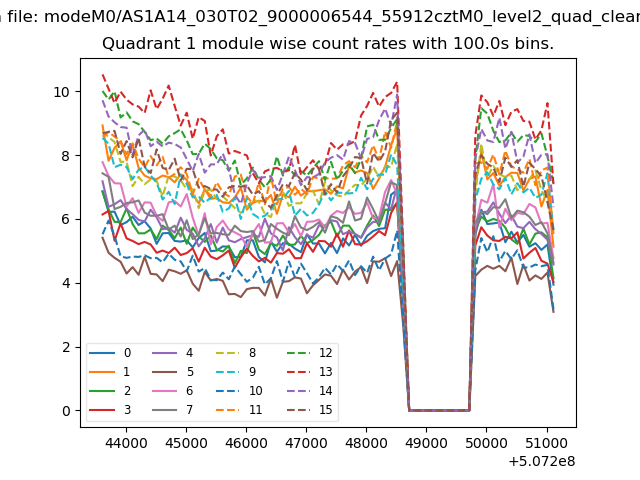
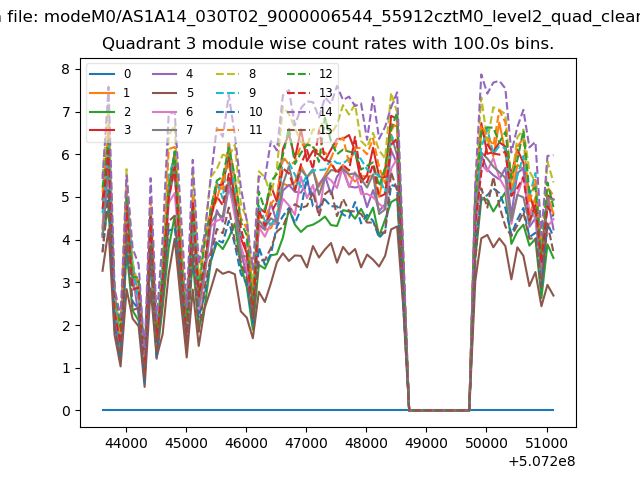
| Module-wise count rates for Quadrant A Data is divided into 100 sec bins |
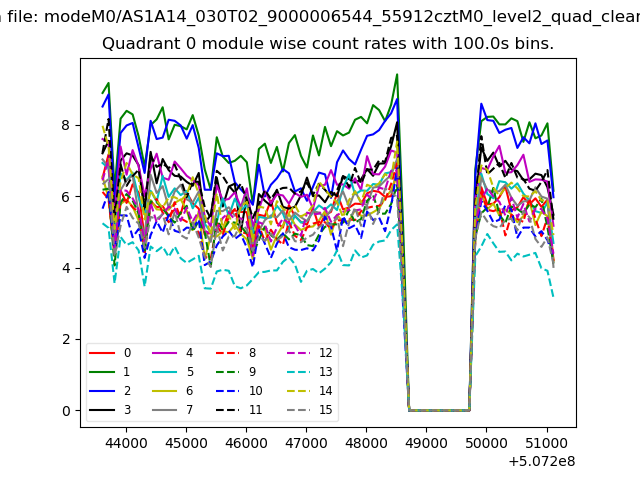 |
 |
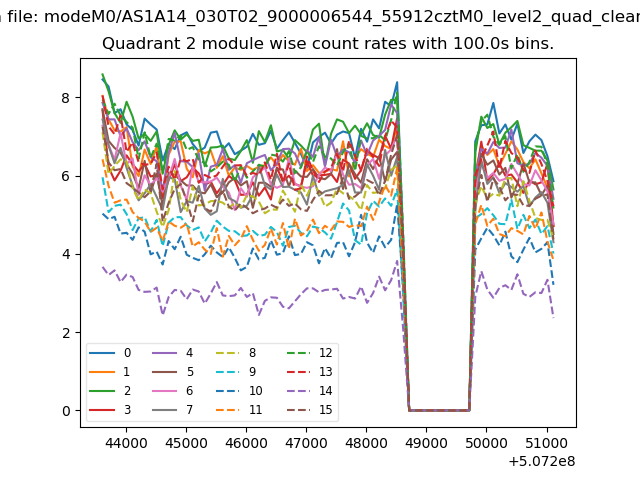
| Module-wise count rates for Quadrant B Data is divided into 100 sec bins |
 |
 |
| Module-wise count rates for Quadrant C Data is divided into 100 sec bins |
 |
 |
| Module-wise count rates for Quadrant D Data is divided into 100 sec bins |
 |
 |
| Parameter | Plot |
|---|---|
| CZT HV Monitor | 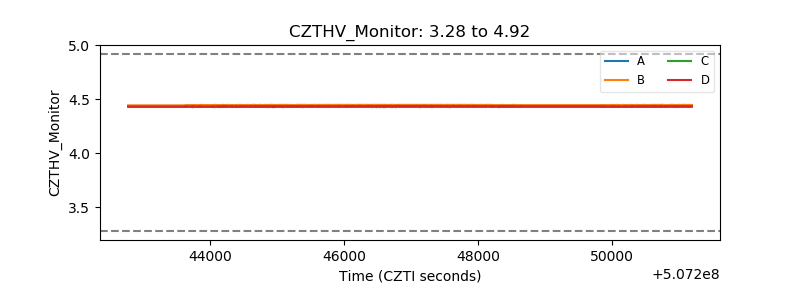 |
| D_VDD | 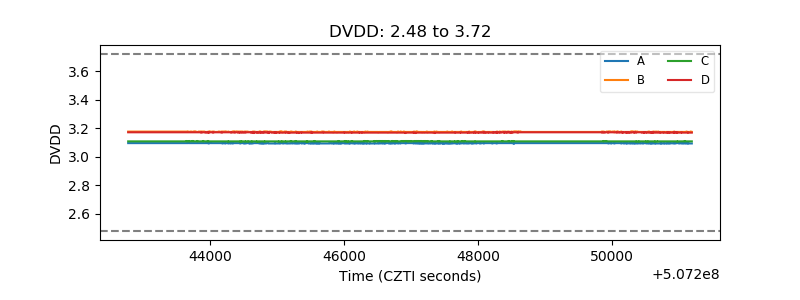 |
| Temperature 1 | 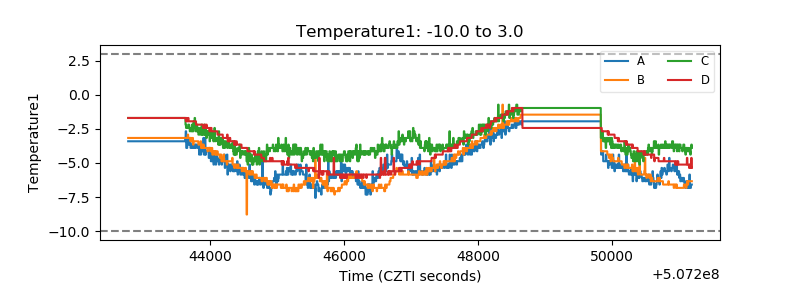 |
| Veto HV Monitor | 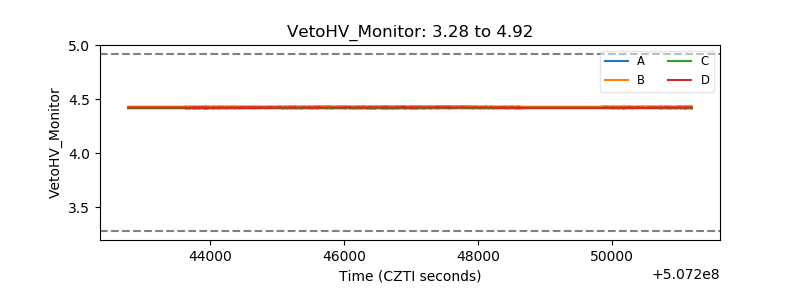 |
| Veto LLD | 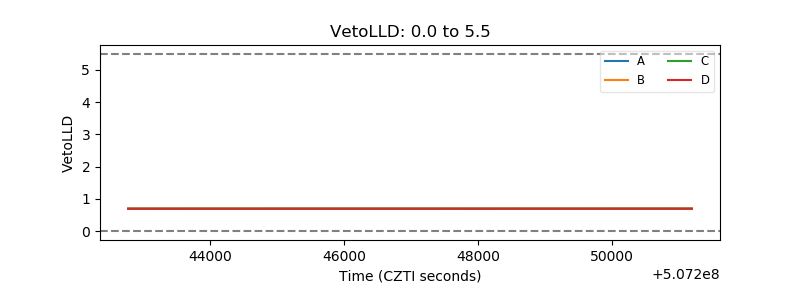 |
| Alpha Counter | 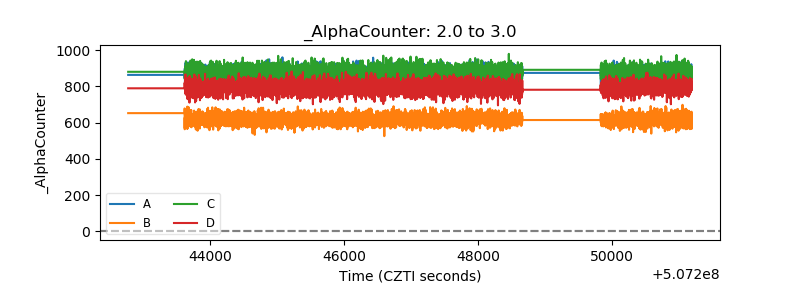 |
| _CPM_Rate | 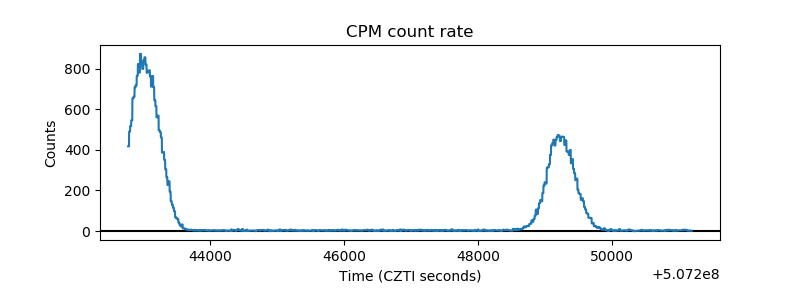 |
| CZT Counter | 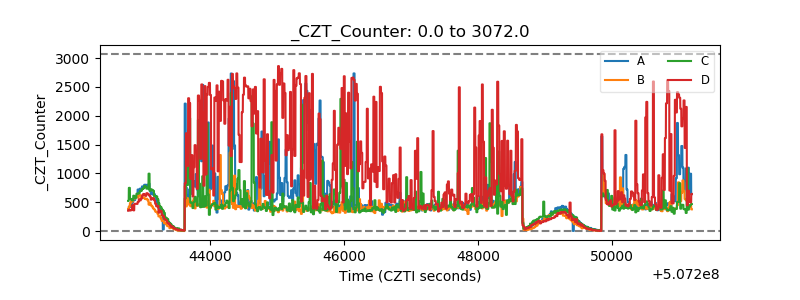 |
| +2.5 Volts monitor | 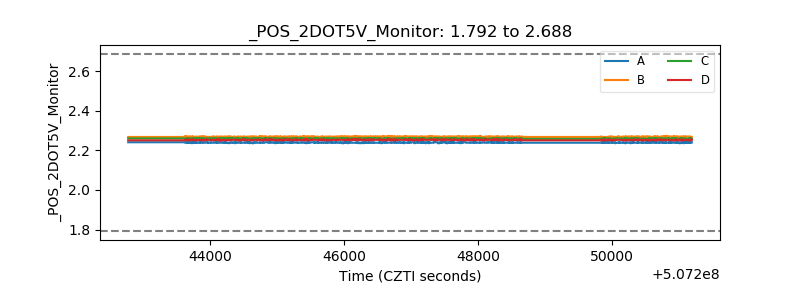 |
| +5 Volts monitor | 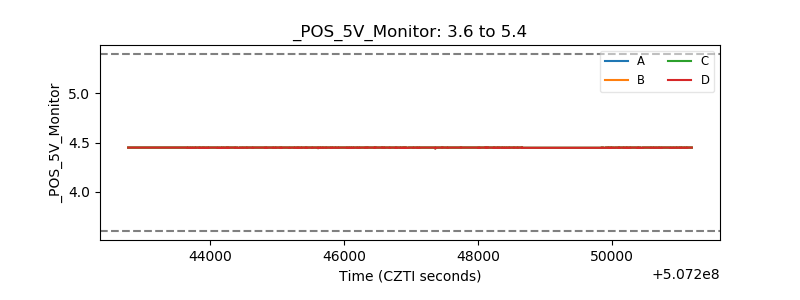 |
| _ROLL_ROT | 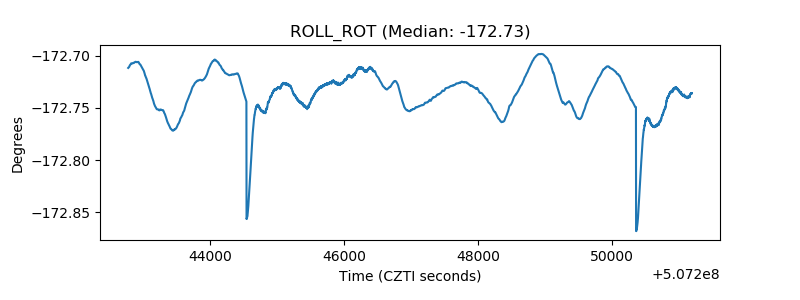 |
| _Roll_DEC | 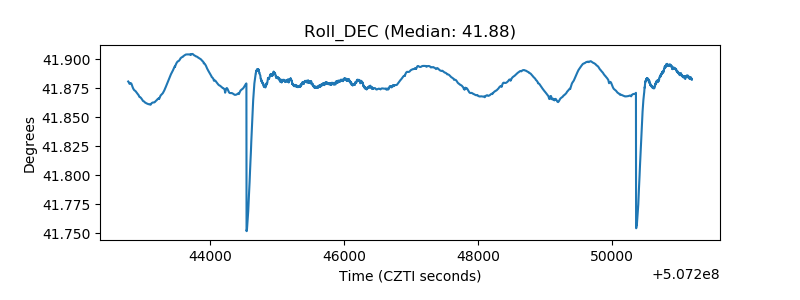 |
| _Roll_RA | 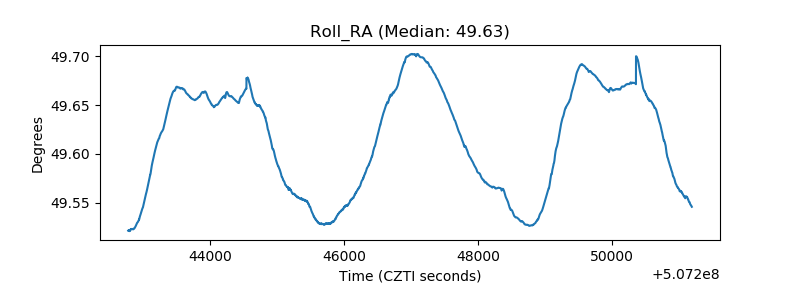 |
| Veto Counter | 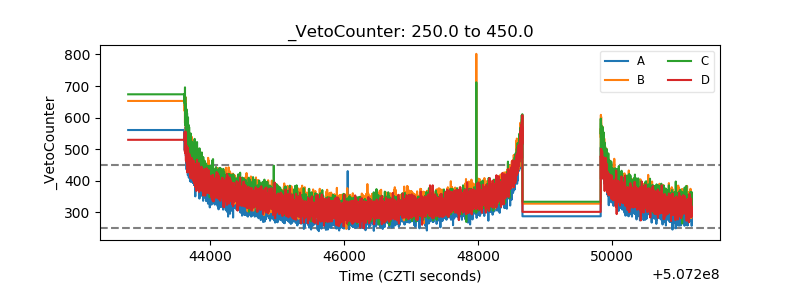 |