| Param | Original file | Final file |
|---|---|---|
| Filename | modeM0/AS1A14_030T02_9000006544_55915cztM0_level2.fits | modeM0/AS1A14_030T02_9000006544_55915cztM0_level2_quad_clean.evt |
| Size (bytes) | 543,052,800 | 110,983,680 |
| Size | 517.9 MB | 105.8 MB |
| Events in quadrant A | 5,219,476 | 703,122 |
| Events in quadrant B | 3,677,795 | 786,207 |
| Events in quadrant C | 4,560,168 | 688,558 |
| Events in quadrant D | 6,030,749 | 632,828 |
| Mode SS | |||
|---|---|---|---|
| Quadrant | BADHDUFLAG | Total packets | Discarded packets |
| A | 0 | 158 | 0 |
| B | 0 | 158 | 0 |
| C | 0 | 158 | 0 |
| D | 0 | 158 | 0 |
| Mode M9 | |||
|---|---|---|---|
| Quadrant | BADHDUFLAG | Total packets | Discarded packets |
| A | 0 | 1 | 0 |
| B | 0 | 2 | 0 |
| C | 0 | 2 | 0 |
| D | 0 | 2 | 0 |
| Mode M0 | |||
|---|---|---|---|
| Quadrant | BADHDUFLAG | Total packets | Discarded packets |
| A | 0 | 21184 | 1 |
| B | 0 | 16819 | 2 |
| C | 0 | 19594 | 1 |
| D | 0 | 23391 | 1 |
| Quadrant | Total seconds | Saturated seconds | Saturation percentage |
|---|---|---|---|
| A | 7908 | 378 | 4.779970% |
| B | 7907 | 95 | 1.201467% |
| C | 7907 | 281 | 3.553813% |
| D | 7907 | 441 | 5.577337% |
Noise dominated data is calculated using 1-second bins in cleaned event files. If a bin has >2000 counts, and if more than 50% of those come from <1% of pixels, then it is considered to be noise-dominated and hence unusable.
| Quadrant | # 1 sec bins | Bins with >0 counts | Bins with >2000 counts | High rate bins dominated by noise | Noise dominated (total time) | Noise dominated (detector-on time) | Marked lightcurve |
|---|---|---|---|---|---|---|---|
| A | 7908 | 7908 | 360 | 360 | 4.55% | 4.55% | 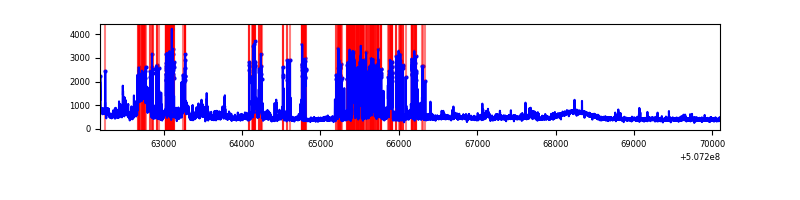 |
| B | 7907 | 7907 | 13 | 13 | 0.16% | 0.16% | 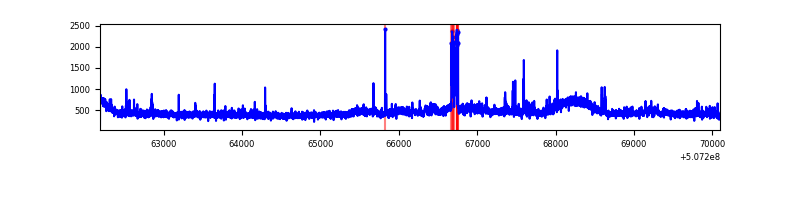 |
| C | 7907 | 7907 | 203 | 203 | 2.57% | 2.57% | 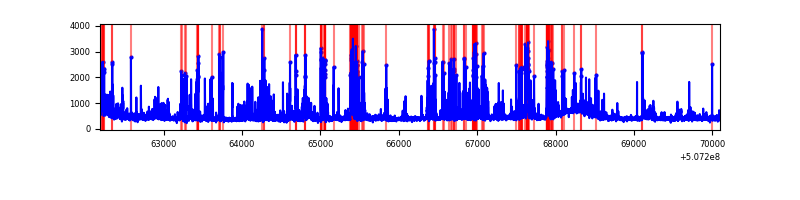 |
| D | 7907 | 7907 | 400 | 400 | 5.06% | 5.06% | 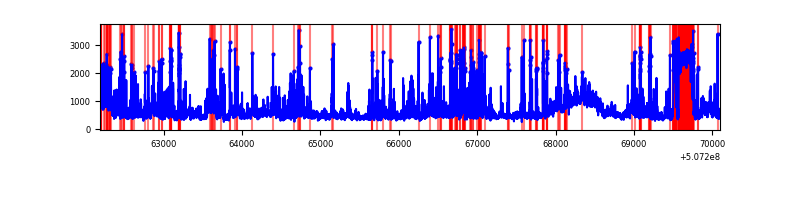 |
Top three noisy pixels from each quadrant. If the there are fewer than three noisy pixels in the level2.evt file, extra rows are filled as -1
| Pixel properties | Quadrant properties | ||||||
|---|---|---|---|---|---|---|---|
| Quadrant | DetID | PixID | Counts | Sigma | Mean | Median | Sigma |
| A | 0 | 8 | 1204820 | 5963.8 | 822 | 799 | 201.9 |
| A | 12 | 115 | 543723 | 2689.23 | 822 | 799 | 201.9 |
| A | 7 | 64 | 131515 | 647.47 | 822 | 799 | 201.9 |
| B | 7 | 0 | 167139 | 927.57 | 833 | 800 | 179.3 |
| B | 0 | 171 | 121682 | 674.09 | 833 | 800 | 179.3 |
| B | 0 | 199 | 24849 | 134.1 | 833 | 800 | 179.3 |
| C | 12 | 252 | 747703 | 3391.8 | 813 | 805 | 220.2 |
| C | 15 | 199 | 390844 | 1771.24 | 813 | 805 | 220.2 |
| C | 13 | 3 | 146898 | 663.44 | 813 | 805 | 220.2 |
| D | 11 | 129 | 1991857 | 8960.66 | 795 | 761 | 222.2 |
| D | 12 | 16 | 447148 | 2008.9 | 795 | 761 | 222.2 |
| D | 7 | 129 | 213619 | 957.94 | 795 | 761 | 222.2 |
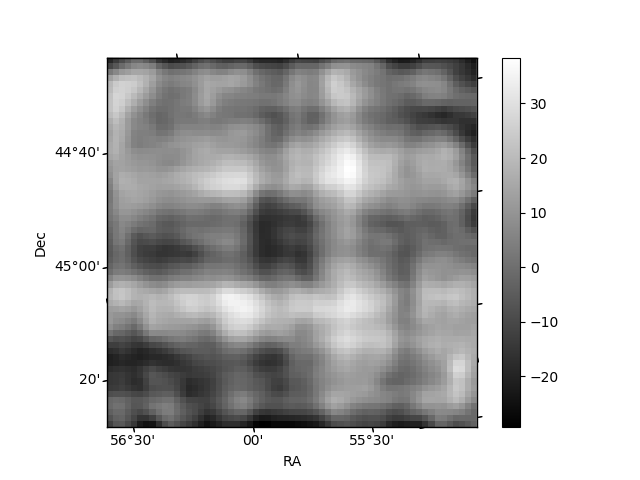
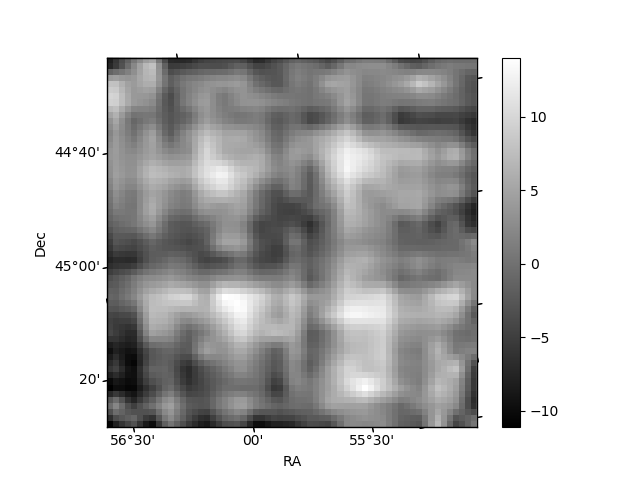
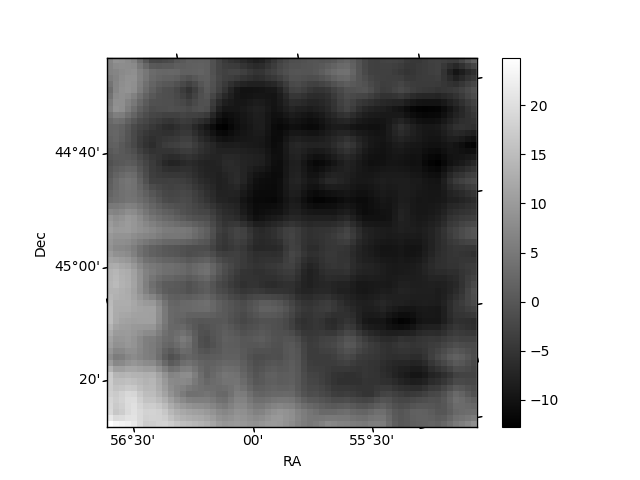
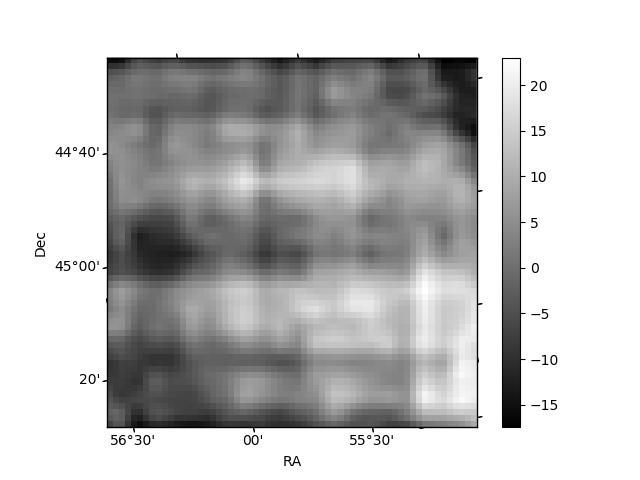
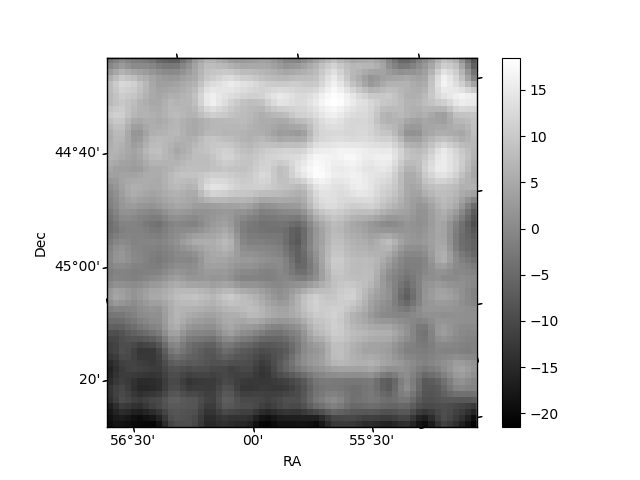
Histogram calculated using DETX and DETY for each event in the final _common_clean file
| Quadrant A | 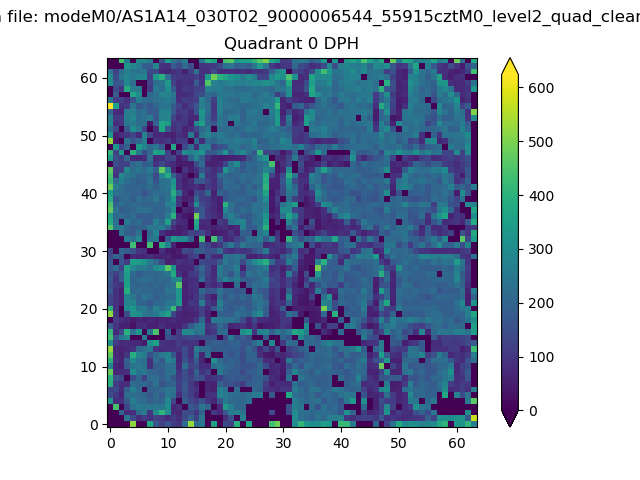 |
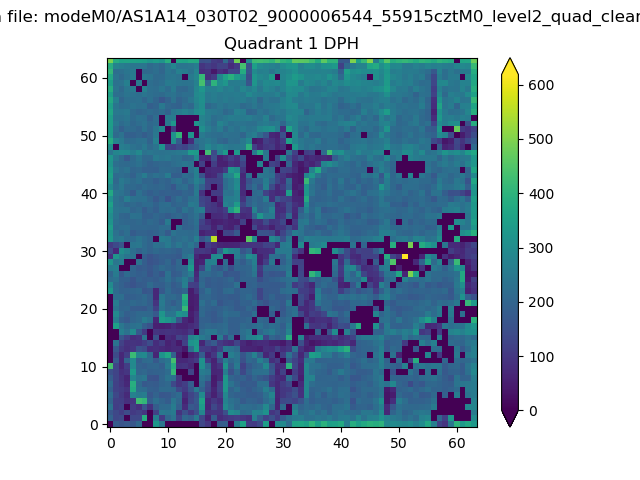 |
Quadrant B |
|---|---|---|---|
| Quadrant D | 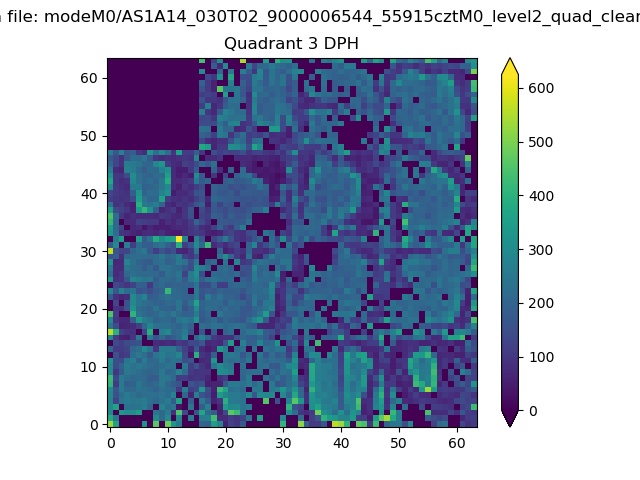 |
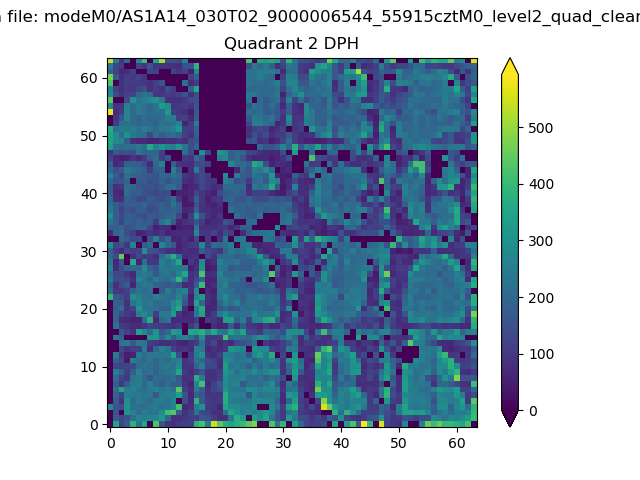 |
Quadrant C |
| Plot type | Count rate plots | Images |
|---|---|---|
| Comparison with Poisson distribution Blue bars denote a histogram of data divided into 1 sec bins. Red curve is a Poisson curve with rate = median count rate of data. |
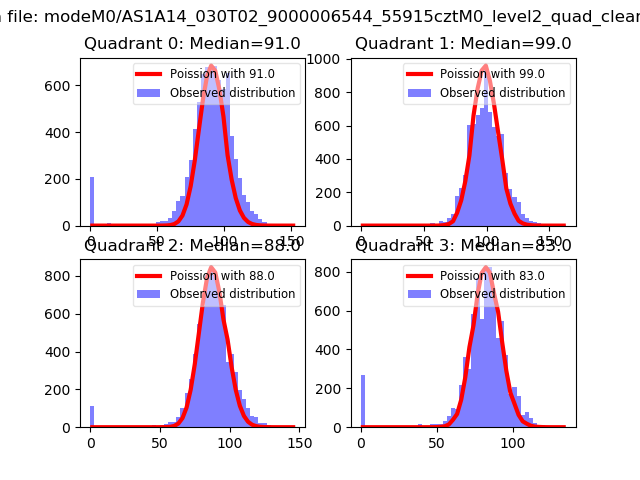 |
 |
| Quadrant-wise count rates Data is divided into 100 sec bins |
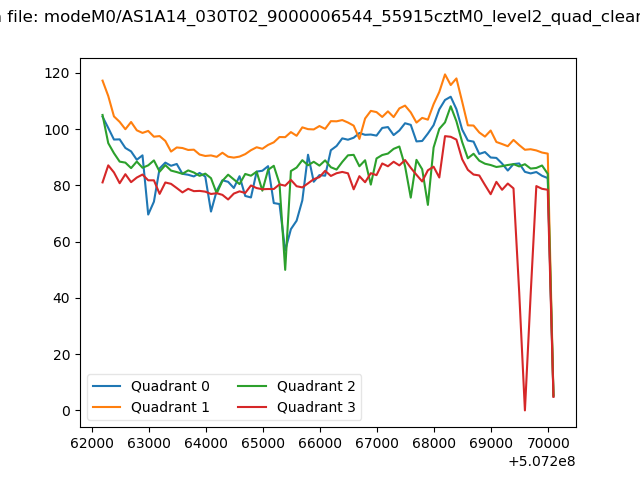 |
|
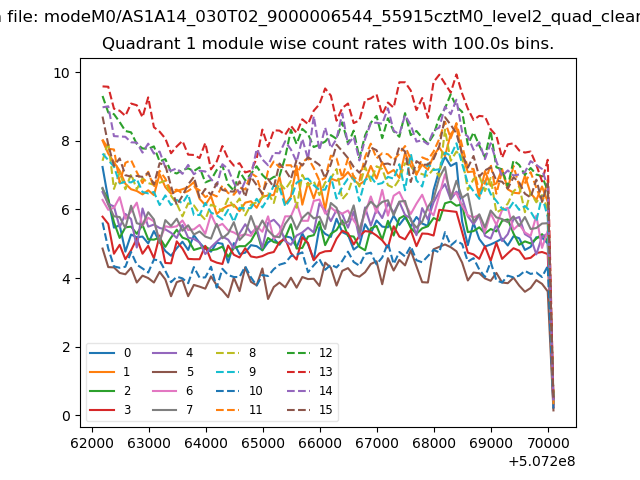
| Module-wise count rates for Quadrant A Data is divided into 100 sec bins |
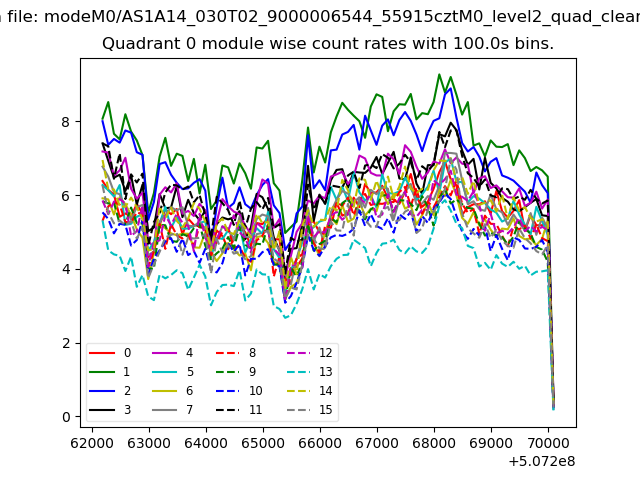 |
 |
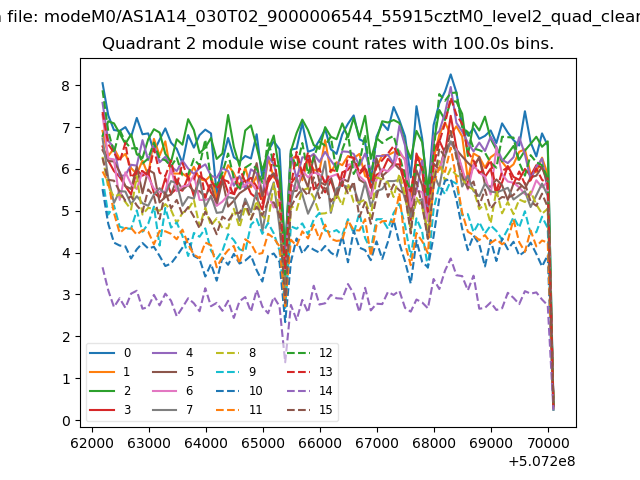
| Module-wise count rates for Quadrant B Data is divided into 100 sec bins |
 |
 |
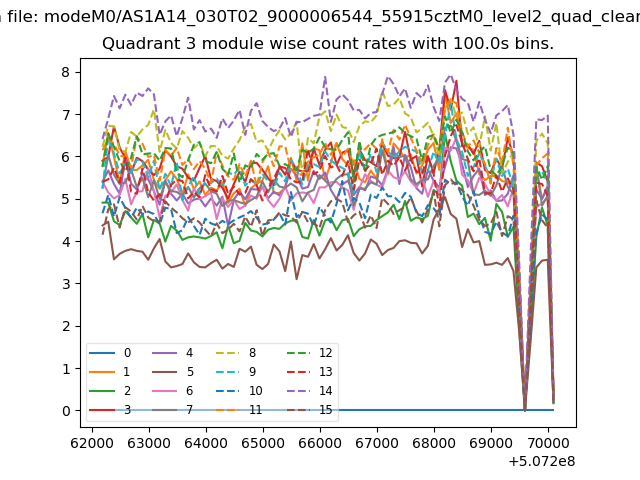
| Module-wise count rates for Quadrant C Data is divided into 100 sec bins |
 |
 |
| Module-wise count rates for Quadrant D Data is divided into 100 sec bins |
 |
 |
| Parameter | Plot |
|---|---|
| CZT HV Monitor | 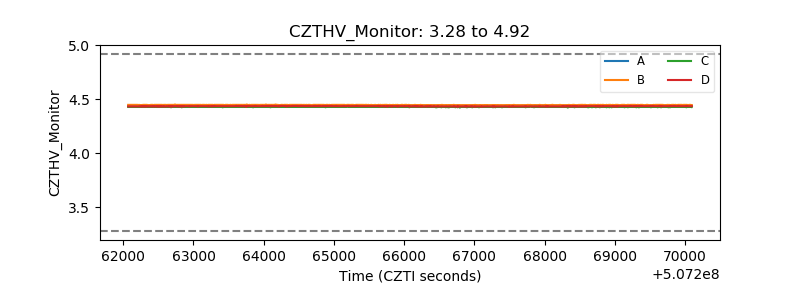 |
| D_VDD | 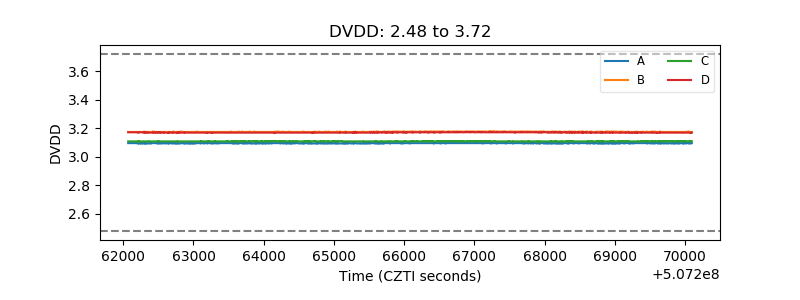 |
| Temperature 1 | 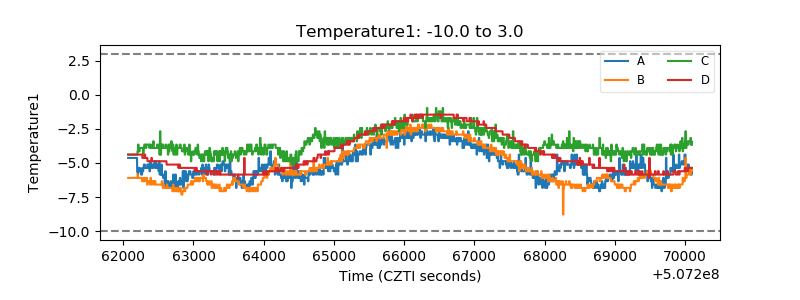 |
| Veto HV Monitor | 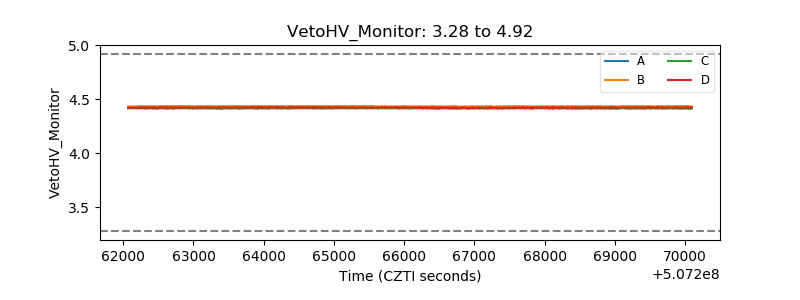 |
| Veto LLD | 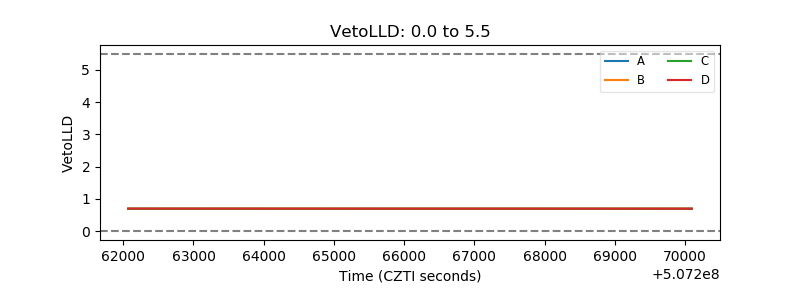 |
| Alpha Counter | 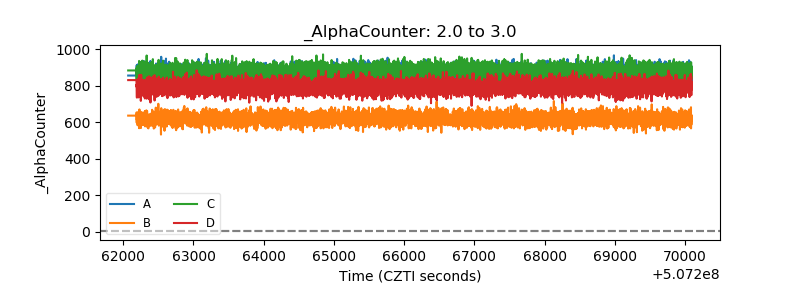 |
| _CPM_Rate | 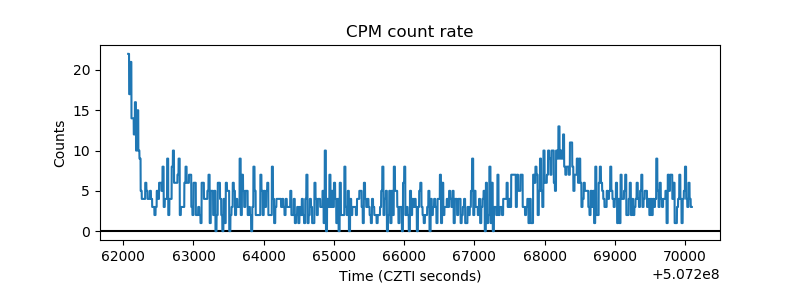 |
| CZT Counter | 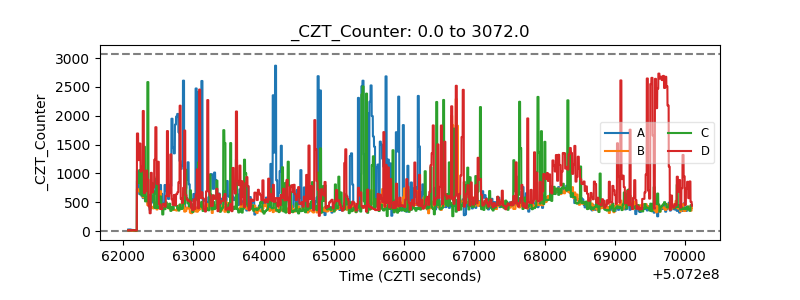 |
| +2.5 Volts monitor |  |
| +5 Volts monitor | 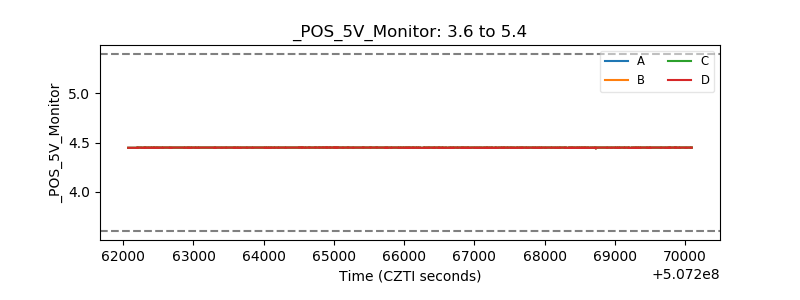 |
| _ROLL_ROT | 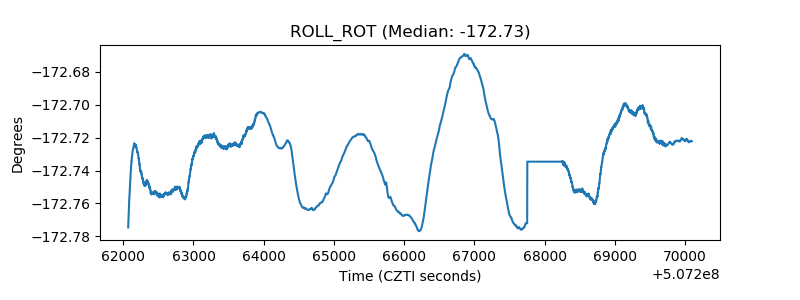 |
| _Roll_DEC | 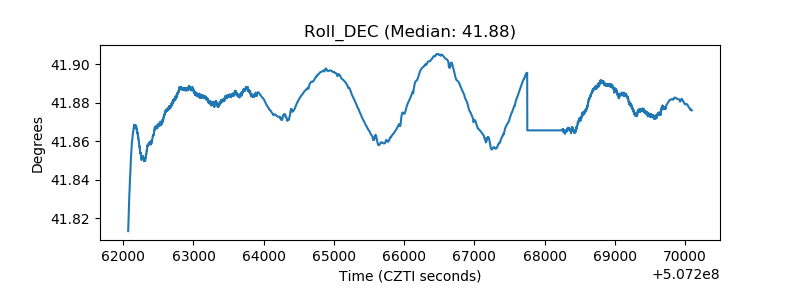 |
| _Roll_RA | 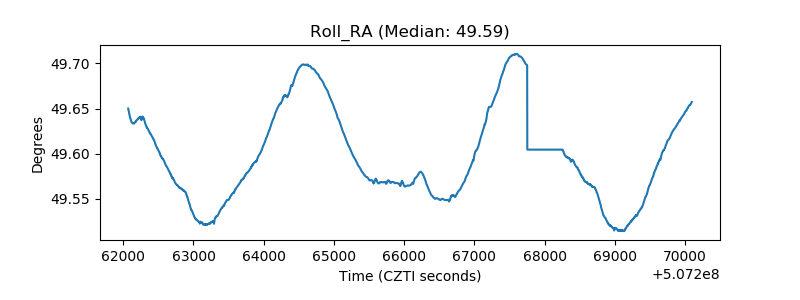 |
| Veto Counter | 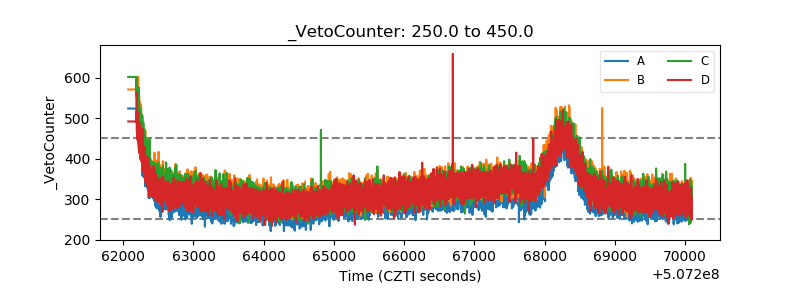 |