| Param | Original file | Final file |
|---|---|---|
| Filename | modeM0/AS1A14_030T02_9000006544_55916cztM0_level2.fits | modeM0/AS1A14_030T02_9000006544_55916cztM0_level2_quad_clean.evt |
| Size (bytes) | 523,733,760 | 109,975,680 |
| Size | 499.5 MB | 104.9 MB |
| Events in quadrant A | 3,440,876 | 722,932 |
| Events in quadrant B | 3,702,450 | 782,256 |
| Events in quadrant C | 4,280,115 | 689,171 |
| Events in quadrant D | 7,347,729 | 584,327 |
| Mode SS | |||
|---|---|---|---|
| Quadrant | BADHDUFLAG | Total packets | Discarded packets |
| A | 0 | 160 | 0 |
| B | 0 | 160 | 0 |
| C | 0 | 160 | 0 |
| D | 0 | 160 | 0 |
| Mode M0 | |||
|---|---|---|---|
| Quadrant | BADHDUFLAG | Total packets | Discarded packets |
| A | 0 | 16224 | 0 |
| B | 0 | 16985 | 0 |
| C | 0 | 18760 | 0 |
| D | 0 | 27320 | 0 |
| Quadrant | Total seconds | Saturated seconds | Saturation percentage |
|---|---|---|---|
| A | 7923 | 8 | 0.100972% |
| B | 7924 | 45 | 0.567895% |
| C | 7924 | 240 | 3.028773% |
| D | 7924 | 991 | 12.506310% |
Noise dominated data is calculated using 1-second bins in cleaned event files. If a bin has >2000 counts, and if more than 50% of those come from <1% of pixels, then it is considered to be noise-dominated and hence unusable.
| Quadrant | # 1 sec bins | Bins with >0 counts | Bins with >2000 counts | High rate bins dominated by noise | Noise dominated (total time) | Noise dominated (detector-on time) | Marked lightcurve |
|---|---|---|---|---|---|---|---|
| A | 7923 | 7923 | 2 | 2 | 0.03% | 0.03% | 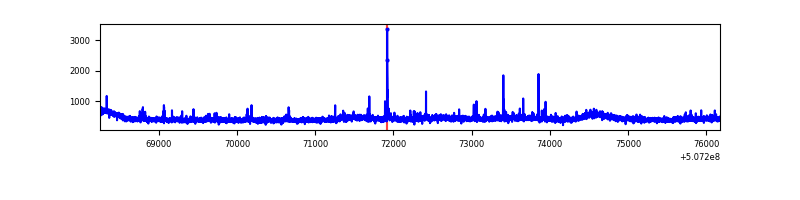 |
| B | 7924 | 7924 | 5 | 5 | 0.06% | 0.06% | 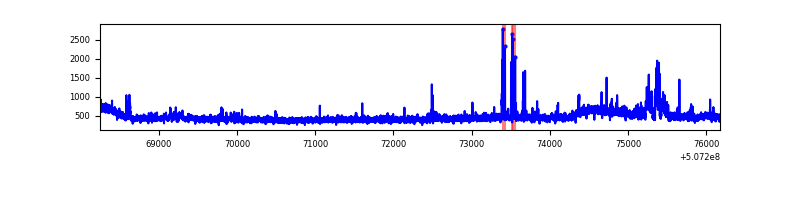 |
| C | 7924 | 7924 | 203 | 203 | 2.56% | 2.56% | 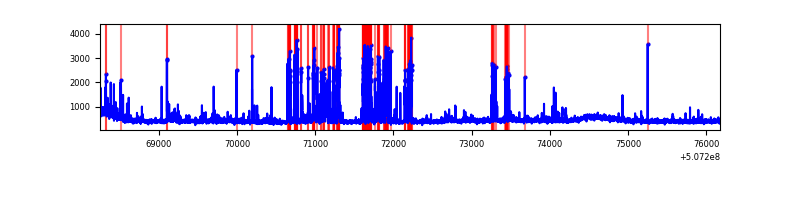 |
| D | 7924 | 7924 | 890 | 890 | 11.23% | 11.23% | 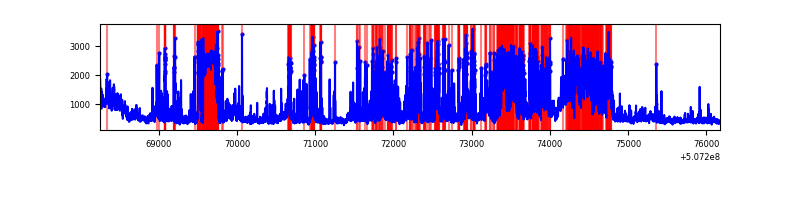 |
Top three noisy pixels from each quadrant. If the there are fewer than three noisy pixels in the level2.evt file, extra rows are filled as -1
| Pixel properties | Quadrant properties | ||||||
|---|---|---|---|---|---|---|---|
| Quadrant | DetID | PixID | Counts | Sigma | Mean | Median | Sigma |
| A | 7 | 64 | 64658 | 311.11 | 830 | 808 | 205.2 |
| A | 4 | 3 | 33088 | 157.28 | 830 | 808 | 205.2 |
| A | 12 | 115 | 32537 | 154.6 | 830 | 808 | 205.2 |
| B | 7 | 0 | 174078 | 968.91 | 828 | 794 | 178.8 |
| B | 2 | 249 | 149481 | 831.38 | 828 | 794 | 178.8 |
| B | 7 | 252 | 32113 | 175.12 | 828 | 794 | 178.8 |
| C | 12 | 252 | 579476 | 2621.26 | 810 | 801 | 220.8 |
| C | 15 | 199 | 369400 | 1669.66 | 810 | 801 | 220.8 |
| C | 13 | 3 | 79227 | 355.25 | 810 | 801 | 220.8 |
| D | 11 | 129 | 3431944 | 16082.8 | 761 | 728 | 213.3 |
| D | 12 | 16 | 597735 | 2798.29 | 761 | 728 | 213.3 |
| D | 7 | 96 | 150370 | 701.4 | 761 | 728 | 213.3 |
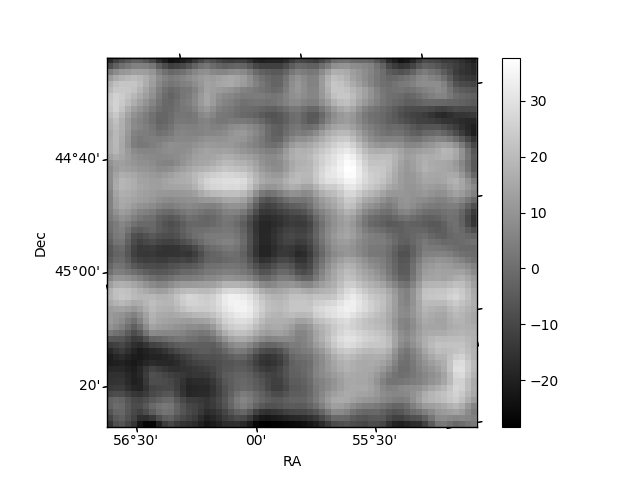
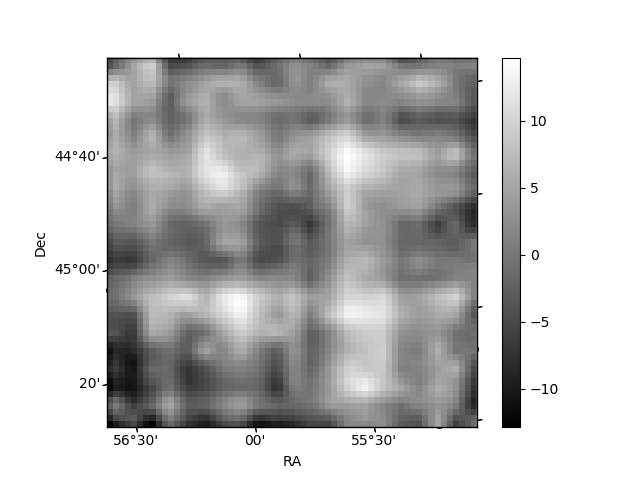
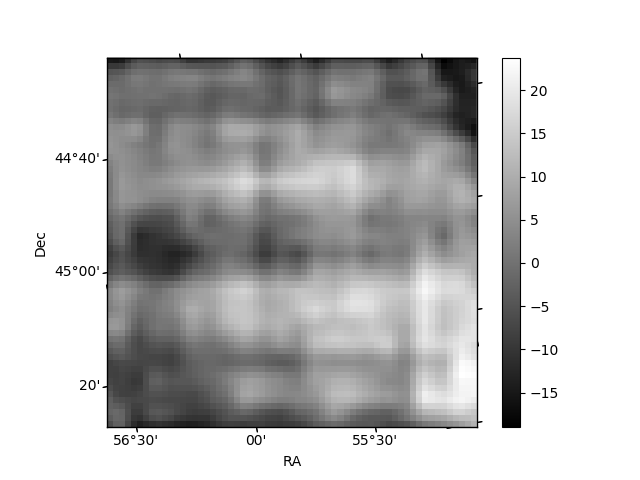
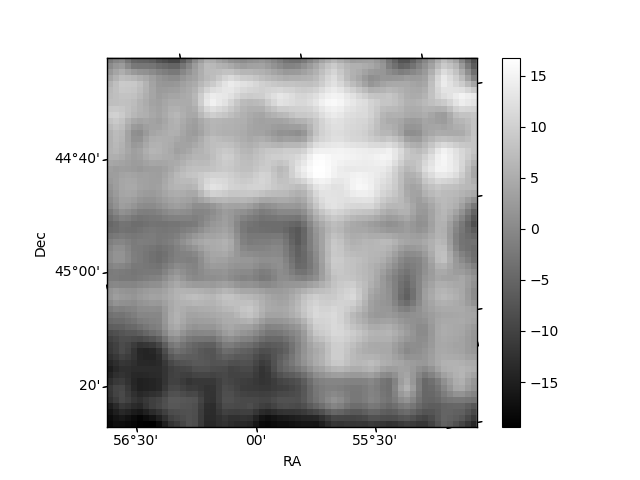
Histogram calculated using DETX and DETY for each event in the final _common_clean file
| Quadrant A | 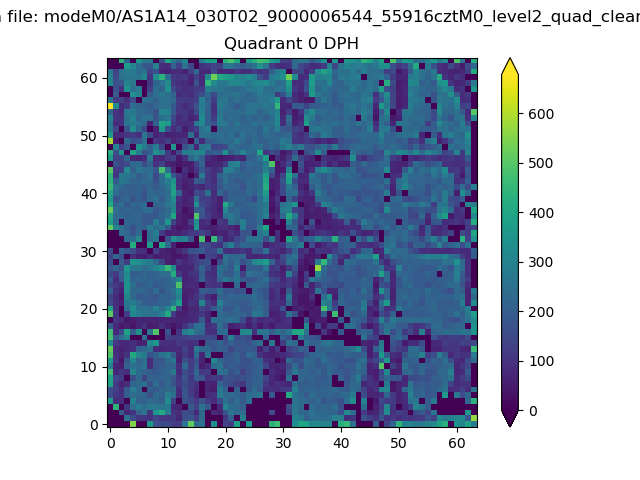 |
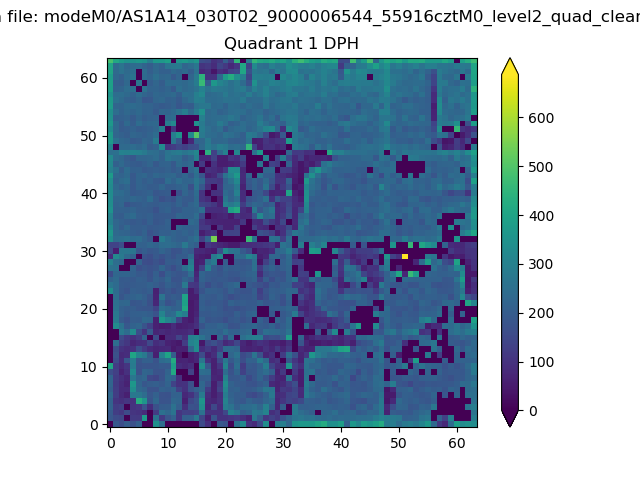 |
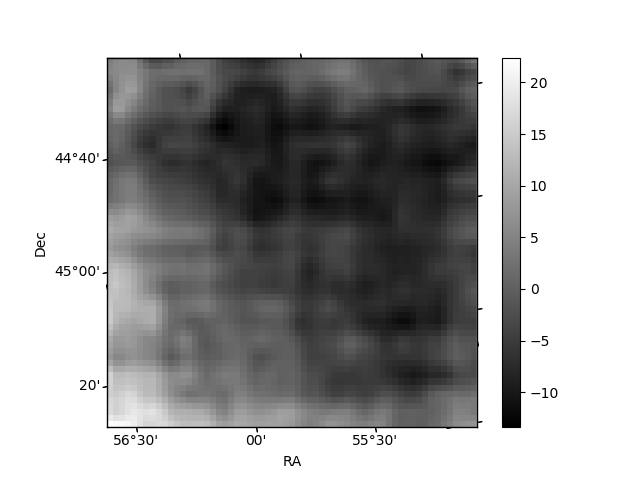
Quadrant B |
|---|---|---|---|
| Quadrant D | 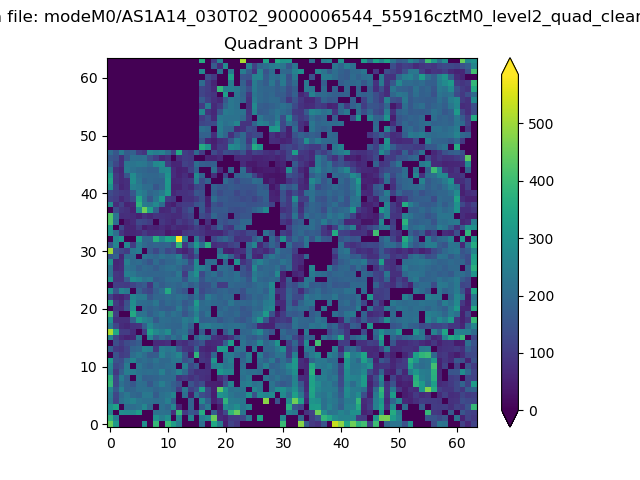 |
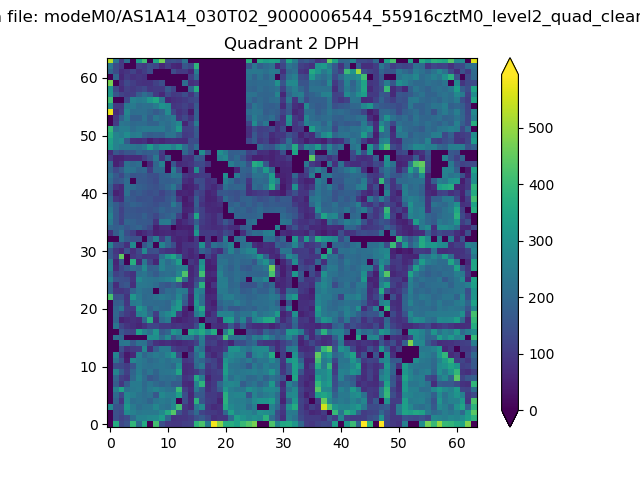 |
Quadrant C |
| Plot type | Count rate plots | Images |
|---|---|---|
| Comparison with Poisson distribution Blue bars denote a histogram of data divided into 1 sec bins. Red curve is a Poisson curve with rate = median count rate of data. |
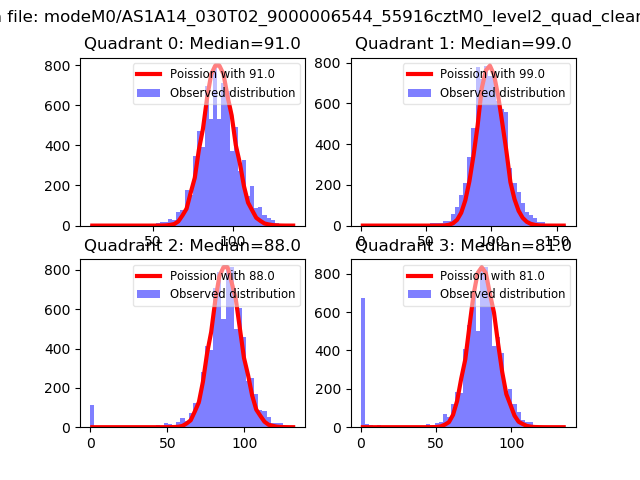 |
 |
| Quadrant-wise count rates Data is divided into 100 sec bins |
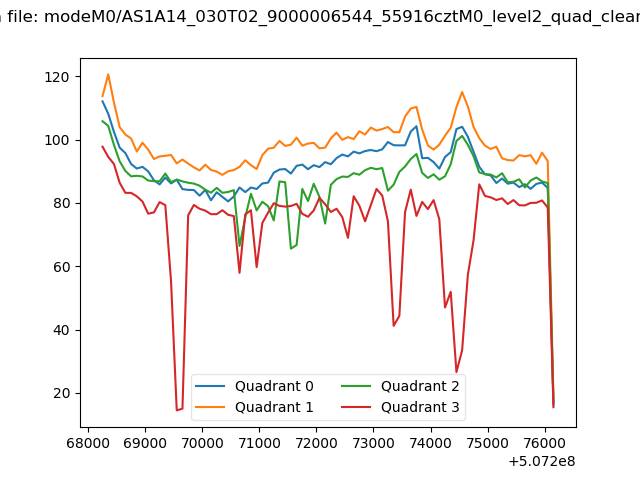 |
|
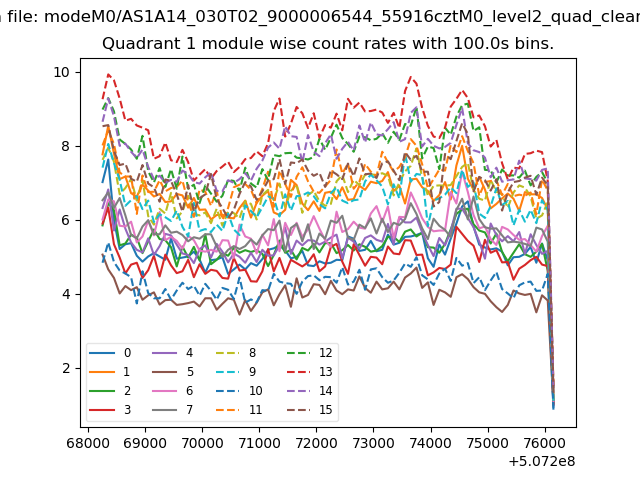
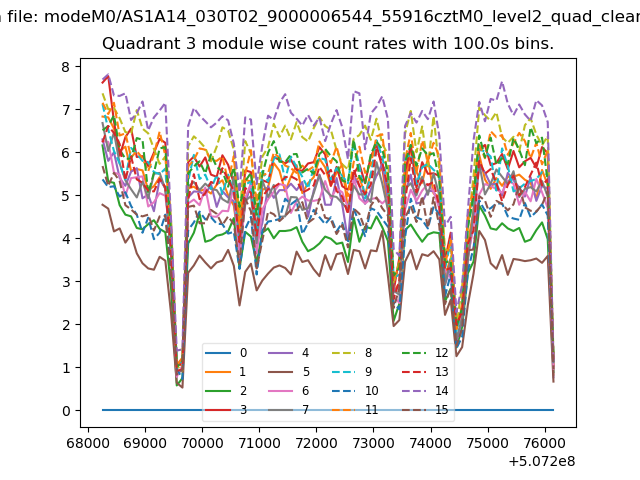
| Module-wise count rates for Quadrant A Data is divided into 100 sec bins |
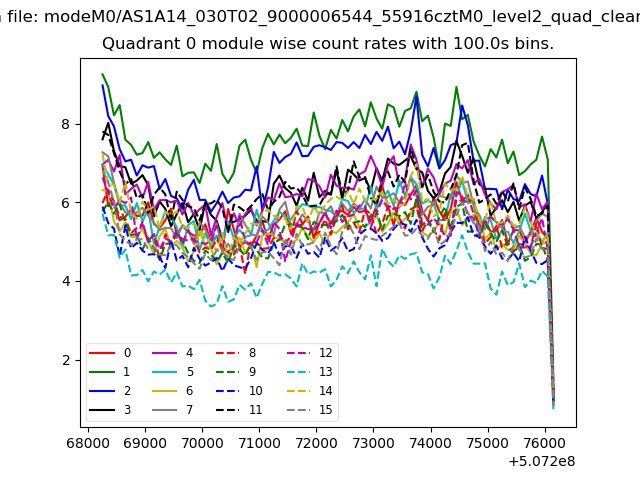 |
 |
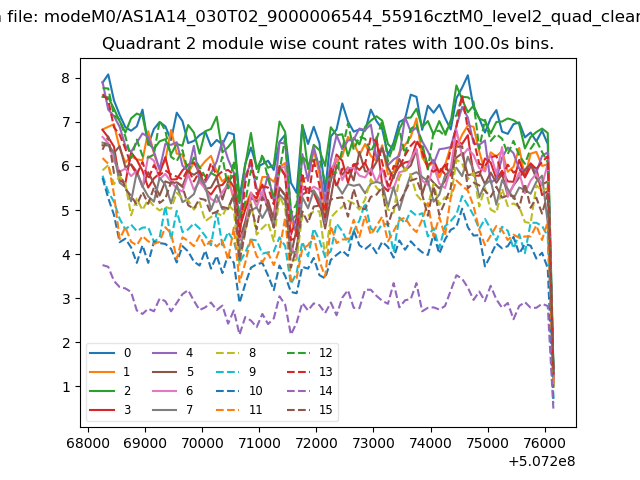
| Module-wise count rates for Quadrant B Data is divided into 100 sec bins |
 |
 |
| Module-wise count rates for Quadrant C Data is divided into 100 sec bins |
 |
 |
| Module-wise count rates for Quadrant D Data is divided into 100 sec bins |
 |
 |
| Parameter | Plot |
|---|---|
| CZT HV Monitor | 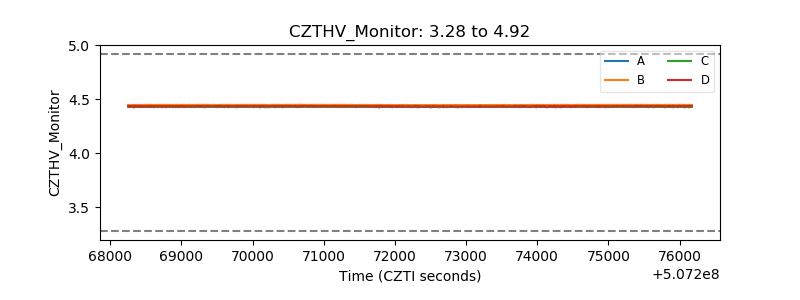 |
| D_VDD | 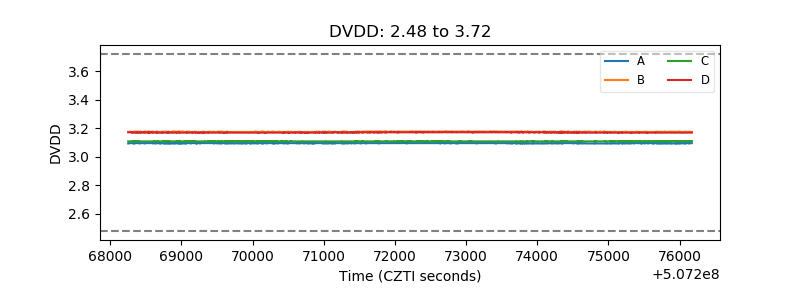 |
| Temperature 1 | 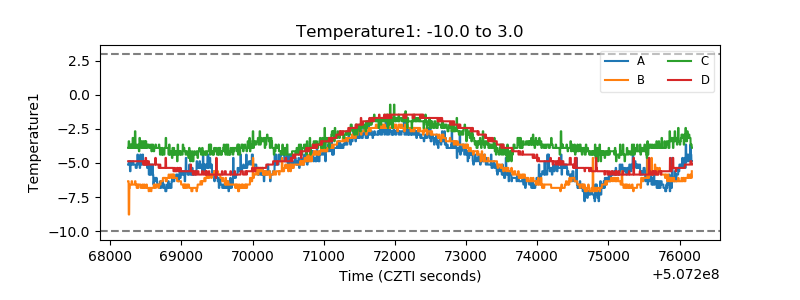 |
| Veto HV Monitor | 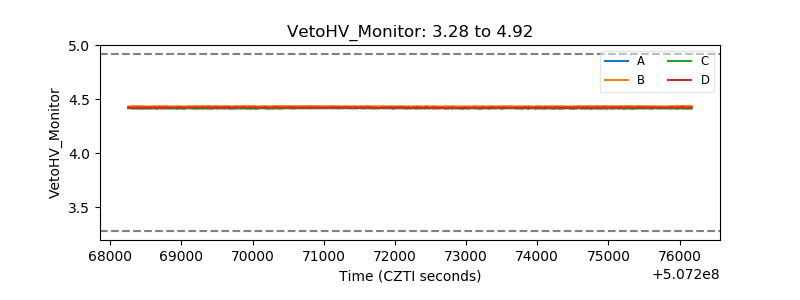 |
| Veto LLD | 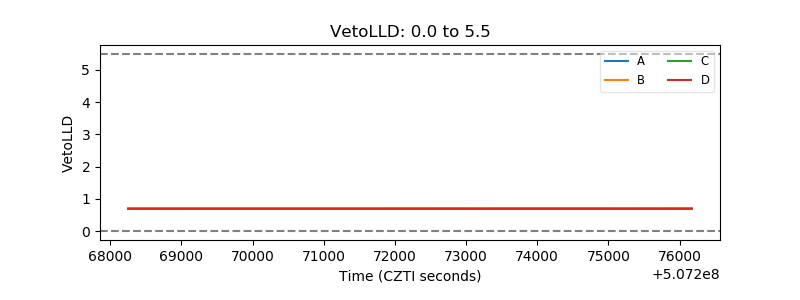 |
| Alpha Counter | 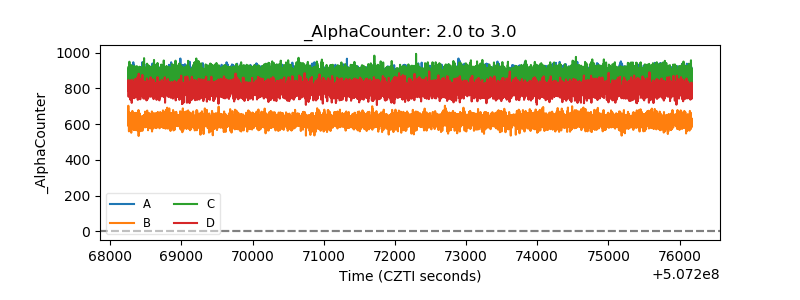 |
| _CPM_Rate | 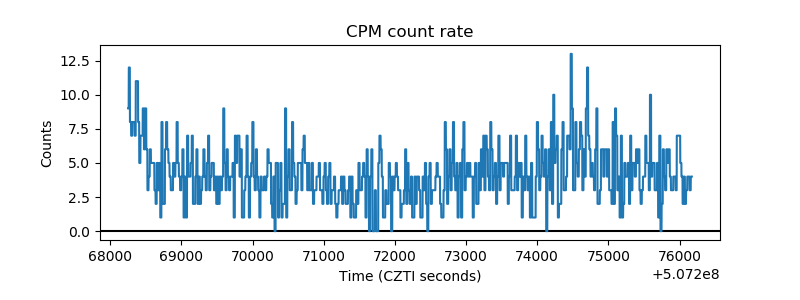 |
| CZT Counter | 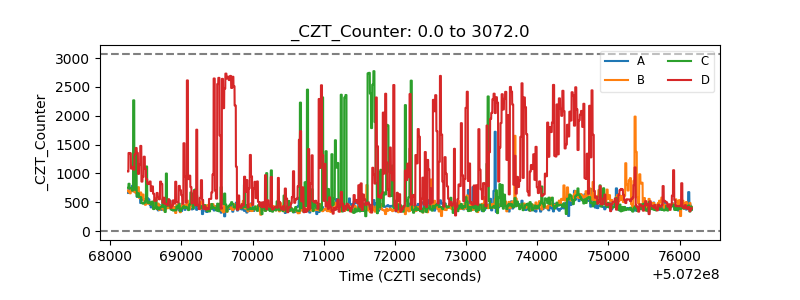 |
| +2.5 Volts monitor | 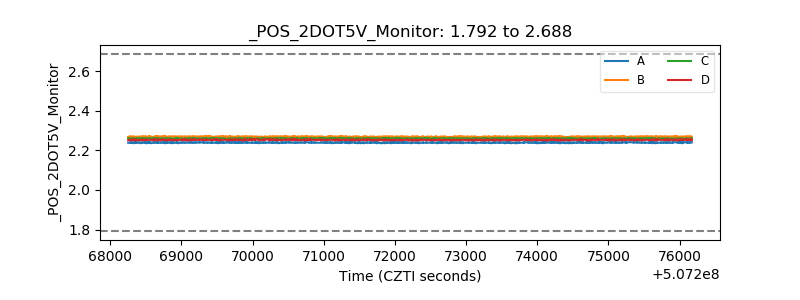 |
| +5 Volts monitor | 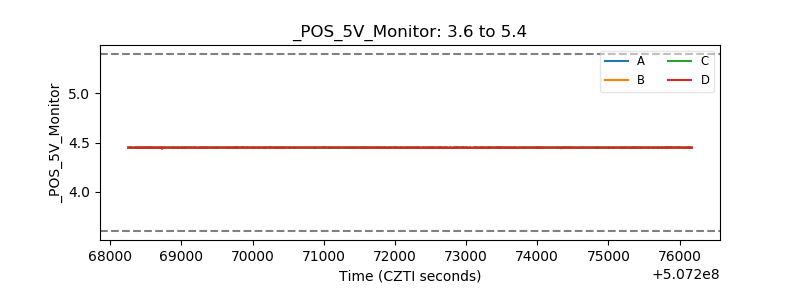 |
| _ROLL_ROT | 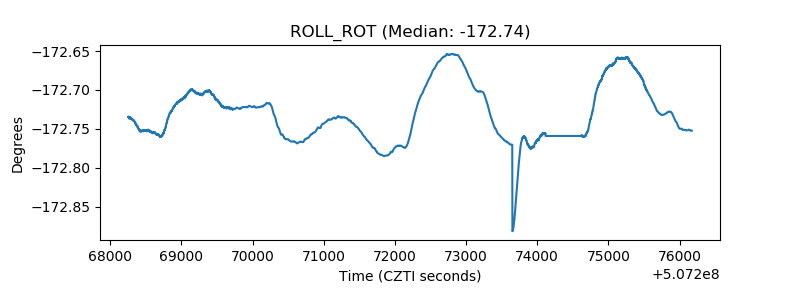 |
| _Roll_DEC | 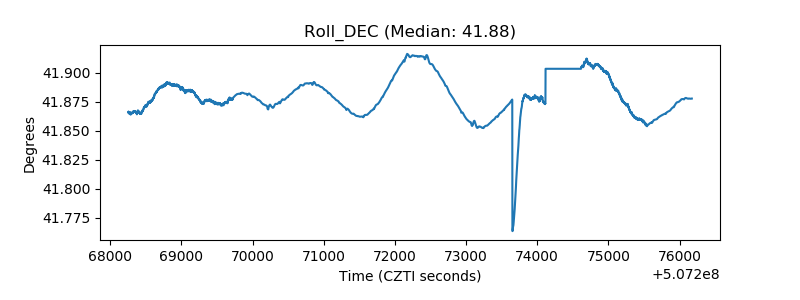 |
| _Roll_RA | 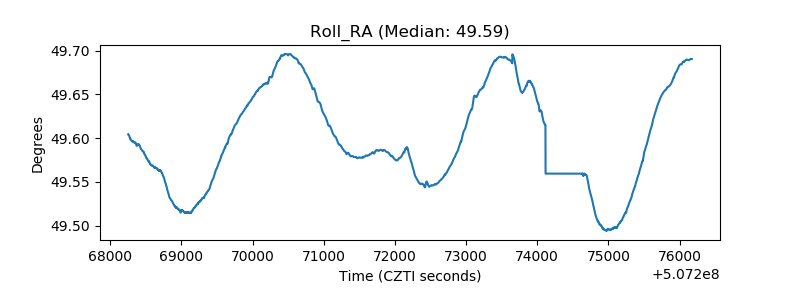 |
| Veto Counter | 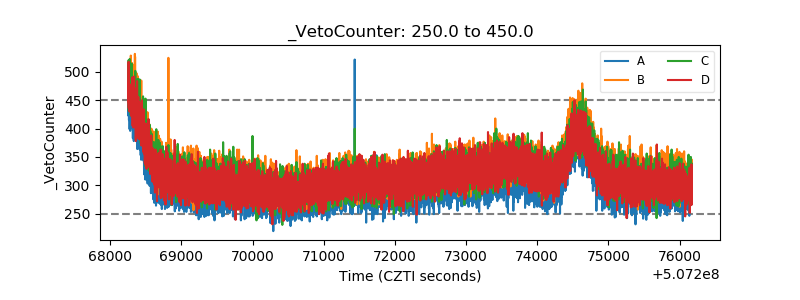 |