| Param | Original file | Final file |
|---|---|---|
| Filename | modeM0/AS1A14_030T02_9000006544_55920cztM0_level2.fits | modeM0/AS1A14_030T02_9000006544_55920cztM0_level2_quad_clean.evt |
| Size (bytes) | 1,569,286,080 | 359,268,480 |
| Size | 1.5 GB | 342.6 MB |
| Events in quadrant A | 13,082,906 | 2,313,342 |
| Events in quadrant B | 12,605,274 | 2,512,035 |
| Events in quadrant C | 13,390,917 | 2,220,362 |
| Events in quadrant D | 17,027,491 | 2,069,012 |
| Mode SS | |||
|---|---|---|---|
| Quadrant | BADHDUFLAG | Total packets | Discarded packets |
| A | 0 | 520 | 0 |
| B | 0 | 520 | 0 |
| C | 0 | 520 | 0 |
| D | 0 | 520 | 0 |
| Mode M9 | |||
|---|---|---|---|
| Quadrant | BADHDUFLAG | Total packets | Discarded packets |
| A | 0 | 10 | 0 |
| B | 0 | 10 | 0 |
| C | 0 | 10 | 0 |
| D | 0 | 10 | 0 |
| Mode M0 | |||
|---|---|---|---|
| Quadrant | BADHDUFLAG | Total packets | Discarded packets |
| A | 0 | 57699 | 4 |
| B | 0 | 55515 | 3 |
| C | 0 | 59451 | 3 |
| D | 0 | 68811 | 3 |
| Quadrant | Total seconds | Saturated seconds | Saturation percentage |
|---|---|---|---|
| A | 25612 | 686 | 2.678432% |
| B | 25613 | 485 | 1.893570% |
| C | 25613 | 714 | 2.787647% |
| D | 25613 | 1214 | 4.739781% |
Noise dominated data is calculated using 1-second bins in cleaned event files. If a bin has >2000 counts, and if more than 50% of those come from <1% of pixels, then it is considered to be noise-dominated and hence unusable.
| Quadrant | # 1 sec bins | Bins with >0 counts | Bins with >2000 counts | High rate bins dominated by noise | Noise dominated (total time) | Noise dominated (detector-on time) | Marked lightcurve |
|---|---|---|---|---|---|---|---|
| A | 26767 | 25613 | 299 | 299 | 1.12% | 1.17% | 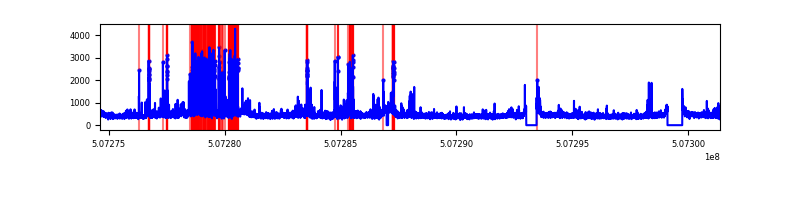 |
| B | 26768 | 25614 | 15 | 15 | 0.06% | 0.06% | 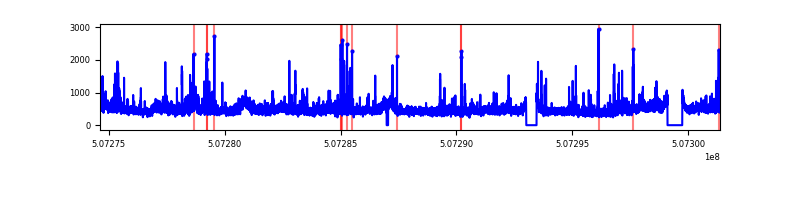 |
| C | 26768 | 25614 | 476 | 476 | 1.78% | 1.86% | 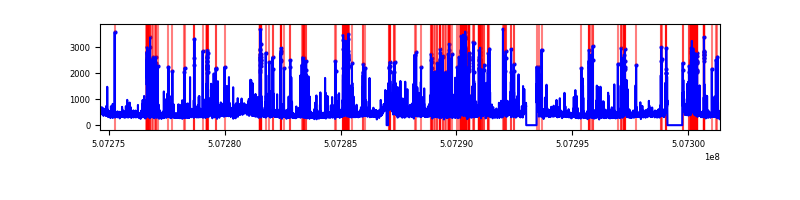 |
| D | 26768 | 25614 | 1022 | 1022 | 3.82% | 3.99% | 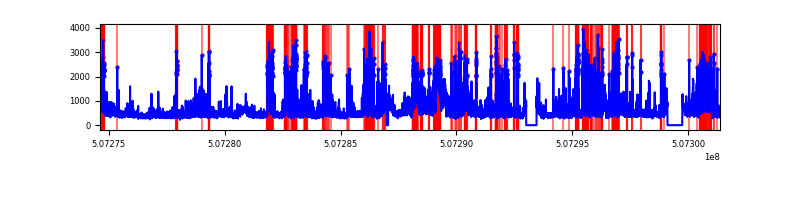 |
Top three noisy pixels from each quadrant. If the there are fewer than three noisy pixels in the level2.evt file, extra rows are filled as -1
| Pixel properties | Quadrant properties | ||||||
|---|---|---|---|---|---|---|---|
| Quadrant | DetID | PixID | Counts | Sigma | Mean | Median | Sigma |
| A | 4 | 249 | 1471708 | 2227.03 | 2688 | 2612 | 659.7 |
| A | 7 | 64 | 573494 | 865.41 | 2688 | 2612 | 659.7 |
| A | 0 | 8 | 132007 | 196.15 | 2688 | 2612 | 659.7 |
| B | 7 | 0 | 1329538 | 2339.91 | 2664 | 2558 | 567.1 |
| B | 2 | 249 | 199400 | 347.1 | 2664 | 2558 | 567.1 |
| B | 5 | 185 | 113902 | 196.34 | 2664 | 2558 | 567.1 |
| C | 15 | 199 | 1117928 | 1570.96 | 2612 | 2586 | 710.0 |
| C | 12 | 252 | 956584 | 1343.71 | 2612 | 2586 | 710.0 |
| C | 13 | 3 | 683969 | 959.73 | 2612 | 2586 | 710.0 |
| D | 11 | 129 | 5322190 | 7400.76 | 2591 | 2482 | 718.8 |
| D | 3 | 12 | 416671 | 576.22 | 2591 | 2482 | 718.8 |
| D | 2 | 31 | 329723 | 455.26 | 2591 | 2482 | 718.8 |
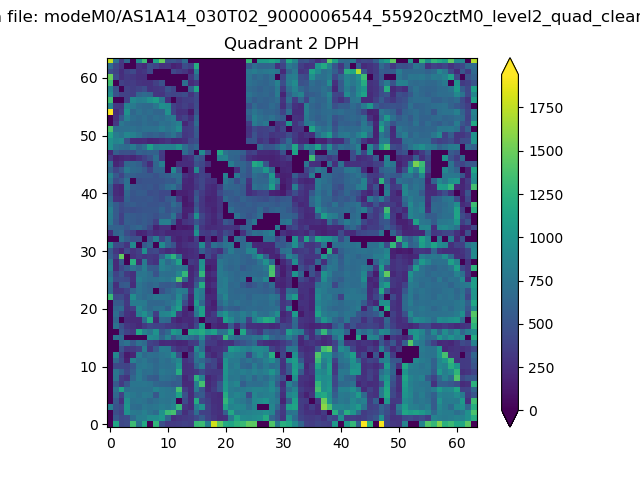
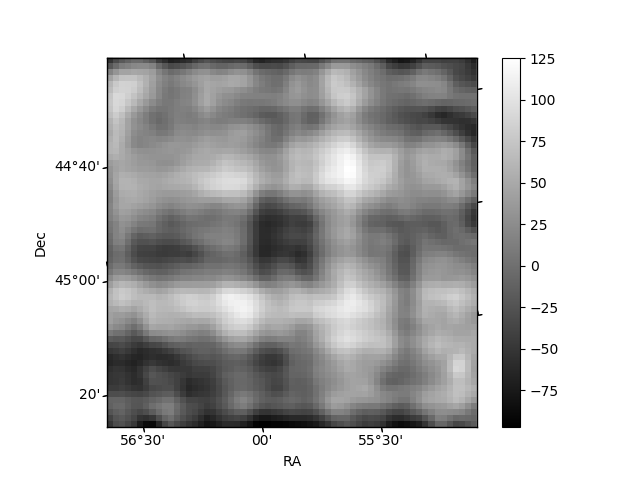
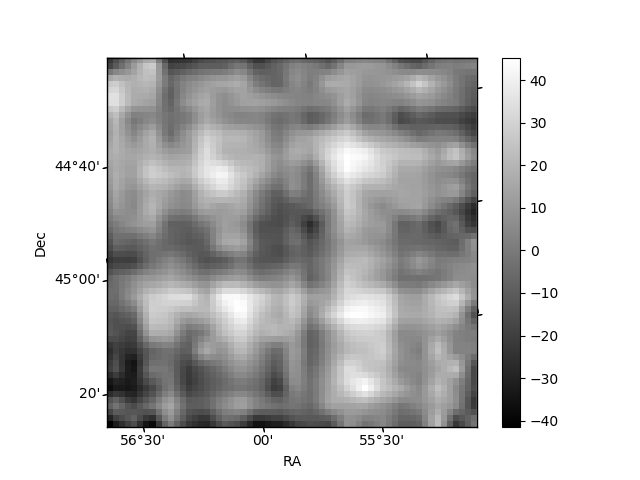
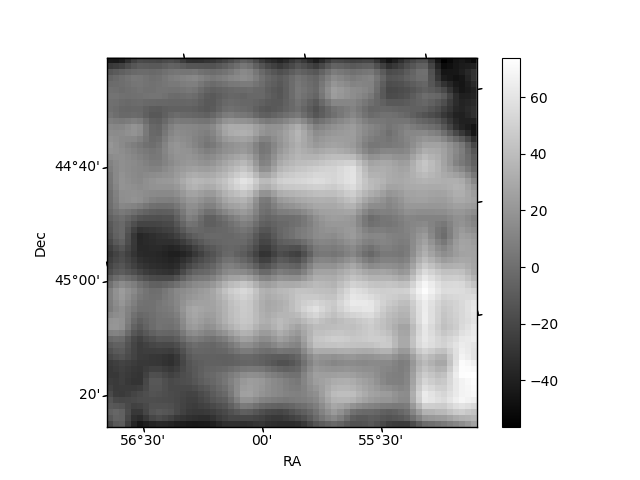
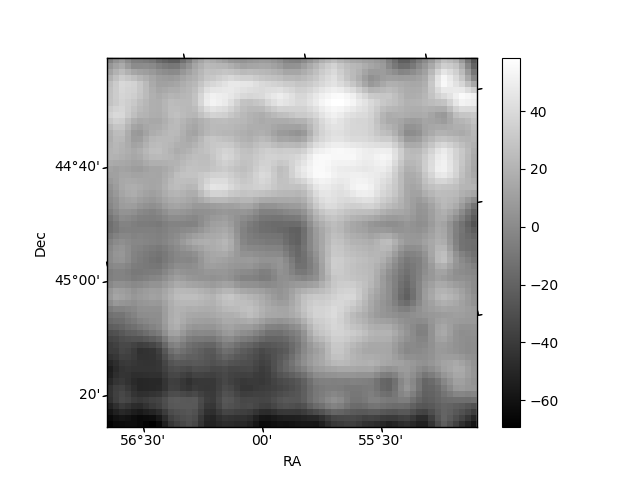
Histogram calculated using DETX and DETY for each event in the final _common_clean file
| Quadrant A | 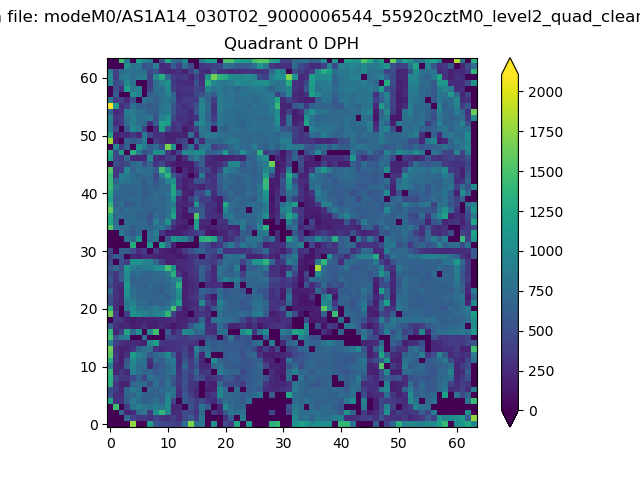 |
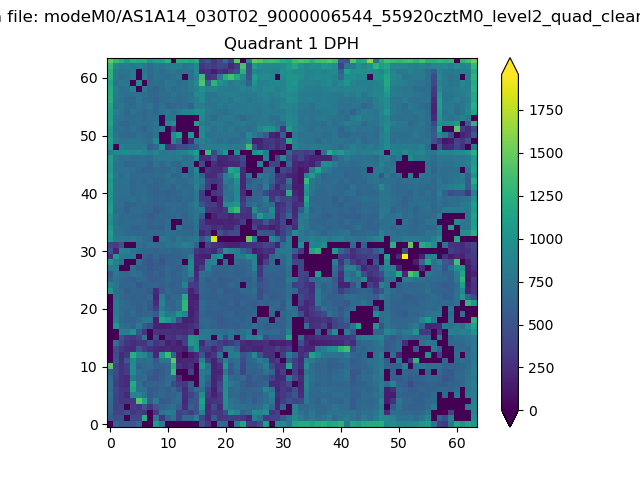 |
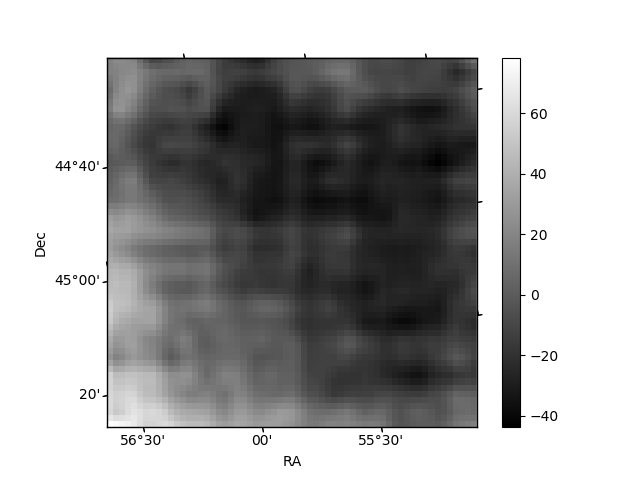
Quadrant B |
|---|---|---|---|
| Quadrant D | 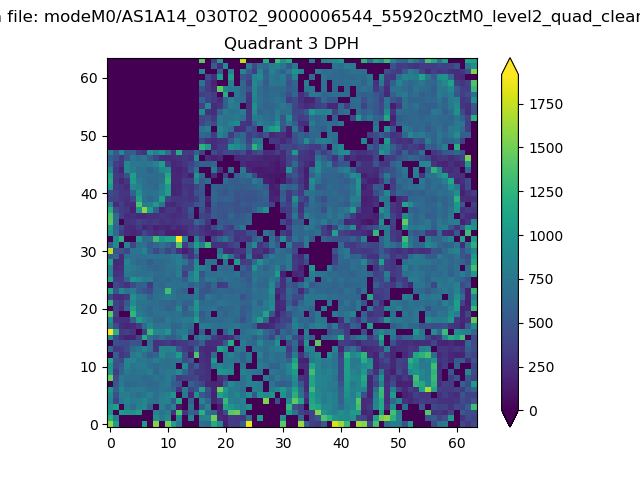 |
 |
Quadrant C |
| Plot type | Count rate plots | Images |
|---|---|---|
| Comparison with Poisson distribution Blue bars denote a histogram of data divided into 1 sec bins. Red curve is a Poisson curve with rate = median count rate of data. |
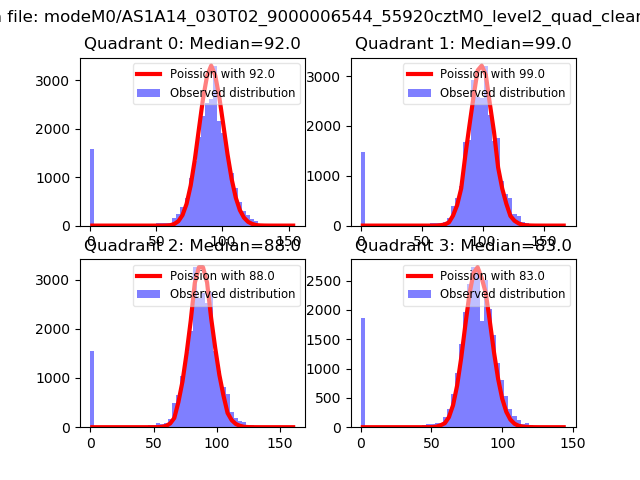 |
 |
| Quadrant-wise count rates Data is divided into 100 sec bins |
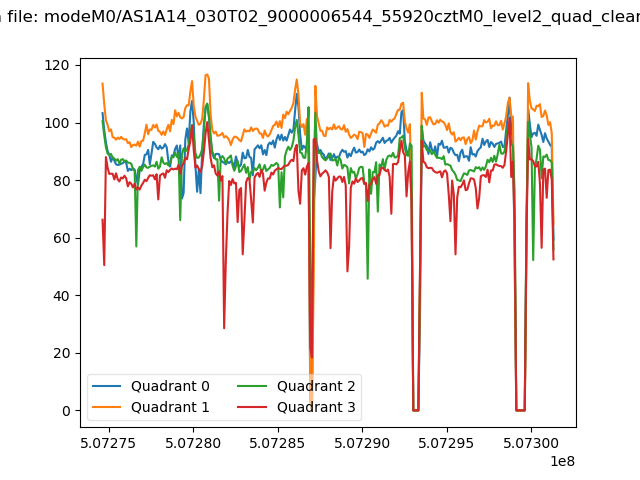 |
|
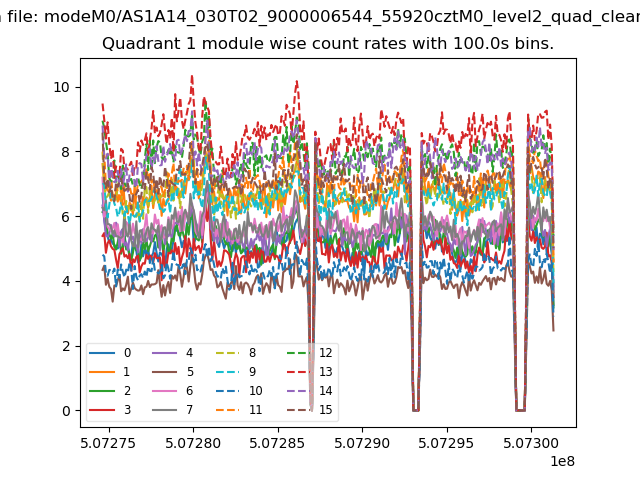
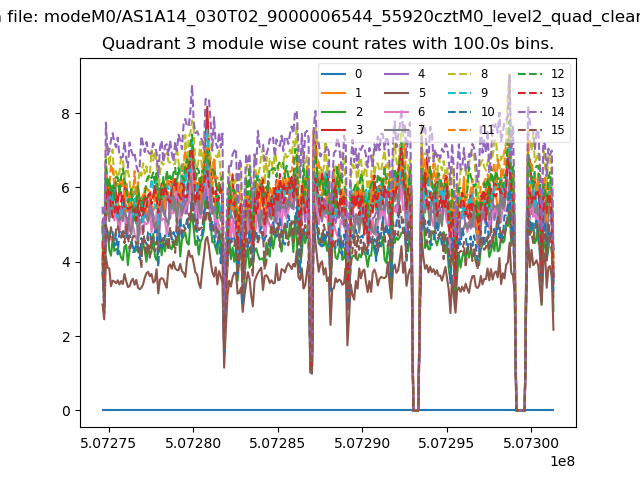
| Module-wise count rates for Quadrant A Data is divided into 100 sec bins |
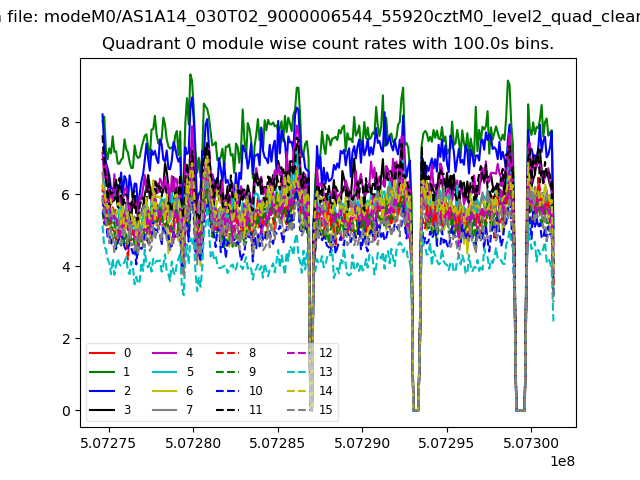 |
 |
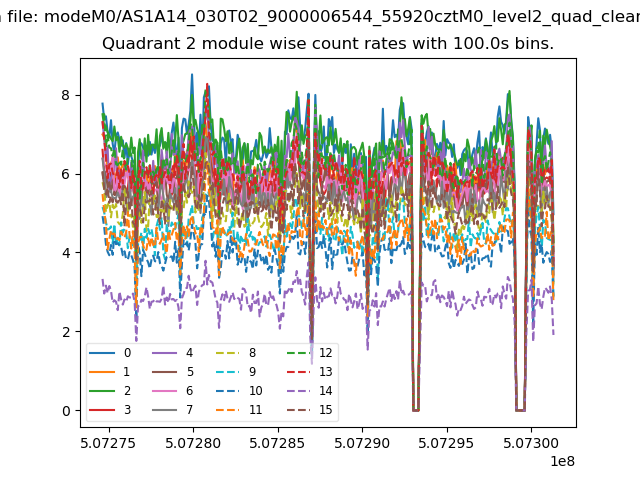
| Module-wise count rates for Quadrant B Data is divided into 100 sec bins |
 |
 |
| Module-wise count rates for Quadrant C Data is divided into 100 sec bins |
 |
 |
| Module-wise count rates for Quadrant D Data is divided into 100 sec bins |
 |
 |
| Parameter | Plot |
|---|---|
| CZT HV Monitor | 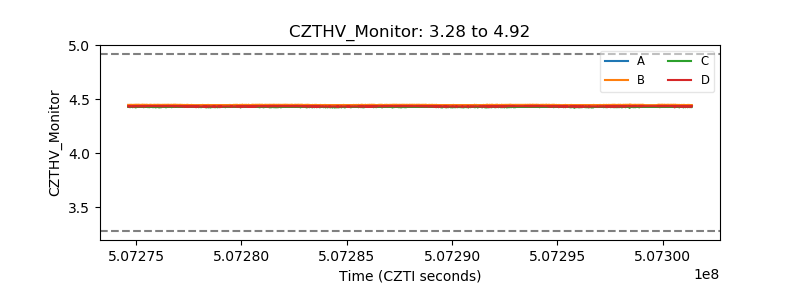 |
| D_VDD | 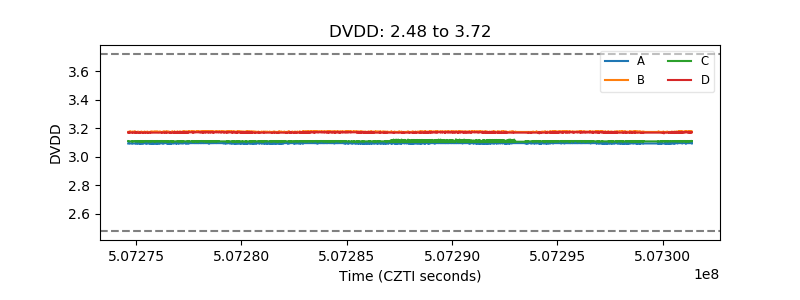 |
| Temperature 1 | 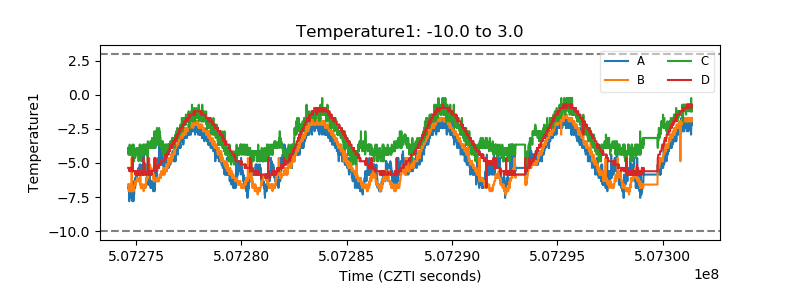 |
| Veto HV Monitor | 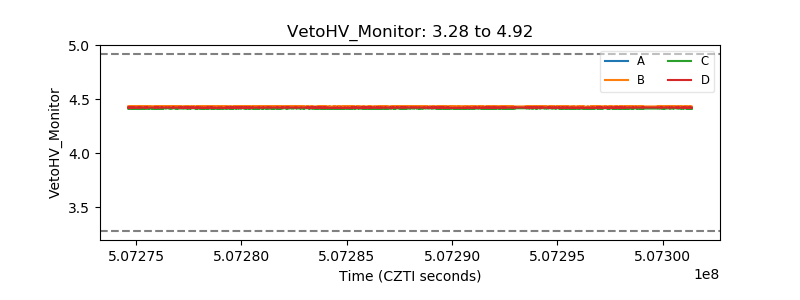 |
| Veto LLD | 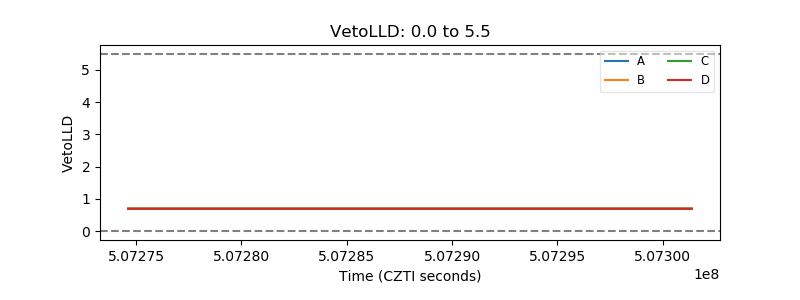 |
| Alpha Counter | 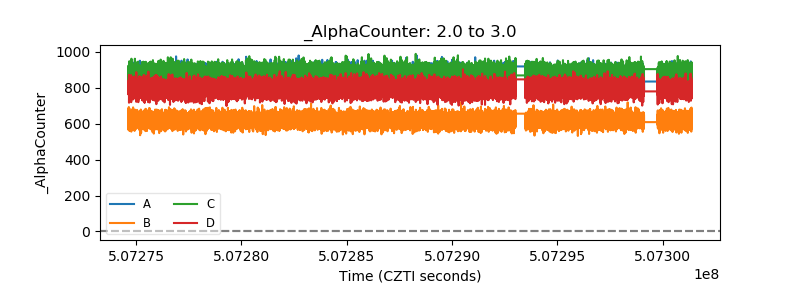 |
| _CPM_Rate | 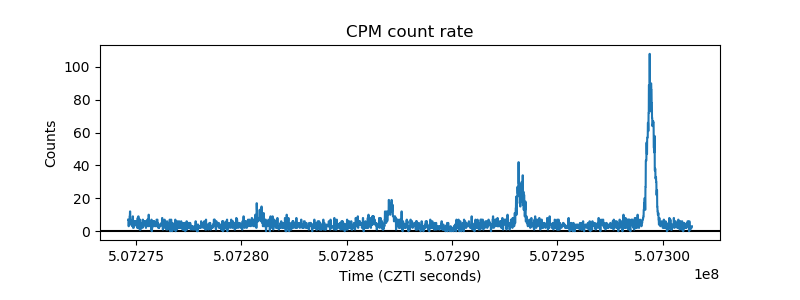 |
| CZT Counter | 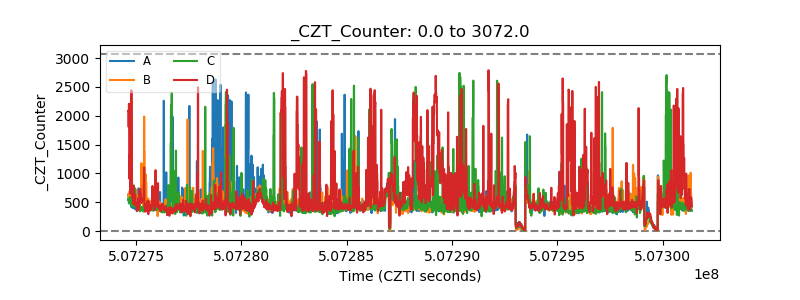 |
| +2.5 Volts monitor |  |
| +5 Volts monitor |  |
| _ROLL_ROT | 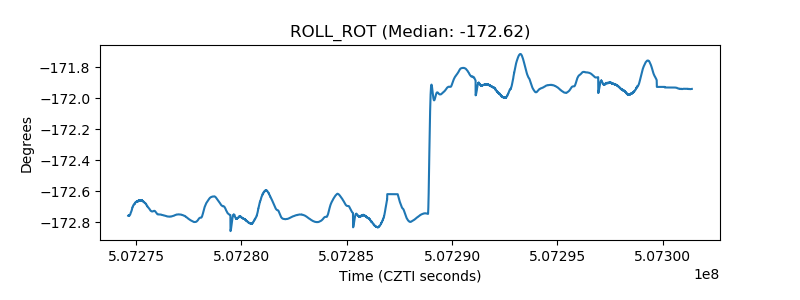 |
| _Roll_DEC | 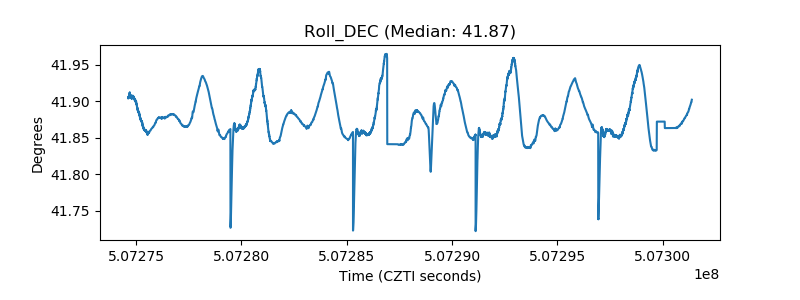 |
| _Roll_RA | 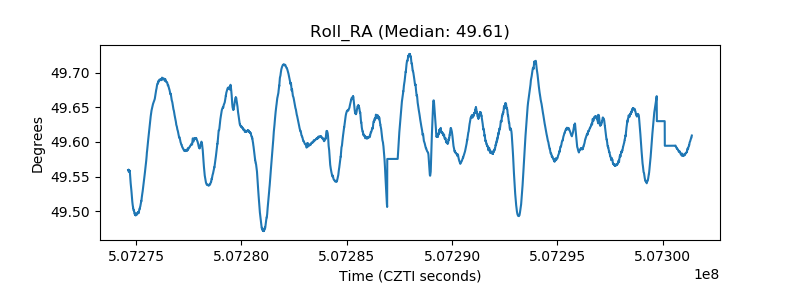 |
| Veto Counter | 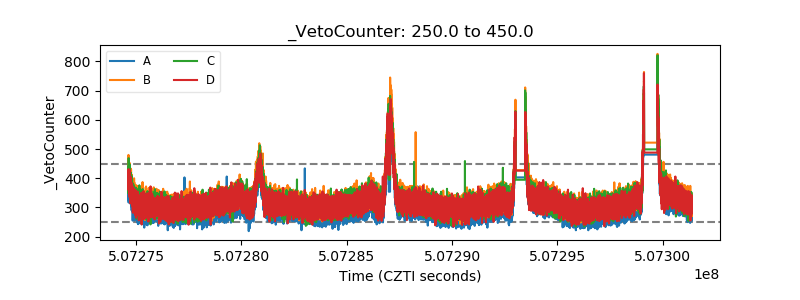 |