| Param | Original file | Final file |
|---|---|---|
| Filename | modeM0/AS1A14_030T02_9000006544_55924cztM0_level2.fits | modeM0/AS1A14_030T02_9000006544_55924cztM0_level2_quad_clean.evt |
| Size (bytes) | 433,324,800 | 96,779,520 |
| Size | 413.3 MB | 92.3 MB |
| Events in quadrant A | 3,327,254 | 641,535 |
| Events in quadrant B | 3,264,429 | 680,001 |
| Events in quadrant C | 3,567,283 | 595,157 |
| Events in quadrant D | 5,369,574 | 554,901 |
| Mode SS | |||
|---|---|---|---|
| Quadrant | BADHDUFLAG | Total packets | Discarded packets |
| A | 0 | 134 | 0 |
| B | 0 | 134 | 0 |
| C | 0 | 134 | 0 |
| D | 0 | 134 | 0 |
| Mode M9 | |||
|---|---|---|---|
| Quadrant | BADHDUFLAG | Total packets | Discarded packets |
| A | 0 | 10 | 0 |
| B | 0 | 10 | 0 |
| C | 0 | 10 | 0 |
| D | 0 | 10 | 0 |
| Mode M0 | |||
|---|---|---|---|
| Quadrant | BADHDUFLAG | Total packets | Discarded packets |
| A | 0 | 14644 | 1 |
| B | 0 | 14599 | 1 |
| C | 0 | 15725 | 1 |
| D | 0 | 20536 | 1 |
| Quadrant | Total seconds | Saturated seconds | Saturation percentage |
|---|---|---|---|
| A | 6579 | 71 | 1.079191% |
| B | 6579 | 158 | 2.401581% |
| C | 6579 | 253 | 3.845569% |
| D | 6580 | 412 | 6.261398% |
Noise dominated data is calculated using 1-second bins in cleaned event files. If a bin has >2000 counts, and if more than 50% of those come from <1% of pixels, then it is considered to be noise-dominated and hence unusable.
| Quadrant | # 1 sec bins | Bins with >0 counts | Bins with >2000 counts | High rate bins dominated by noise | Noise dominated (total time) | Noise dominated (detector-on time) | Marked lightcurve |
|---|---|---|---|---|---|---|---|
| A | 7649 | 6579 | 15 | 15 | 0.20% | 0.23% | 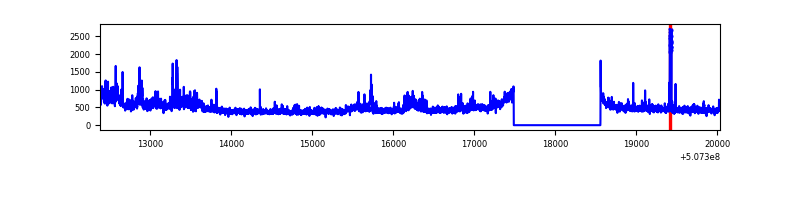 |
| B | 7649 | 6579 | 77 | 77 | 1.01% | 1.17% | 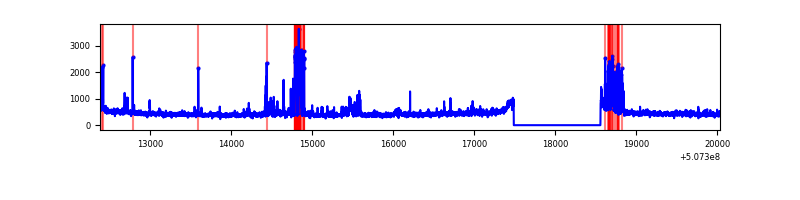 |
| C | 7648 | 6578 | 191 | 191 | 2.50% | 2.90% | 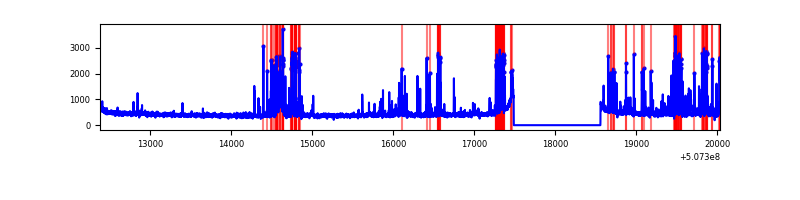 |
| D | 7650 | 6580 | 405 | 405 | 5.29% | 6.16% | 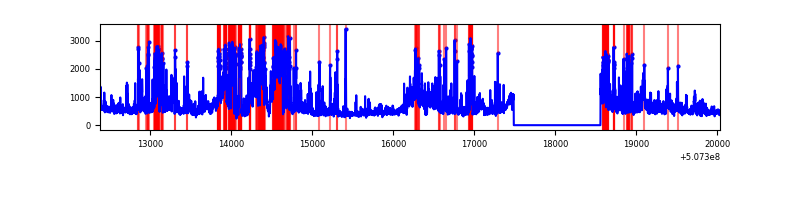 |
Top three noisy pixels from each quadrant. If the there are fewer than three noisy pixels in the level2.evt file, extra rows are filled as -1
| Pixel properties | Quadrant properties | ||||||
|---|---|---|---|---|---|---|---|
| Quadrant | DetID | PixID | Counts | Sigma | Mean | Median | Sigma |
| A | 3 | 14 | 238749 | 1366.69 | 699 | 681 | 174.2 |
| A | 12 | 115 | 159454 | 911.48 | 699 | 681 | 174.2 |
| A | 7 | 64 | 78041 | 444.11 | 699 | 681 | 174.2 |
| B | 10 | 247 | 162982 | 1103.94 | 685 | 661 | 147.0 |
| B | 5 | 185 | 123903 | 838.16 | 685 | 661 | 147.0 |
| B | 0 | 199 | 87627 | 591.45 | 685 | 661 | 147.0 |
| C | 15 | 199 | 449921 | 2439.99 | 670 | 664 | 184.1 |
| C | 13 | 3 | 374014 | 2027.73 | 670 | 664 | 184.1 |
| C | 12 | 252 | 103750 | 559.88 | 670 | 664 | 184.1 |
| D | 11 | 129 | 1982768 | 10446.39 | 671 | 641 | 189.7 |
| D | 7 | 96 | 212904 | 1118.69 | 671 | 641 | 189.7 |
| D | 12 | 16 | 178984 | 939.92 | 671 | 641 | 189.7 |
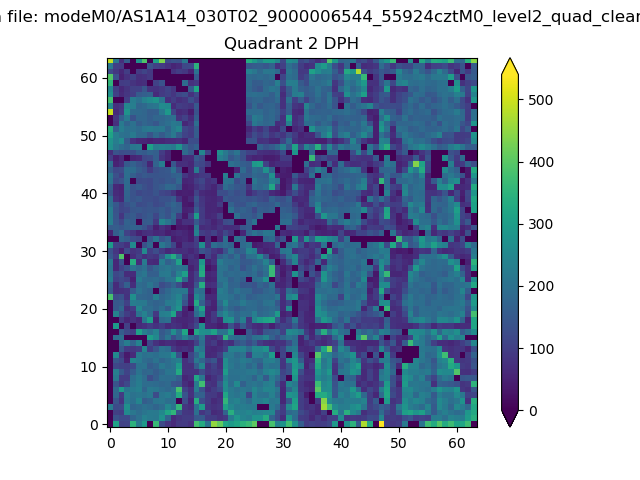
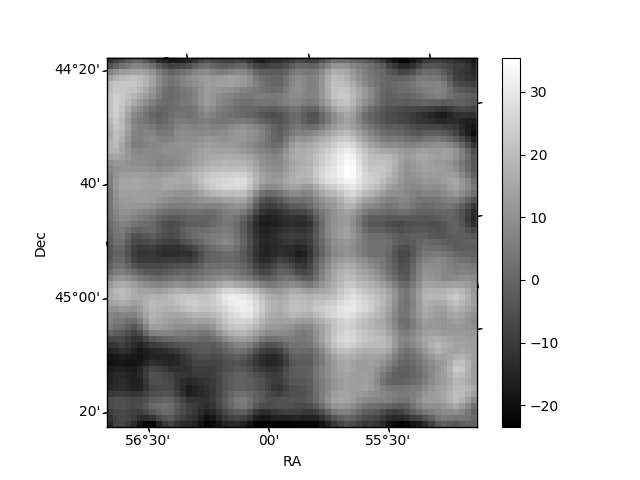
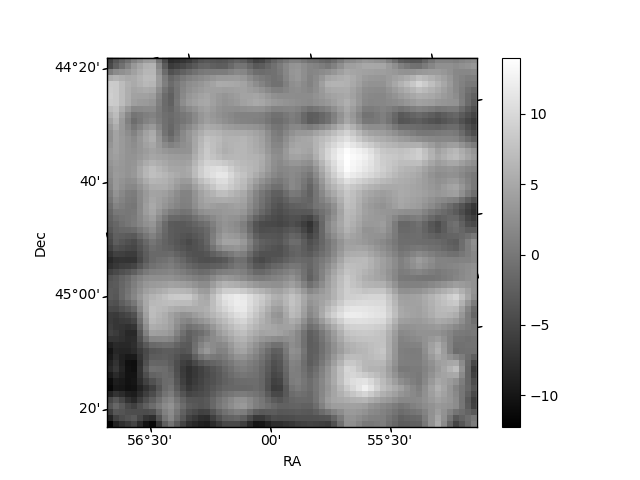
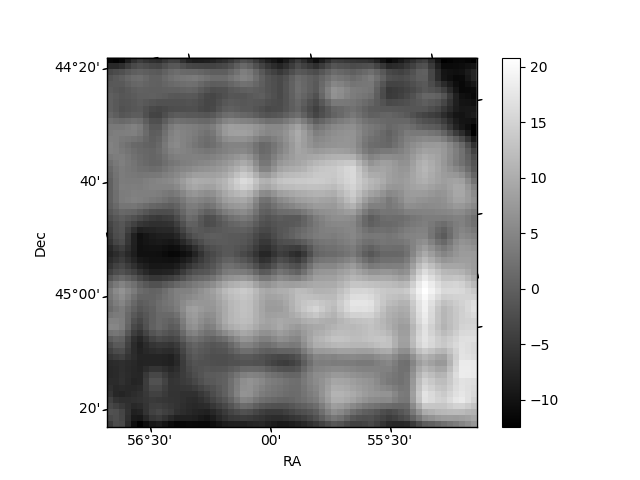
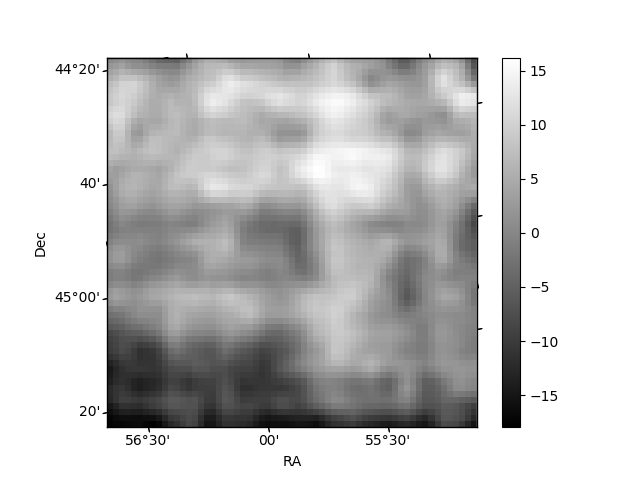
Histogram calculated using DETX and DETY for each event in the final _common_clean file
| Quadrant A | 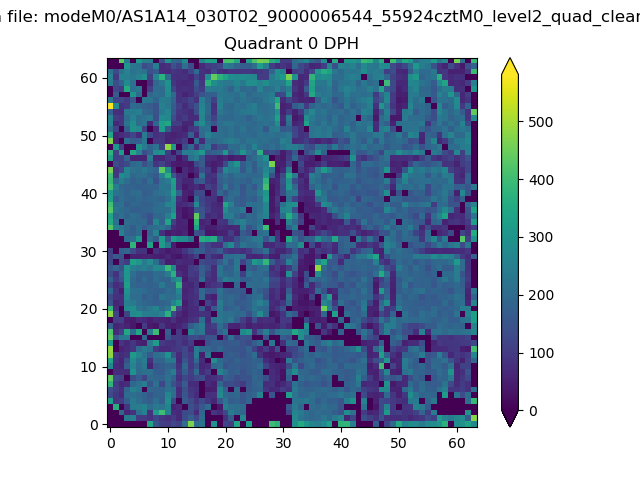 |
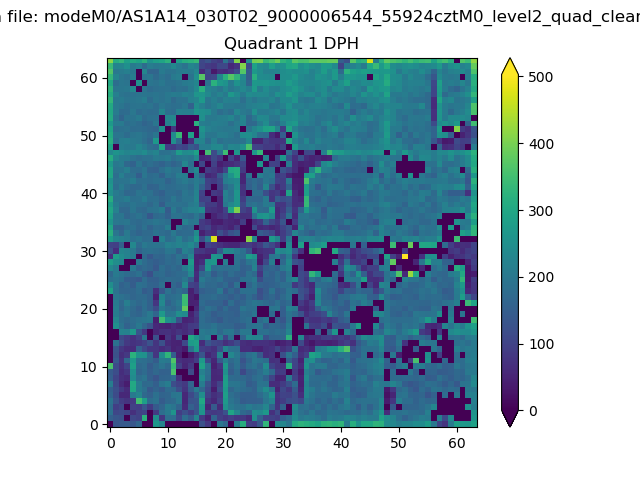 |
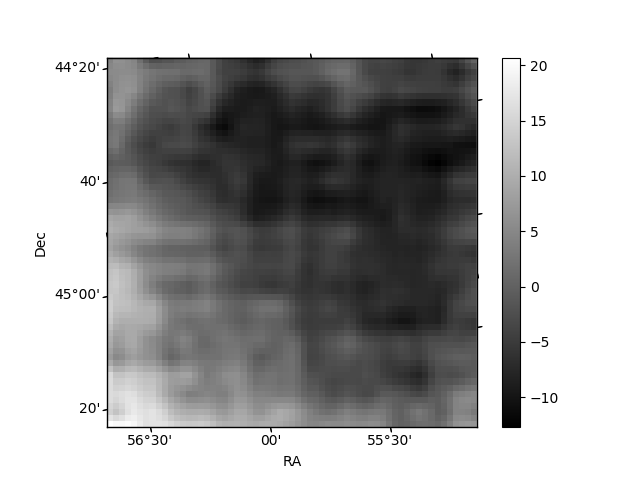
Quadrant B |
|---|---|---|---|
| Quadrant D | 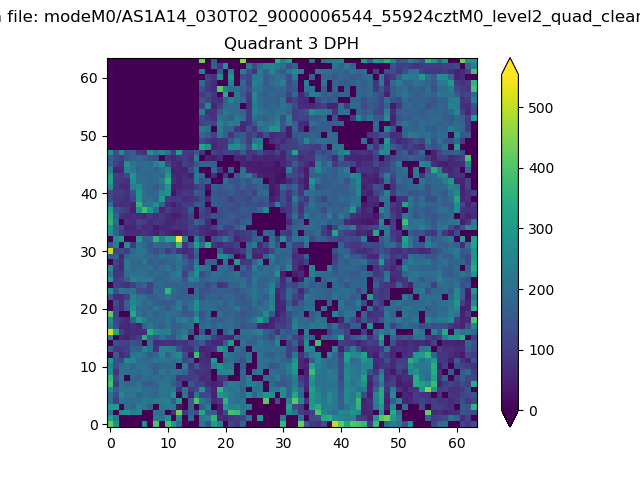 |
 |
Quadrant C |
| Plot type | Count rate plots | Images |
|---|---|---|
| Comparison with Poisson distribution Blue bars denote a histogram of data divided into 1 sec bins. Red curve is a Poisson curve with rate = median count rate of data. |
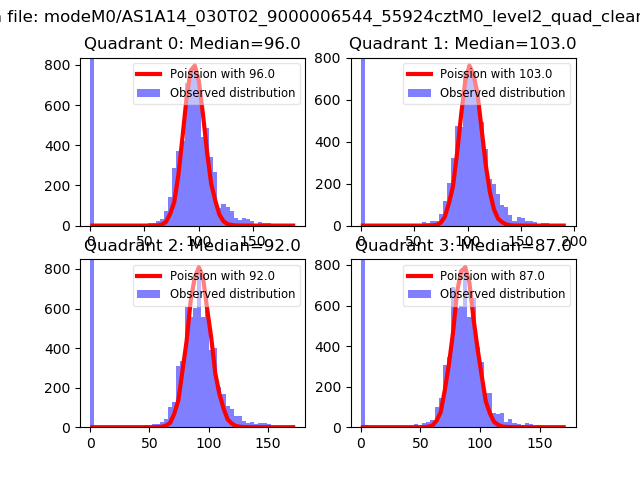 |
 |
| Quadrant-wise count rates Data is divided into 100 sec bins |
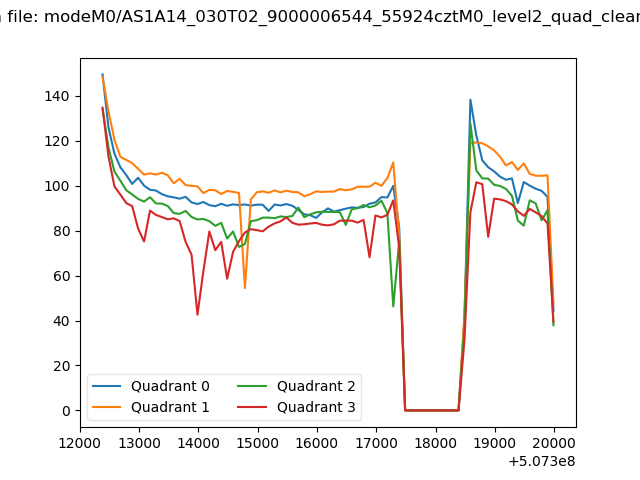 |
|
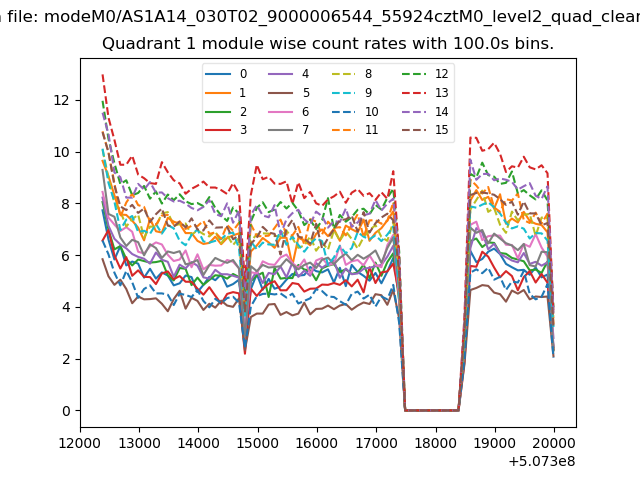
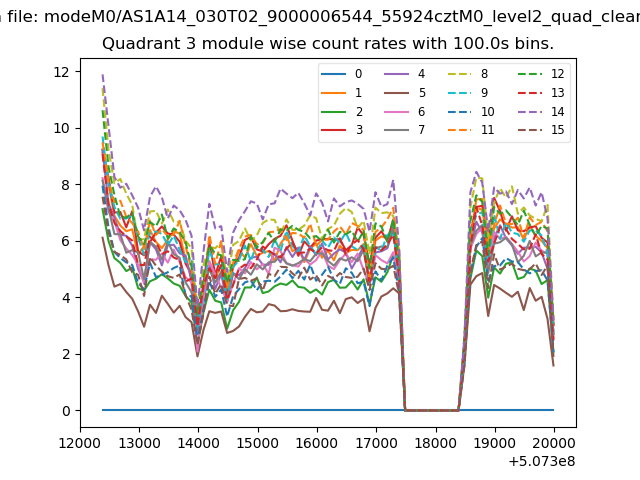
| Module-wise count rates for Quadrant A Data is divided into 100 sec bins |
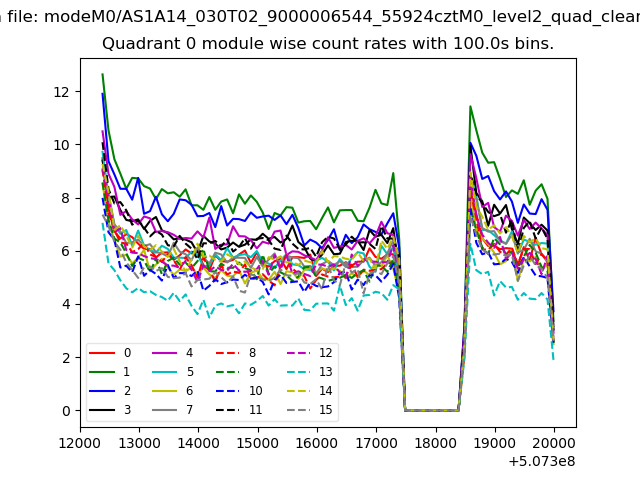 |
 |
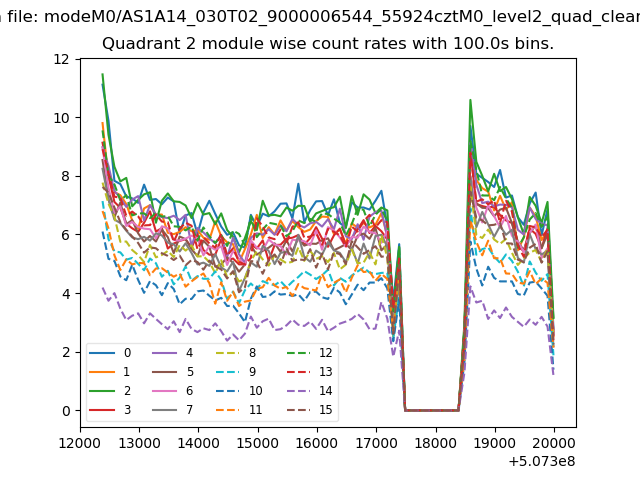
| Module-wise count rates for Quadrant B Data is divided into 100 sec bins |
 |
 |
| Module-wise count rates for Quadrant C Data is divided into 100 sec bins |
 |
 |
| Module-wise count rates for Quadrant D Data is divided into 100 sec bins |
 |
 |
| Parameter | Plot |
|---|---|
| CZT HV Monitor | 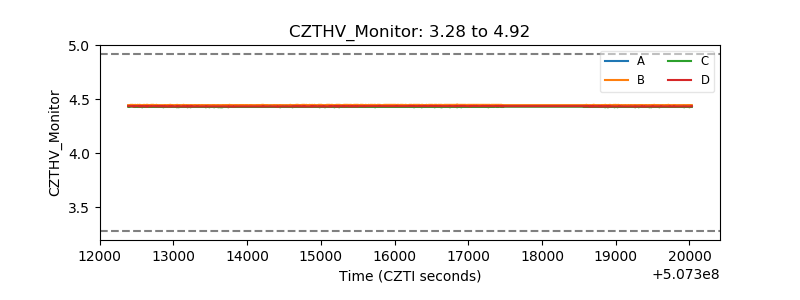 |
| D_VDD | 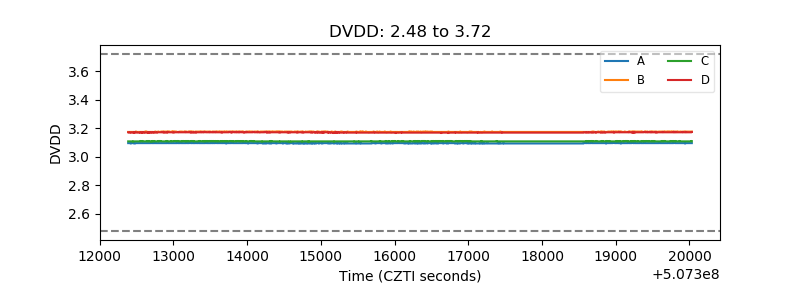 |
| Temperature 1 | 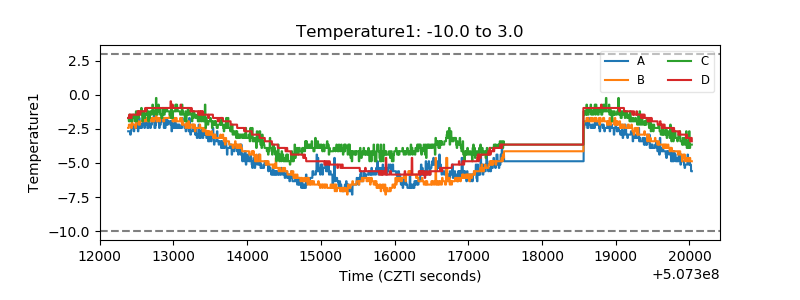 |
| Veto HV Monitor | 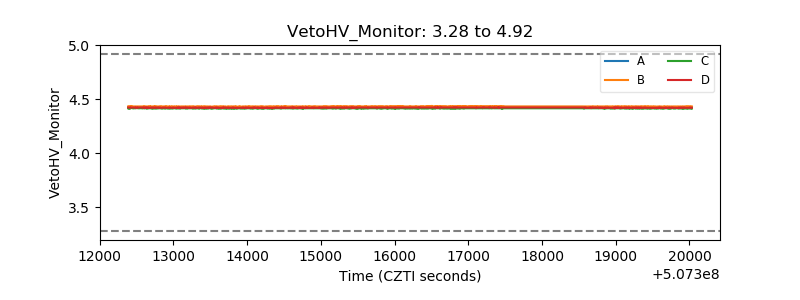 |
| Veto LLD | 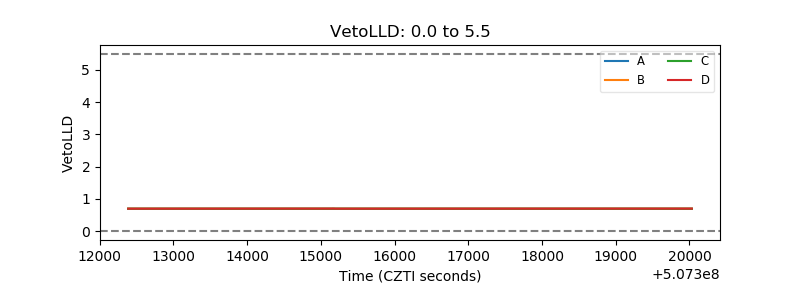 |
| Alpha Counter | 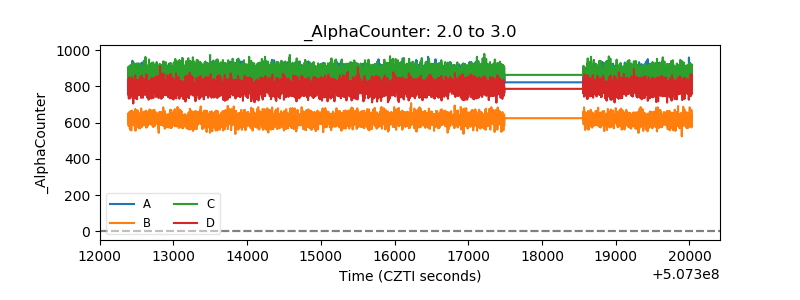 |
| _CPM_Rate | 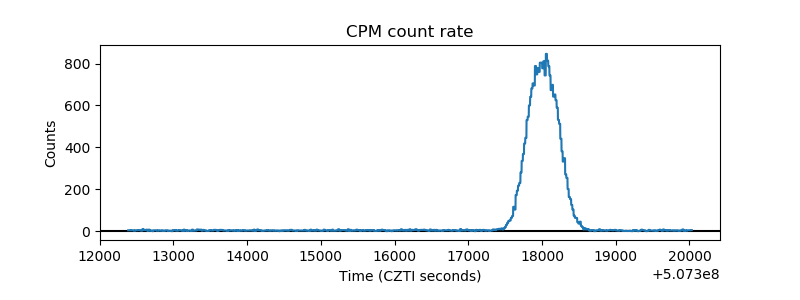 |
| CZT Counter | 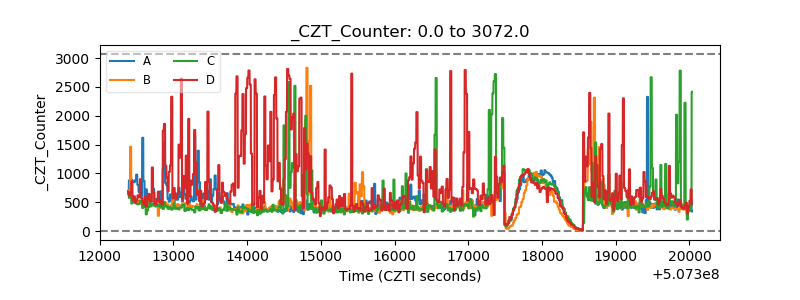 |
| +2.5 Volts monitor | 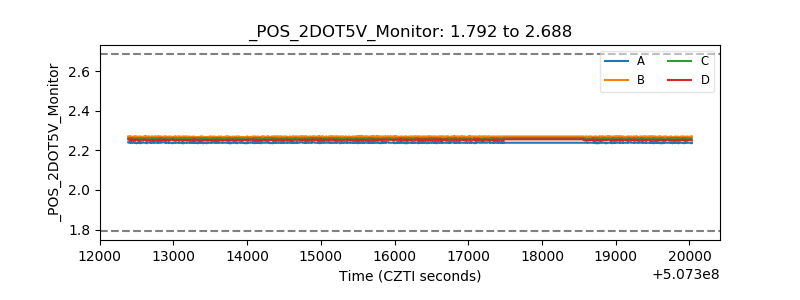 |
| +5 Volts monitor |  |
| _ROLL_ROT | 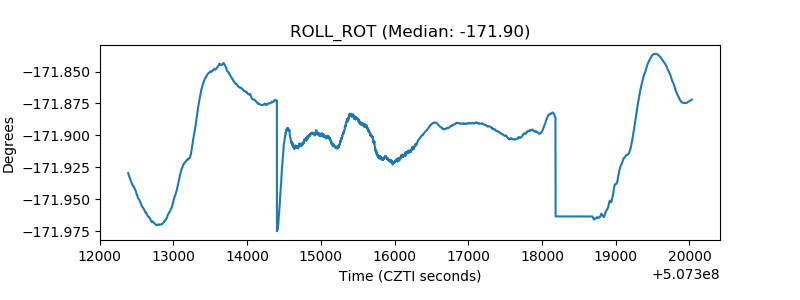 |
| _Roll_DEC | 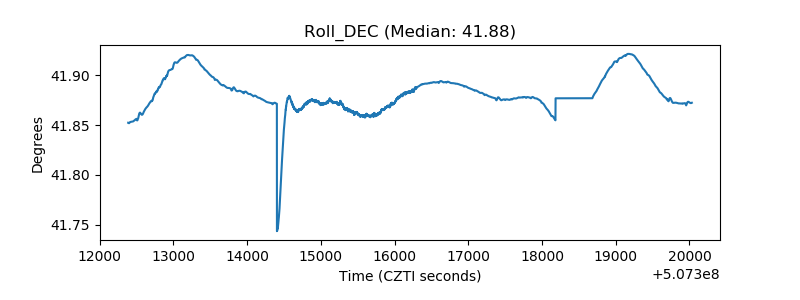 |
| _Roll_RA | 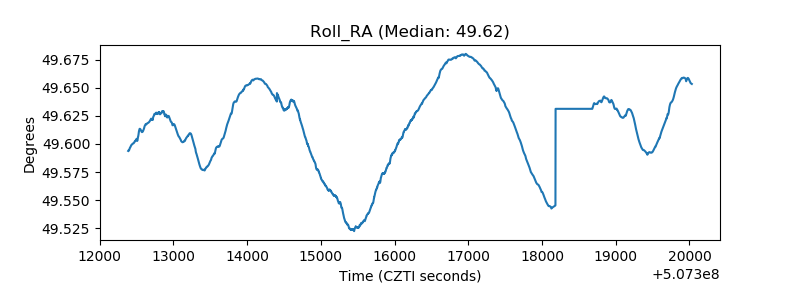 |
| Veto Counter | 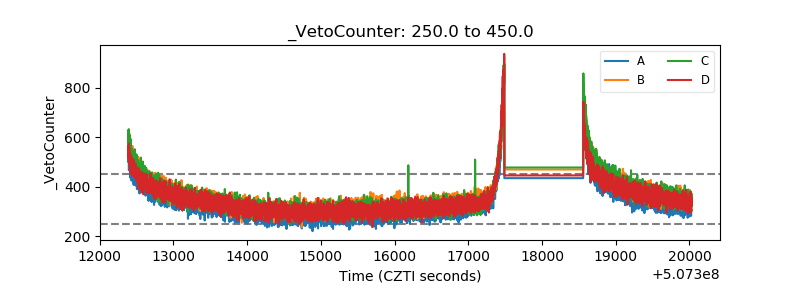 |