| Param | Original file | Final file |
|---|---|---|
| Filename | modeM0/AS1A14_030T02_9000006544_55927cztM0_level2.fits | modeM0/AS1A14_030T02_9000006544_55927cztM0_level2_quad_clean.evt |
| Size (bytes) | 529,361,280 | 89,907,840 |
| Size | 504.8 MB | 85.7 MB |
| Events in quadrant A | 5,960,134 | 554,330 |
| Events in quadrant B | 2,826,080 | 664,977 |
| Events in quadrant C | 4,177,160 | 578,019 |
| Events in quadrant D | 6,129,027 | 473,018 |
| Mode SS | |||
|---|---|---|---|
| Quadrant | BADHDUFLAG | Total packets | Discarded packets |
| A | 0 | 132 | 0 |
| B | 0 | 132 | 0 |
| C | 0 | 132 | 0 |
| D | 0 | 132 | 0 |
| Mode M9 | |||
|---|---|---|---|
| Quadrant | BADHDUFLAG | Total packets | Discarded packets |
| A | 0 | 17 | 0 |
| B | 0 | 18 | 0 |
| C | 0 | 18 | 0 |
| D | 0 | 18 | 0 |
| Mode M0 | |||
|---|---|---|---|
| Quadrant | BADHDUFLAG | Total packets | Discarded packets |
| A | 0 | 22225 | 2 |
| B | 0 | 13440 | 2 |
| C | 0 | 17240 | 9 |
| D | 0 | 22753 | 2 |
| Quadrant | Total seconds | Saturated seconds | Saturation percentage |
|---|---|---|---|
| A | 6480 | 657 | 10.138889% |
| B | 6480 | 36 | 0.555556% |
| C | 6479 | 230 | 3.549931% |
| D | 6479 | 1017 | 15.696867% |
Noise dominated data is calculated using 1-second bins in cleaned event files. If a bin has >2000 counts, and if more than 50% of those come from <1% of pixels, then it is considered to be noise-dominated and hence unusable.
| Quadrant | # 1 sec bins | Bins with >0 counts | Bins with >2000 counts | High rate bins dominated by noise | Noise dominated (total time) | Noise dominated (detector-on time) | Marked lightcurve |
|---|---|---|---|---|---|---|---|
| A | 7605 | 6481 | 736 | 736 | 9.68% | 11.36% | 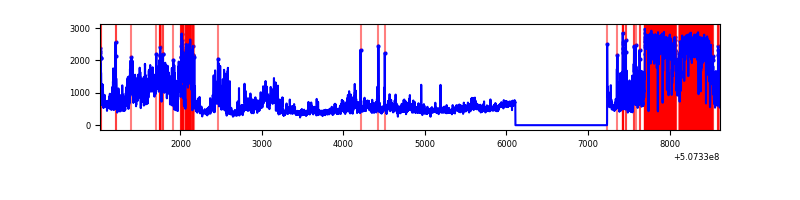 |
| B | 7605 | 6481 | 17 | 17 | 0.22% | 0.26% | 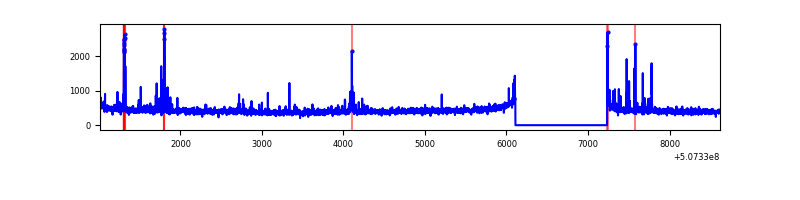 |
| C | 7603 | 6479 | 218 | 218 | 2.87% | 3.36% | 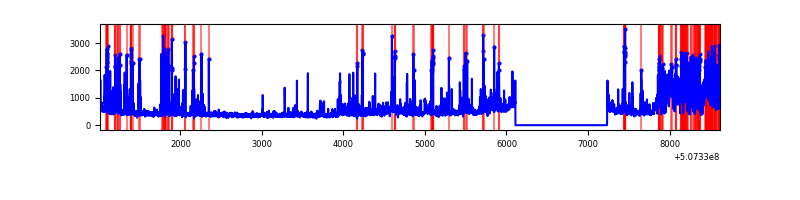 |
| D | 7604 | 6480 | 1032 | 1032 | 13.57% | 15.93% | 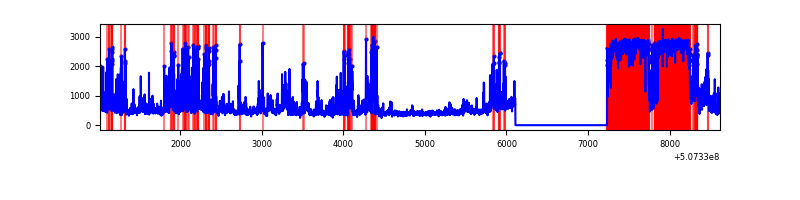 |
Top three noisy pixels from each quadrant. If the there are fewer than three noisy pixels in the level2.evt file, extra rows are filled as -1
| Pixel properties | Quadrant properties | ||||||
|---|---|---|---|---|---|---|---|
| Quadrant | DetID | PixID | Counts | Sigma | Mean | Median | Sigma |
| A | 12 | 115 | 2247312 | 13967.55 | 649 | 632 | 160.9 |
| A | 4 | 207 | 939464 | 5836.69 | 649 | 632 | 160.9 |
| A | 7 | 64 | 114379 | 707.16 | 649 | 632 | 160.9 |
| B | 0 | 213 | 40044 | 279.39 | 666 | 642 | 141.0 |
| B | 0 | 171 | 39103 | 272.72 | 666 | 642 | 141.0 |
| B | 7 | 252 | 35407 | 246.51 | 666 | 642 | 141.0 |
| C | 13 | 3 | 967597 | 5359.83 | 650 | 644 | 180.4 |
| C | 12 | 252 | 539097 | 2984.65 | 650 | 644 | 180.4 |
| C | 15 | 199 | 90824 | 499.87 | 650 | 644 | 180.4 |
| D | 11 | 129 | 3080059 | 18365.92 | 591 | 565 | 167.7 |
| D | 6 | 31 | 307613 | 1831.22 | 591 | 565 | 167.7 |
| D | 7 | 129 | 124504 | 739.16 | 591 | 565 | 167.7 |
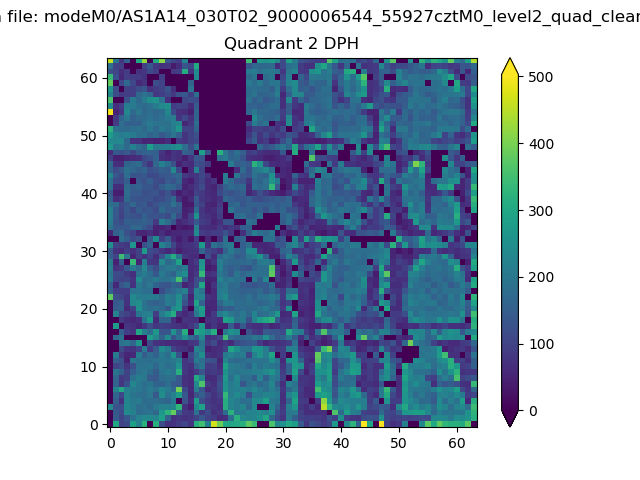
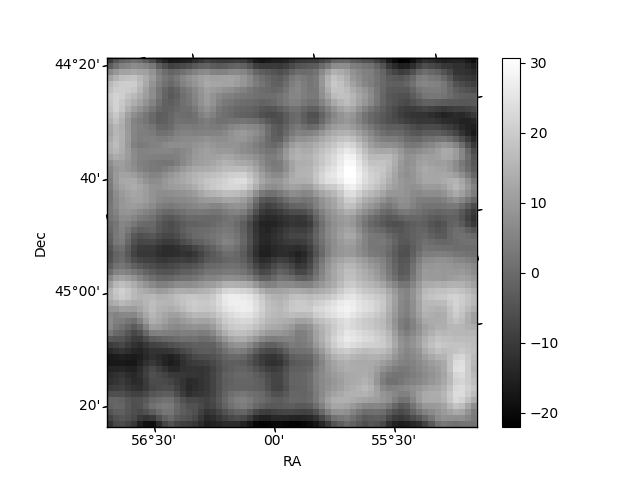
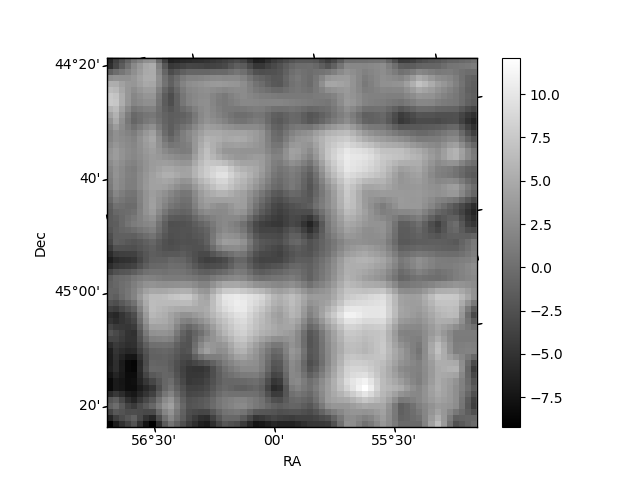
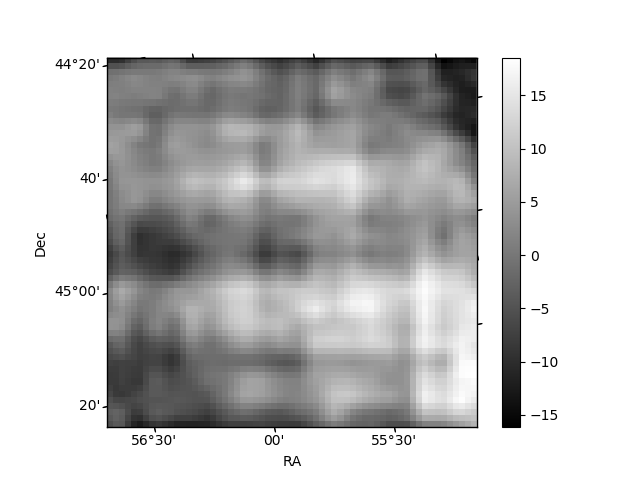
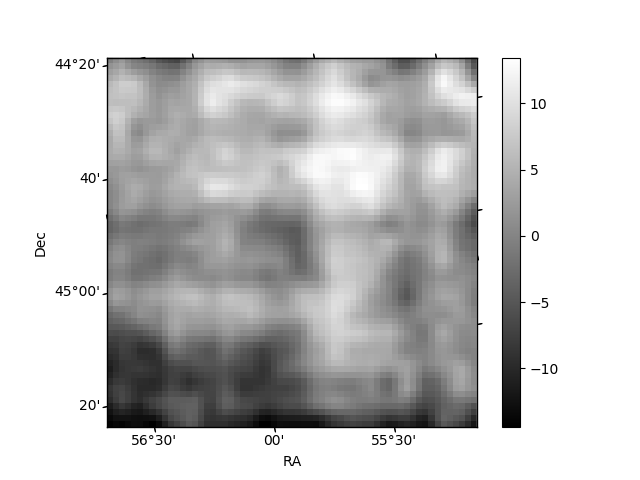
Histogram calculated using DETX and DETY for each event in the final _common_clean file
| Quadrant A | 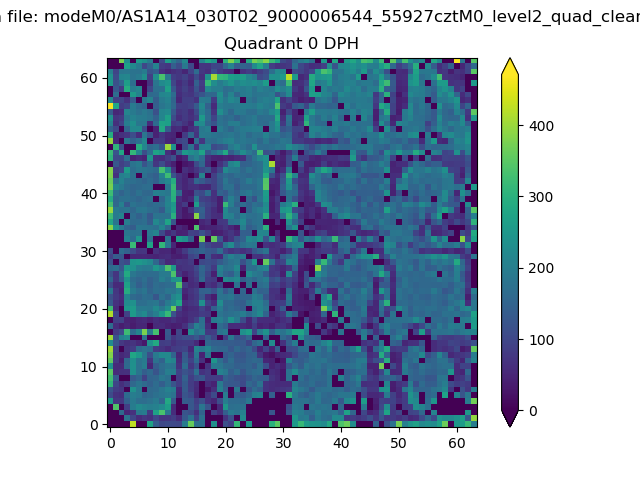 |
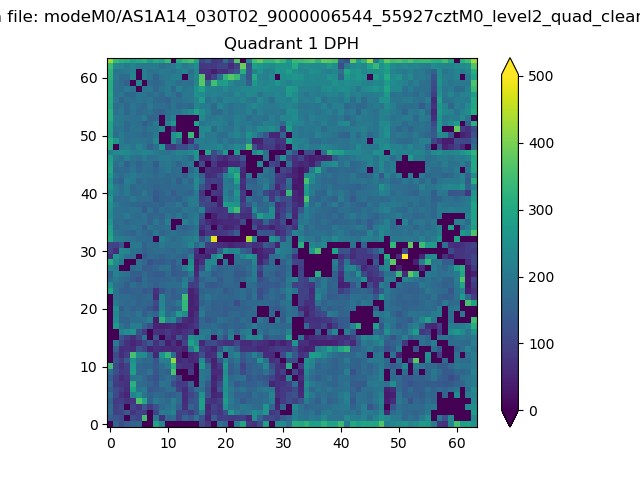 |
Quadrant B |
|---|---|---|---|
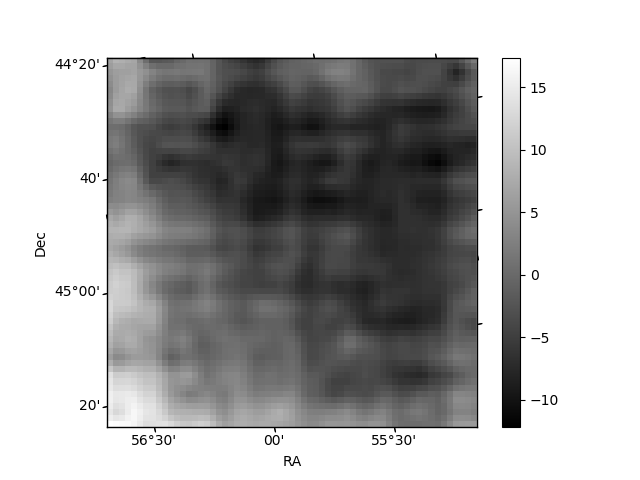
| Quadrant D | 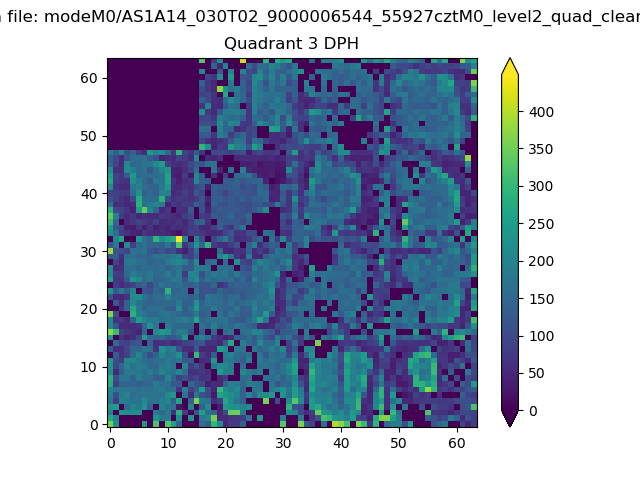 |
 |
Quadrant C |
| Plot type | Count rate plots | Images |
|---|---|---|
| Comparison with Poisson distribution Blue bars denote a histogram of data divided into 1 sec bins. Red curve is a Poisson curve with rate = median count rate of data. |
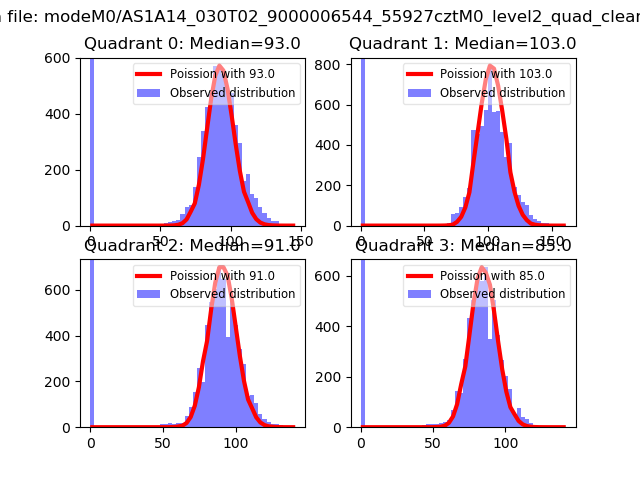 |
 |
| Quadrant-wise count rates Data is divided into 100 sec bins |
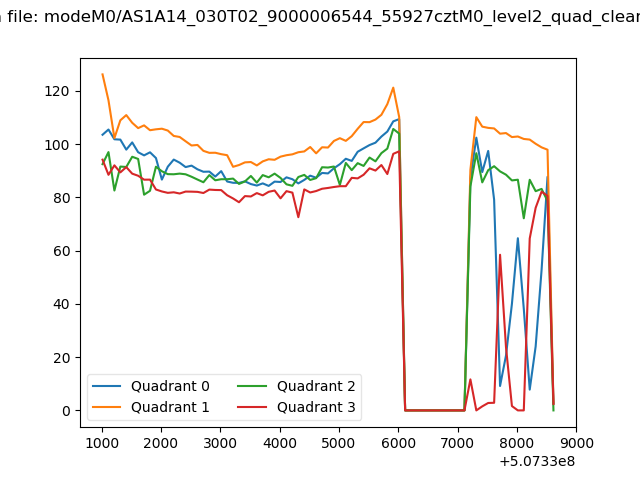 |
|
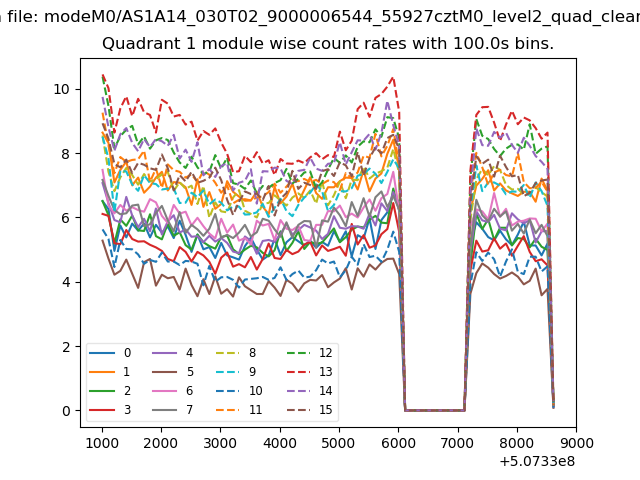
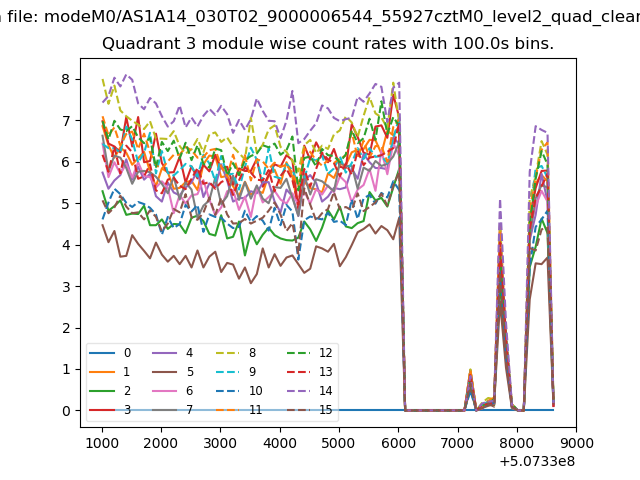
| Module-wise count rates for Quadrant A Data is divided into 100 sec bins |
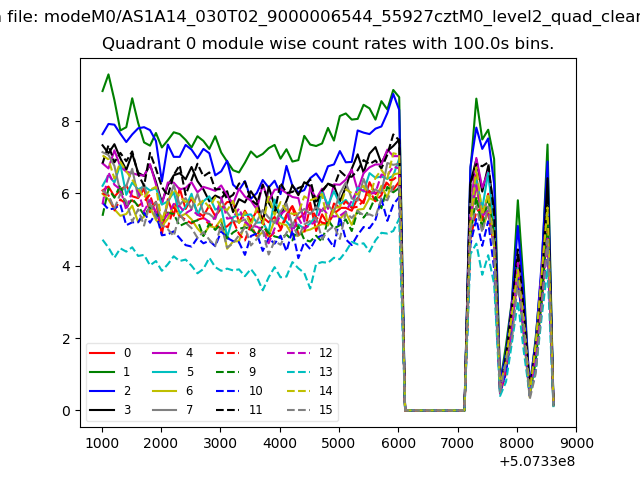 |
 |
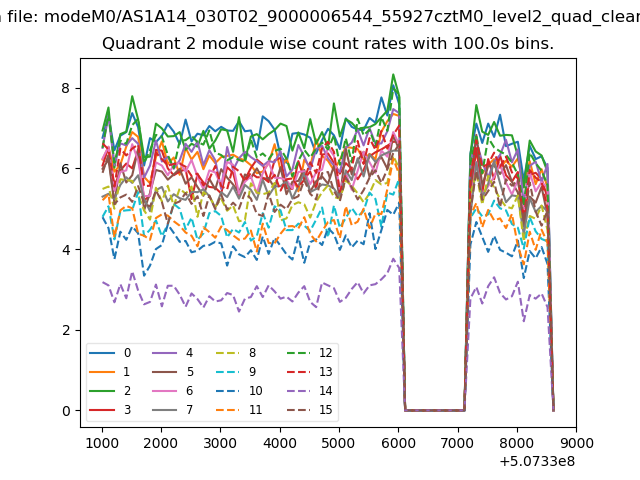
| Module-wise count rates for Quadrant B Data is divided into 100 sec bins |
 |
 |
| Module-wise count rates for Quadrant C Data is divided into 100 sec bins |
 |
 |
| Module-wise count rates for Quadrant D Data is divided into 100 sec bins |
 |
 |
| Parameter | Plot |
|---|---|
| CZT HV Monitor | 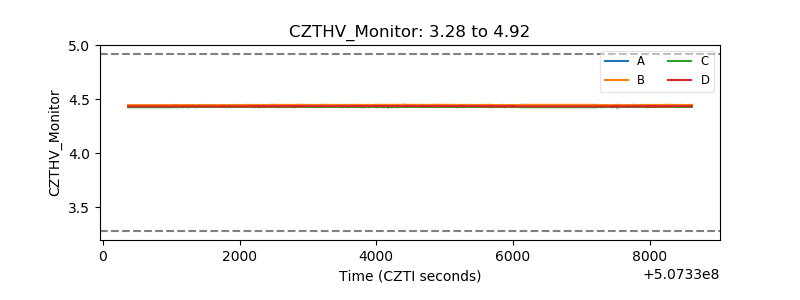 |
| D_VDD | 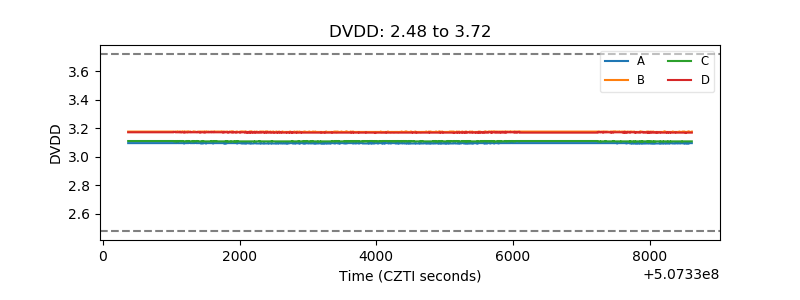 |
| Temperature 1 | 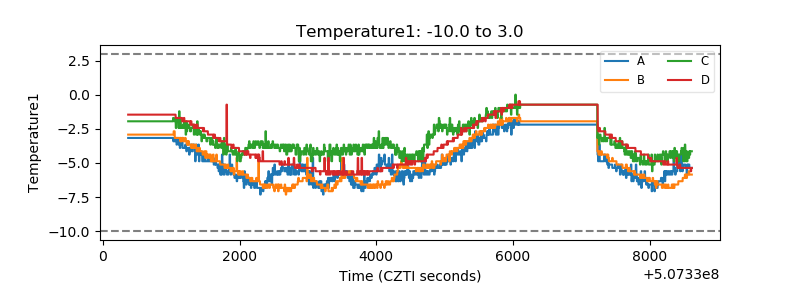 |
| Veto HV Monitor | 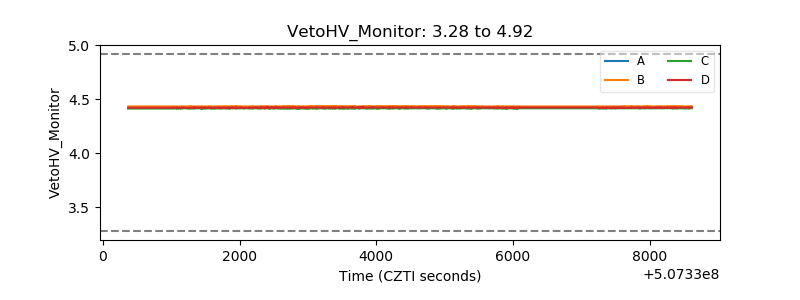 |
| Veto LLD | 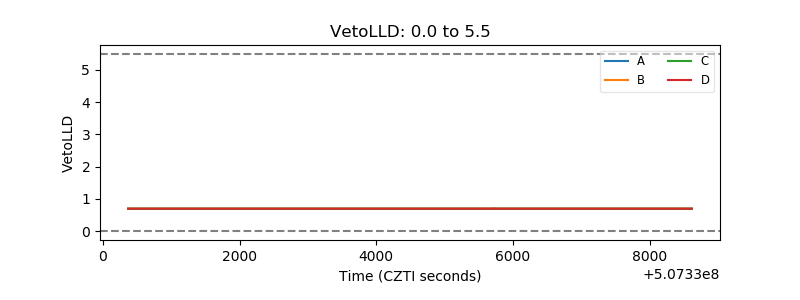 |
| Alpha Counter | 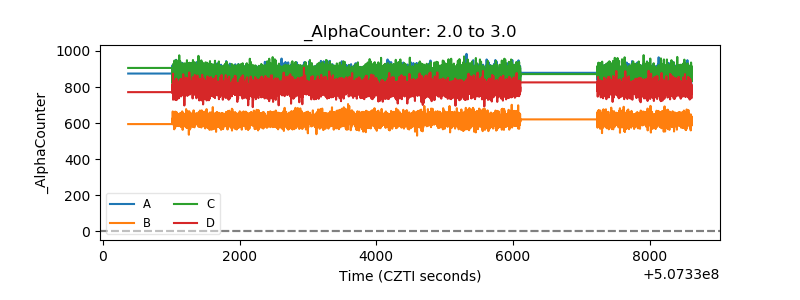 |
| _CPM_Rate | 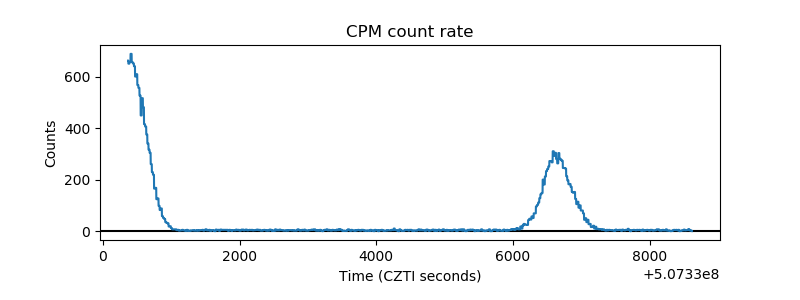 |
| CZT Counter | 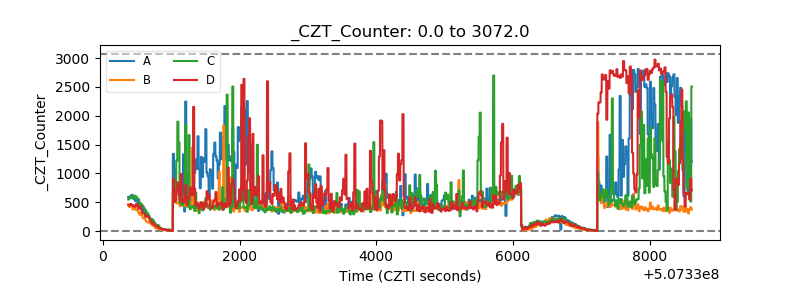 |
| +2.5 Volts monitor | 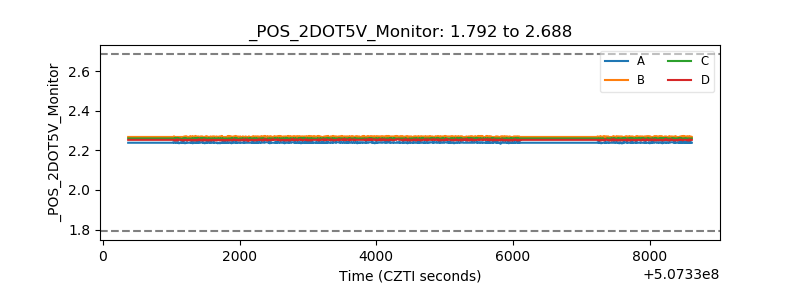 |
| +5 Volts monitor | 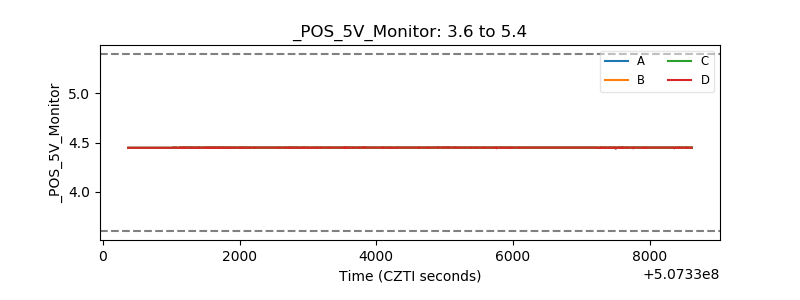 |
| _ROLL_ROT | 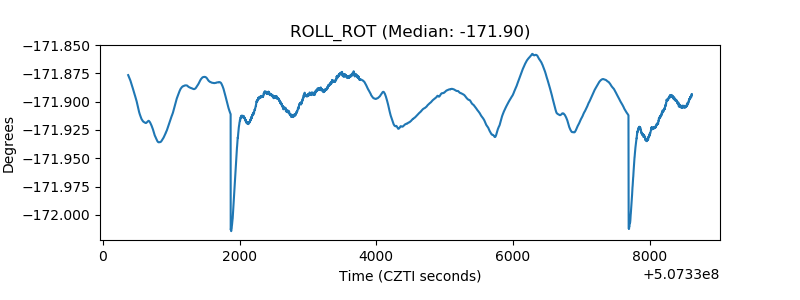 |
| _Roll_DEC | 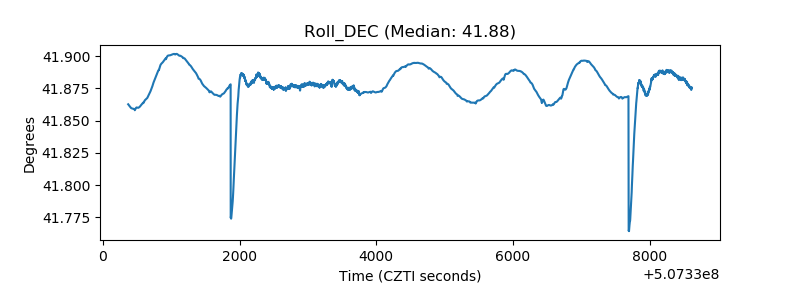 |
| _Roll_RA | 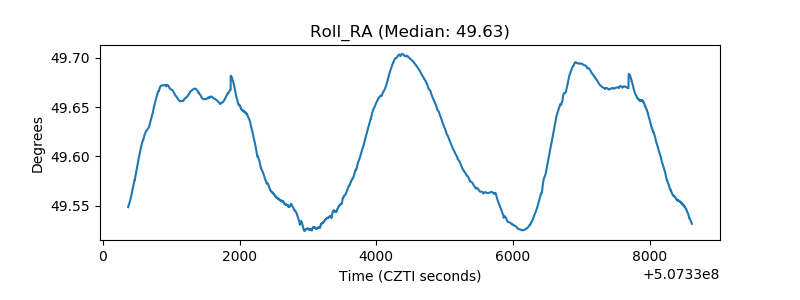 |
| Veto Counter | 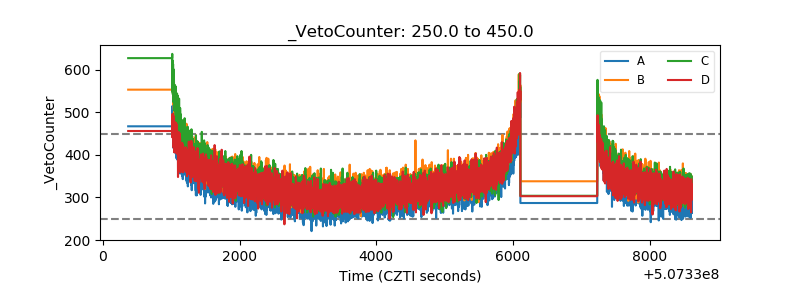 |