| Param | Original file | Final file |
|---|---|---|
| Filename | modeM0/AS1A14_030T02_9000006544_55928cztM0_level2.fits | modeM0/AS1A14_030T02_9000006544_55928cztM0_level2_quad_clean.evt |
| Size (bytes) | 553,590,720 | 91,396,800 |
| Size | 527.9 MB | 87.2 MB |
| Events in quadrant A | 5,189,986 | 564,605 |
| Events in quadrant B | 2,877,613 | 679,168 |
| Events in quadrant C | 5,257,177 | 571,863 |
| Events in quadrant D | 6,642,439 | 481,019 |
| Mode SS | |||
|---|---|---|---|
| Quadrant | BADHDUFLAG | Total packets | Discarded packets |
| A | 0 | 136 | 0 |
| B | 0 | 136 | 0 |
| C | 0 | 136 | 0 |
| D | 0 | 136 | 0 |
| Mode M9 | |||
|---|---|---|---|
| Quadrant | BADHDUFLAG | Total packets | Discarded packets |
| A | 0 | 9 | 0 |
| B | 0 | 10 | 0 |
| C | 0 | 10 | 0 |
| D | 0 | 10 | 0 |
| Mode M0 | |||
|---|---|---|---|
| Quadrant | BADHDUFLAG | Total packets | Discarded packets |
| A | 0 | 20434 | 2 |
| B | 0 | 13965 | 2 |
| C | 0 | 20640 | 2 |
| D | 0 | 24512 | 2 |
| Quadrant | Total seconds | Saturated seconds | Saturation percentage |
|---|---|---|---|
| A | 6759 | 712 | 10.534103% |
| B | 6759 | 78 | 1.154017% |
| C | 6759 | 493 | 7.293978% |
| D | 6759 | 1098 | 16.245007% |
Noise dominated data is calculated using 1-second bins in cleaned event files. If a bin has >2000 counts, and if more than 50% of those come from <1% of pixels, then it is considered to be noise-dominated and hence unusable.
| Quadrant | # 1 sec bins | Bins with >0 counts | Bins with >2000 counts | High rate bins dominated by noise | Noise dominated (total time) | Noise dominated (detector-on time) | Marked lightcurve |
|---|---|---|---|---|---|---|---|
| A | 7574 | 6760 | 720 | 720 | 9.51% | 10.65% | 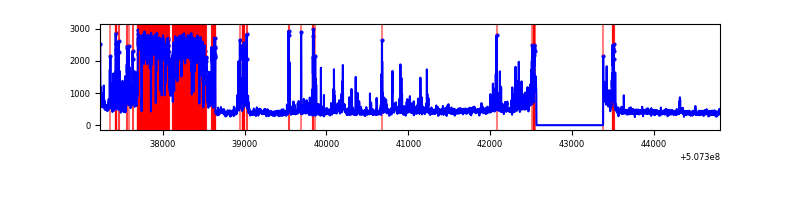 |
| B | 7574 | 6759 | 15 | 15 | 0.20% | 0.22% | 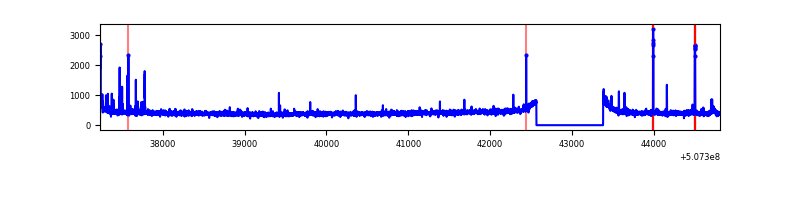 |
| C | 7574 | 6760 | 549 | 549 | 7.25% | 8.12% | 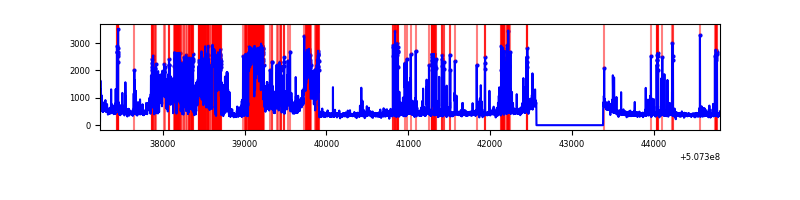 |
| D | 7574 | 6759 | 1096 | 1096 | 14.47% | 16.22% | 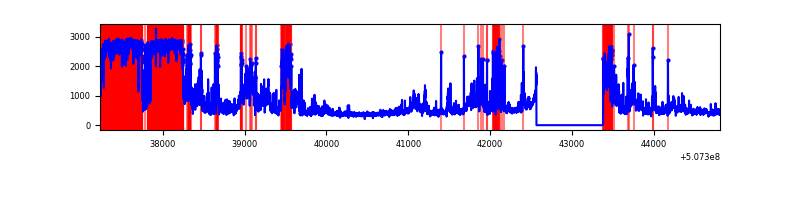 |
Top three noisy pixels from each quadrant. If the there are fewer than three noisy pixels in the level2.evt file, extra rows are filled as -1
| Pixel properties | Quadrant properties | ||||||
|---|---|---|---|---|---|---|---|
| Quadrant | DetID | PixID | Counts | Sigma | Mean | Median | Sigma |
| A | 12 | 115 | 2117879 | 12581.46 | 679 | 661 | 168.3 |
| A | 4 | 249 | 256061 | 1517.7 | 679 | 661 | 168.3 |
| A | 7 | 64 | 54565 | 320.32 | 679 | 661 | 168.3 |
| B | 9 | 251 | 51616 | 343.03 | 695 | 670 | 148.5 |
| B | 12 | 111 | 18187 | 117.95 | 695 | 670 | 148.5 |
| B | 11 | 111 | 17019 | 110.08 | 695 | 670 | 148.5 |
| C | 13 | 3 | 1973610 | 10669.13 | 669 | 662 | 184.9 |
| C | 12 | 252 | 458794 | 2477.44 | 669 | 662 | 184.9 |
| C | 15 | 199 | 152160 | 819.25 | 669 | 662 | 184.9 |
| D | 11 | 129 | 3795362 | 21791.01 | 611 | 584 | 174.1 |
| D | 2 | 62 | 143718 | 821.93 | 611 | 584 | 174.1 |
| D | 6 | 31 | 141117 | 806.99 | 611 | 584 | 174.1 |
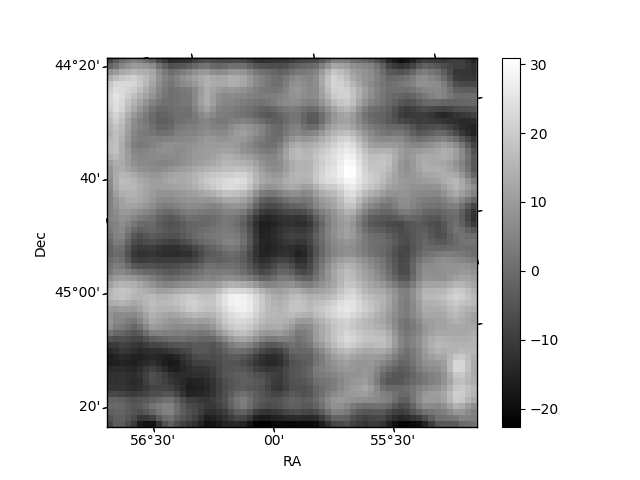
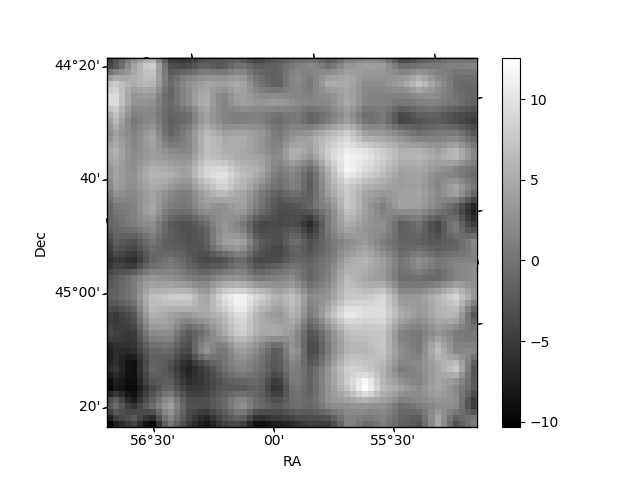
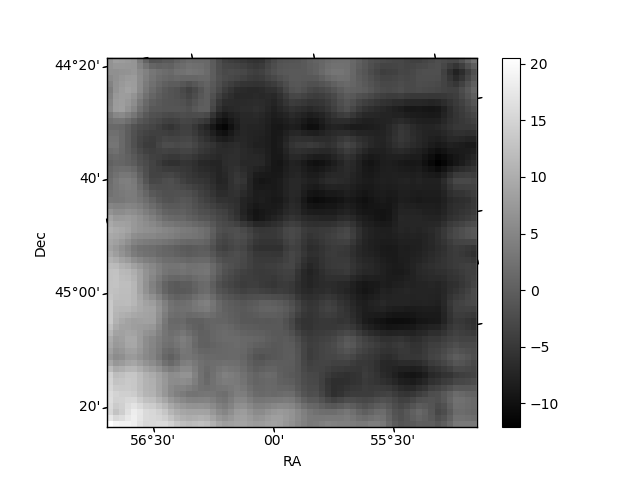
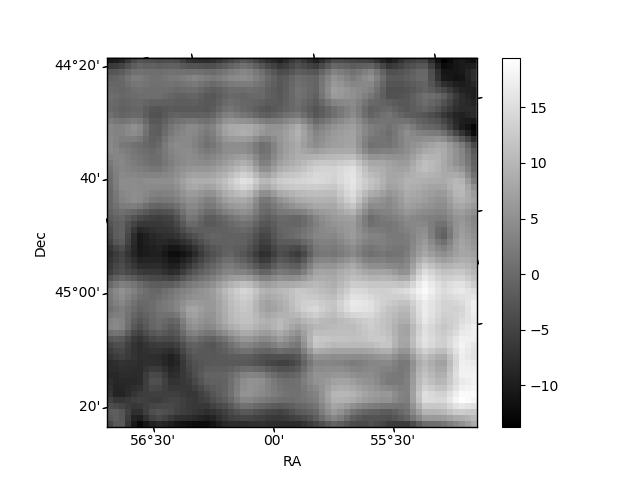
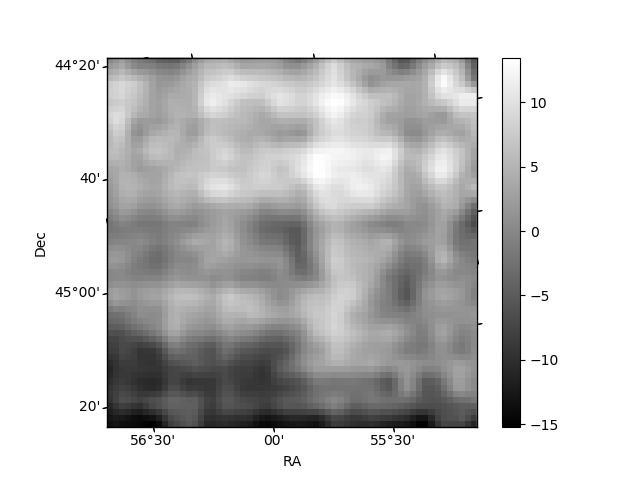
Histogram calculated using DETX and DETY for each event in the final _common_clean file
| Quadrant A | 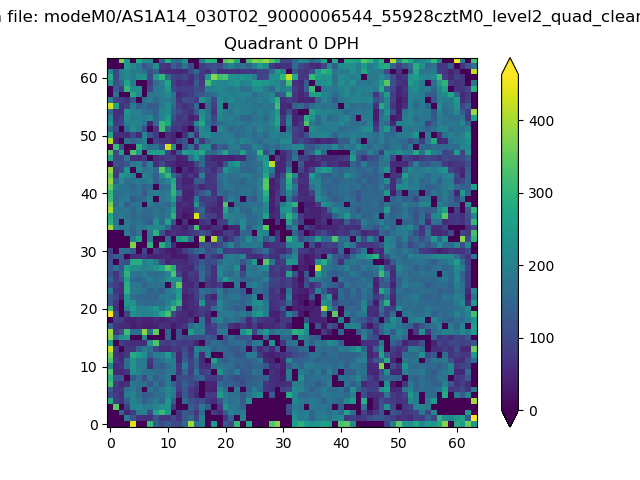 |
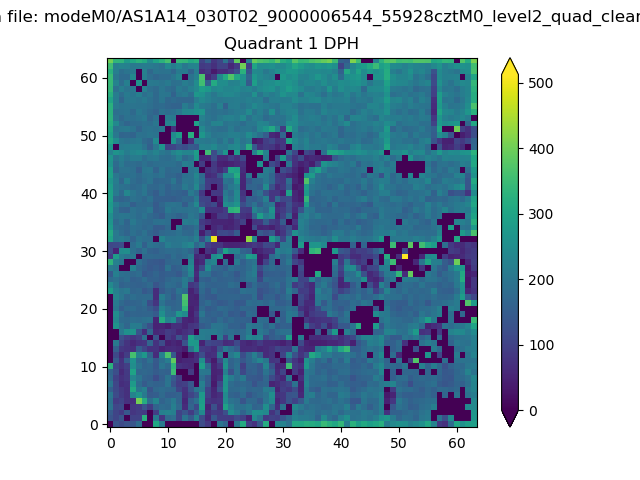 |
Quadrant B |
|---|---|---|---|
| Quadrant D | 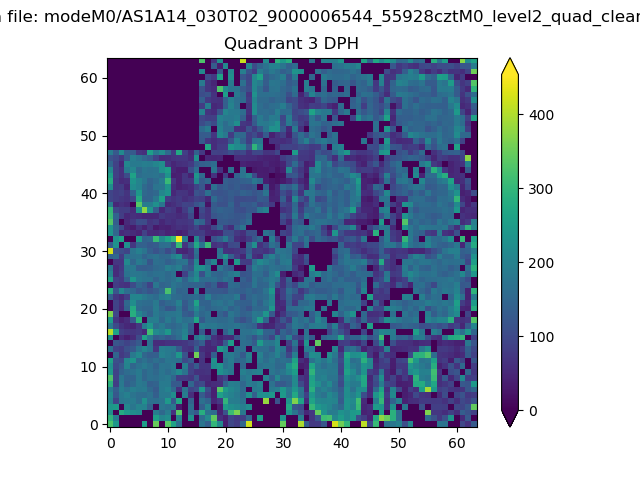 |
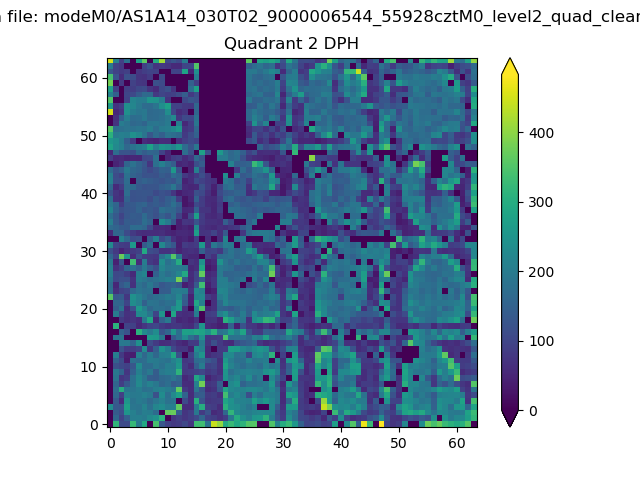 |
Quadrant C |
| Plot type | Count rate plots | Images |
|---|---|---|
| Comparison with Poisson distribution Blue bars denote a histogram of data divided into 1 sec bins. Red curve is a Poisson curve with rate = median count rate of data. |
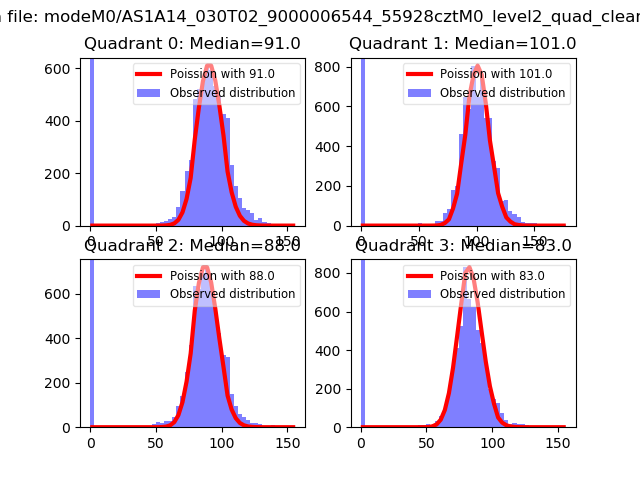 |
 |
| Quadrant-wise count rates Data is divided into 100 sec bins |
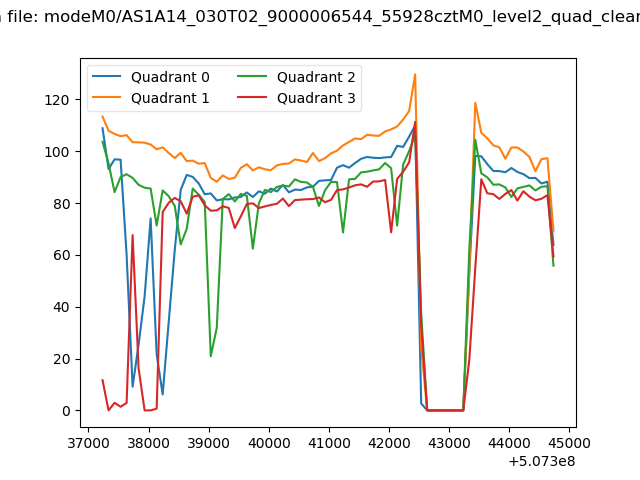 |
|
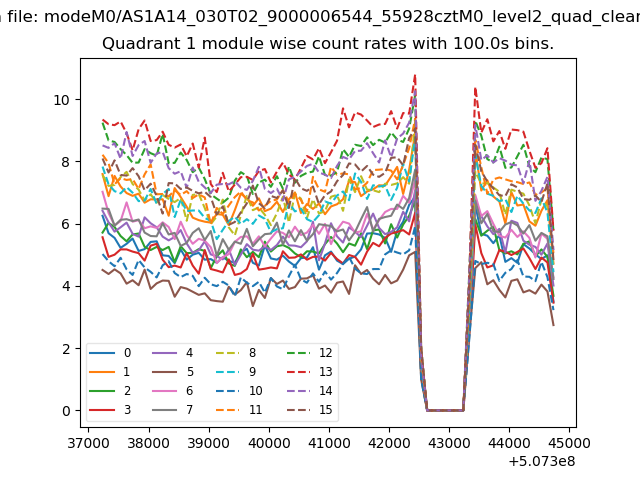
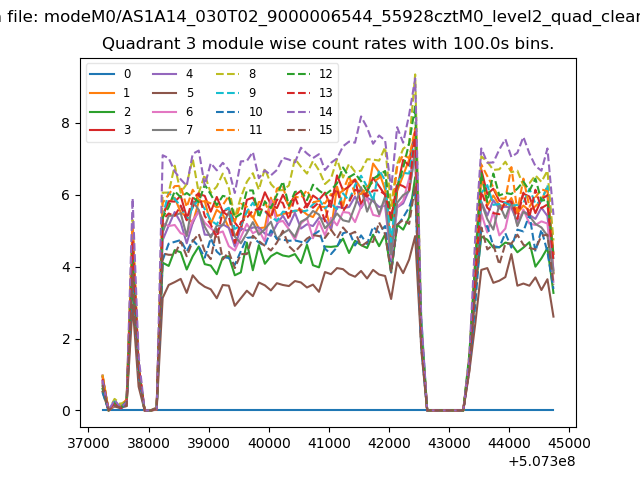
| Module-wise count rates for Quadrant A Data is divided into 100 sec bins |
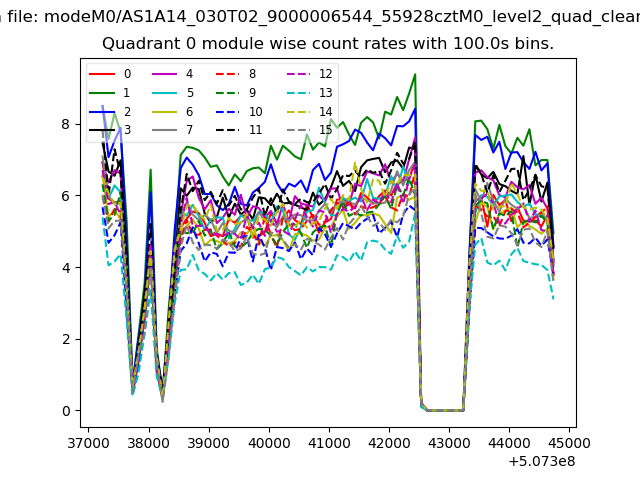 |
 |
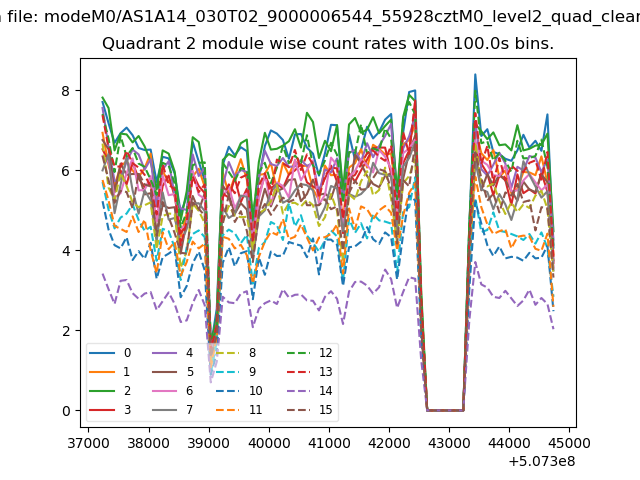
| Module-wise count rates for Quadrant B Data is divided into 100 sec bins |
 |
 |
| Module-wise count rates for Quadrant C Data is divided into 100 sec bins |
 |
 |
| Module-wise count rates for Quadrant D Data is divided into 100 sec bins |
 |
 |
| Parameter | Plot |
|---|---|
| CZT HV Monitor | 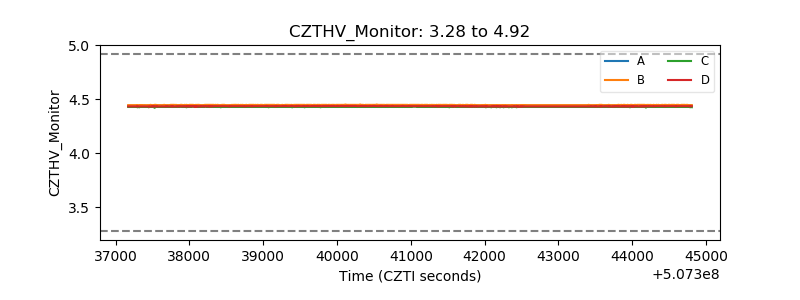 |
| D_VDD | 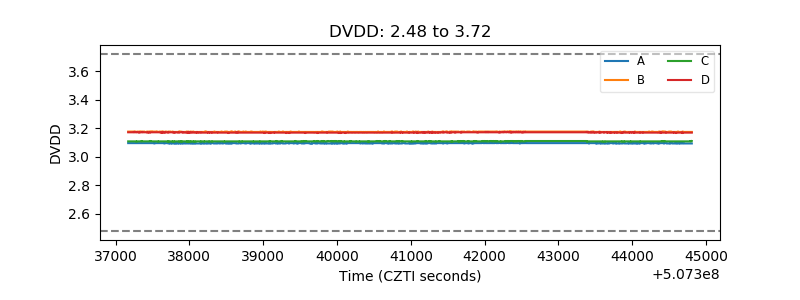 |
| Temperature 1 | 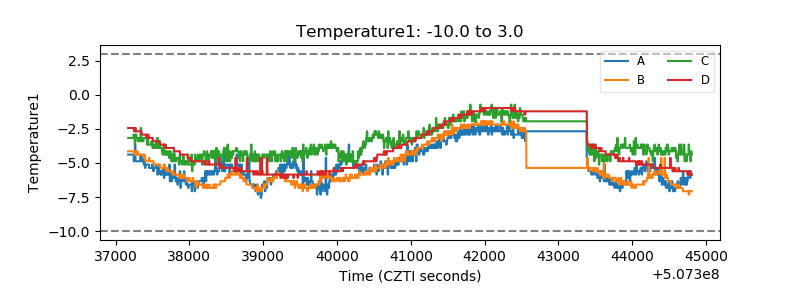 |
| Veto HV Monitor | 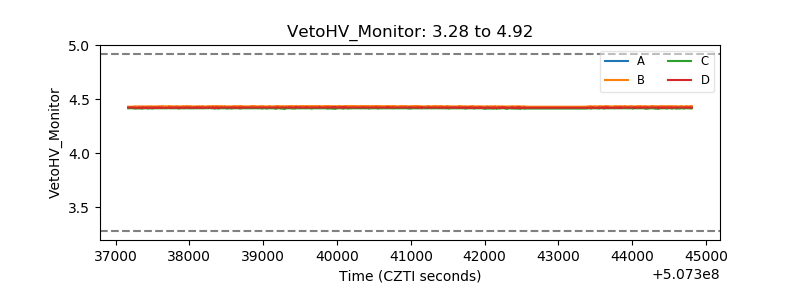 |
| Veto LLD | 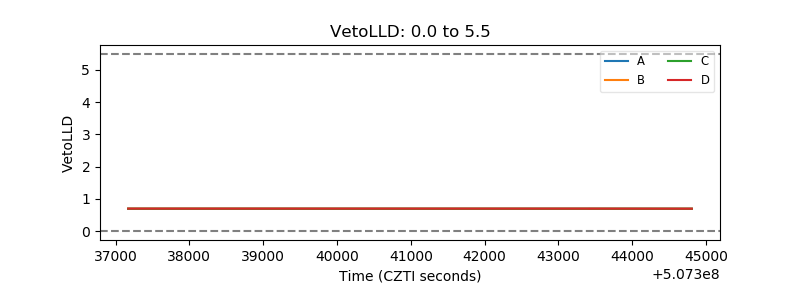 |
| Alpha Counter | 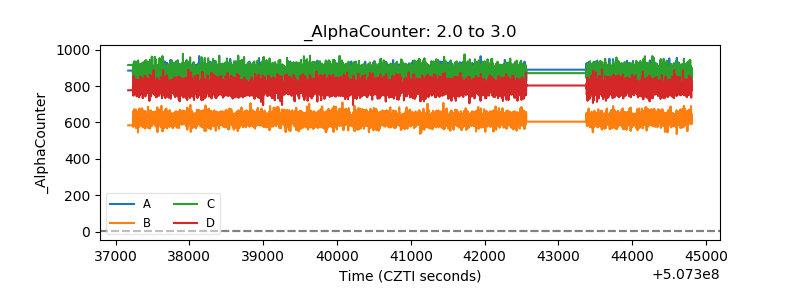 |
| _CPM_Rate | 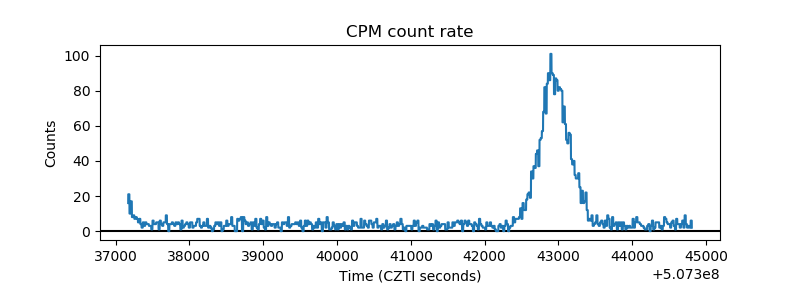 |
| CZT Counter | 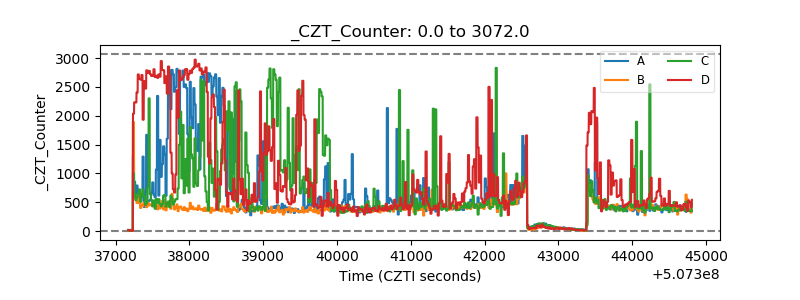 |
| +2.5 Volts monitor | 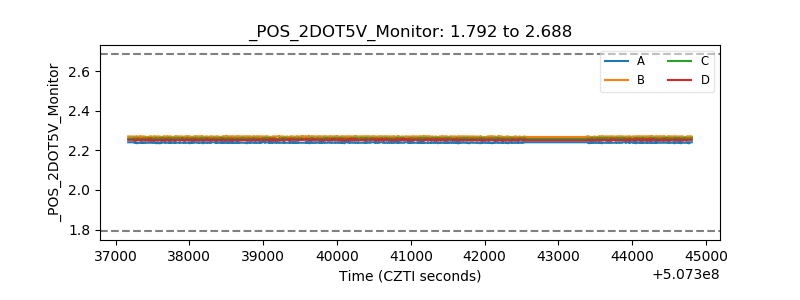 |
| +5 Volts monitor | 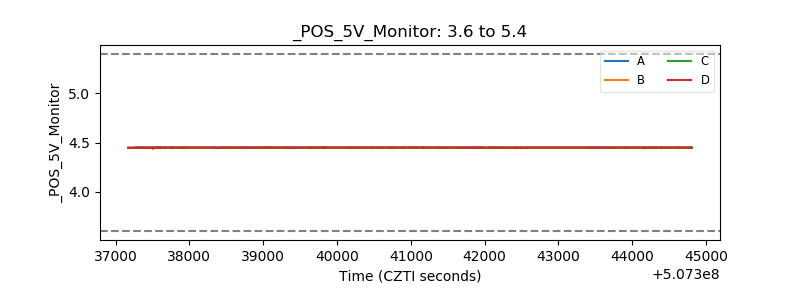 |
| _ROLL_ROT | 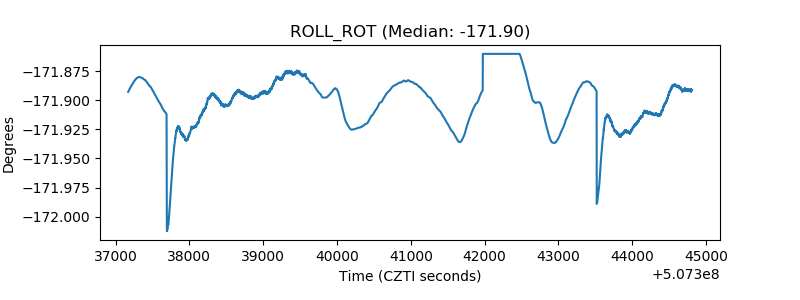 |
| _Roll_DEC | 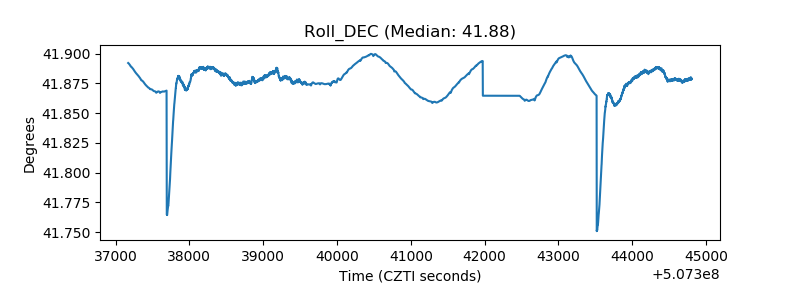 |
| _Roll_RA | 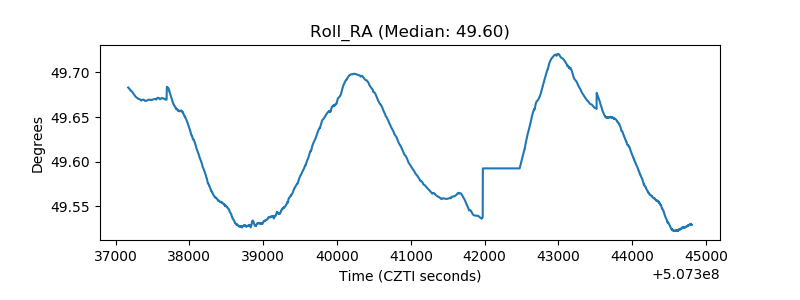 |
| Veto Counter | 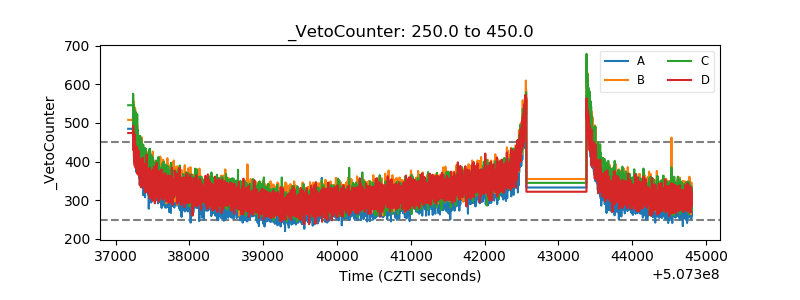 |