| Param | Original file | Final file |
|---|---|---|
| Filename | modeM0/AS1A14_030T02_9000006544_55929cztM0_level2.fits | modeM0/AS1A14_030T02_9000006544_55929cztM0_level2_quad_clean.evt |
| Size (bytes) | 569,122,560 | 103,590,720 |
| Size | 542.8 MB | 98.8 MB |
| Events in quadrant A | 6,248,582 | 597,802 |
| Events in quadrant B | 3,587,295 | 758,257 |
| Events in quadrant C | 4,459,133 | 657,742 |
| Events in quadrant D | 6,177,005 | 591,147 |
| Mode SS | |||
|---|---|---|---|
| Quadrant | BADHDUFLAG | Total packets | Discarded packets |
| A | 0 | 154 | 0 |
| B | 0 | 154 | 0 |
| C | 0 | 154 | 0 |
| D | 0 | 154 | 0 |
| Mode M9 | |||
|---|---|---|---|
| Quadrant | BADHDUFLAG | Total packets | Discarded packets |
| A | 0 | 12 | 0 |
| B | 0 | 12 | 0 |
| C | 0 | 12 | 0 |
| D | 0 | 12 | 0 |
| Mode M0 | |||
|---|---|---|---|
| Quadrant | BADHDUFLAG | Total packets | Discarded packets |
| A | 0 | 24356 | 2 |
| B | 0 | 16401 | 2 |
| C | 0 | 19194 | 2 |
| D | 0 | 23808 | 3 |
| Quadrant | Total seconds | Saturated seconds | Saturation percentage |
|---|---|---|---|
| A | 7654 | 1269 | 16.579566% |
| B | 7655 | 176 | 2.299151% |
| C | 7655 | 392 | 5.120836% |
| D | 7654 | 739 | 9.655082% |
Noise dominated data is calculated using 1-second bins in cleaned event files. If a bin has >2000 counts, and if more than 50% of those come from <1% of pixels, then it is considered to be noise-dominated and hence unusable.
| Quadrant | # 1 sec bins | Bins with >0 counts | Bins with >2000 counts | High rate bins dominated by noise | Noise dominated (total time) | Noise dominated (detector-on time) | Marked lightcurve |
|---|---|---|---|---|---|---|---|
| A | 8789 | 7656 | 1194 | 1194 | 13.59% | 15.60% | 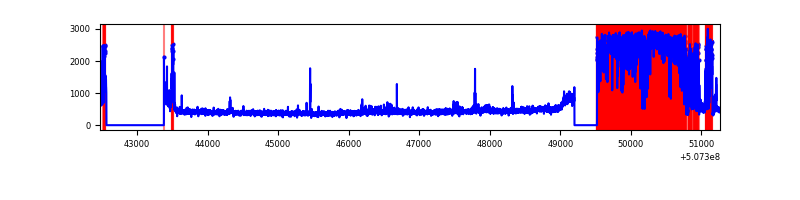 |
| B | 8790 | 7655 | 16 | 16 | 0.18% | 0.21% | 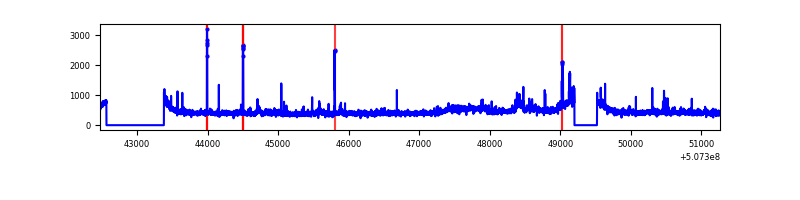 |
| C | 8790 | 7657 | 320 | 320 | 3.64% | 4.18% | 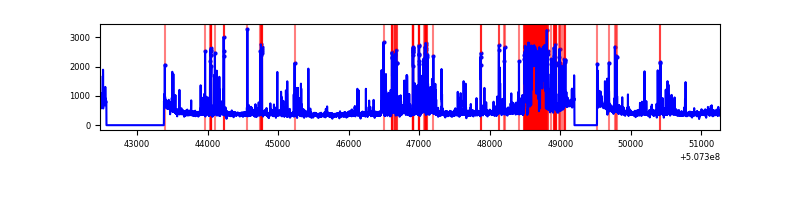 |
| D | 8789 | 7655 | 664 | 664 | 7.55% | 8.67% | 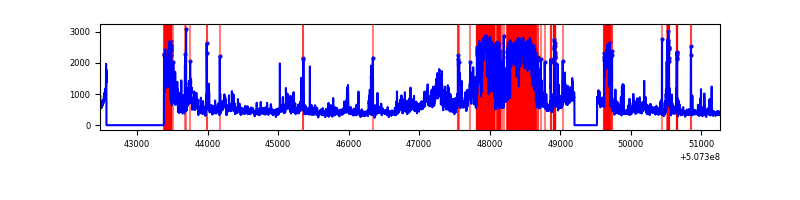 |
Top three noisy pixels from each quadrant. If the there are fewer than three noisy pixels in the level2.evt file, extra rows are filled as -1
| Pixel properties | Quadrant properties | ||||||
|---|---|---|---|---|---|---|---|
| Quadrant | DetID | PixID | Counts | Sigma | Mean | Median | Sigma |
| A | 12 | 115 | 3067664 | 16439.43 | 755 | 737 | 186.6 |
| A | 4 | 249 | 97853 | 520.56 | 755 | 737 | 186.6 |
| A | 7 | 64 | 43927 | 231.51 | 755 | 737 | 186.6 |
| B | 7 | 0 | 202527 | 1171.98 | 805 | 775 | 172.1 |
| B | 7 | 252 | 38568 | 219.54 | 805 | 775 | 172.1 |
| B | 9 | 251 | 37563 | 213.7 | 805 | 775 | 172.1 |
| C | 12 | 252 | 1136187 | 5320.85 | 778 | 769 | 213.4 |
| C | 15 | 199 | 127336 | 593.12 | 778 | 769 | 213.4 |
| C | 6 | 223 | 59019 | 272.97 | 778 | 769 | 213.4 |
| D | 11 | 129 | 2612514 | 12346.1 | 749 | 715 | 211.5 |
| D | 2 | 62 | 275816 | 1300.42 | 749 | 715 | 211.5 |
| D | 7 | 129 | 167664 | 789.18 | 749 | 715 | 211.5 |
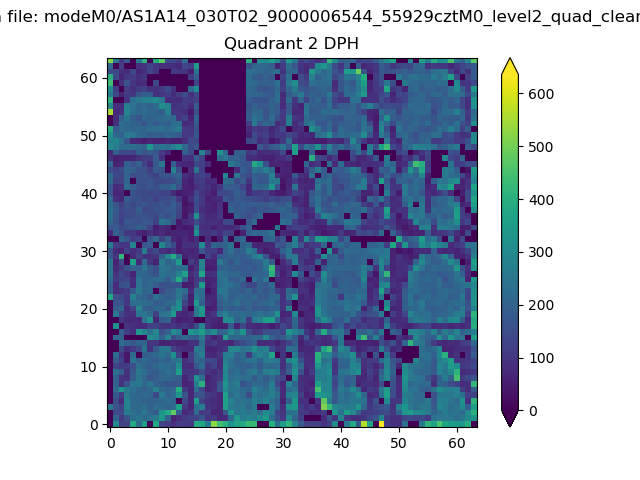
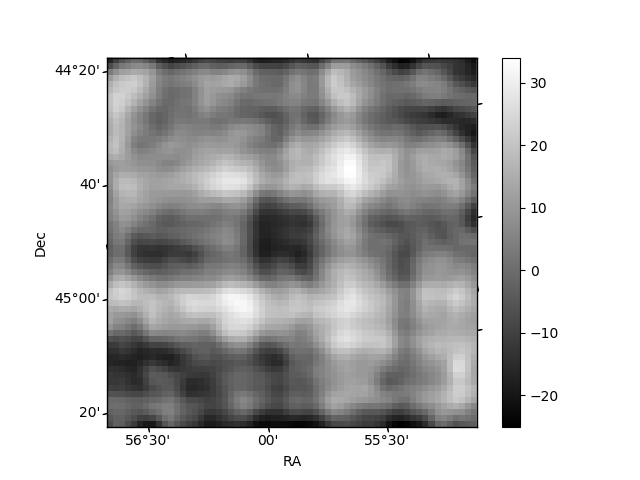
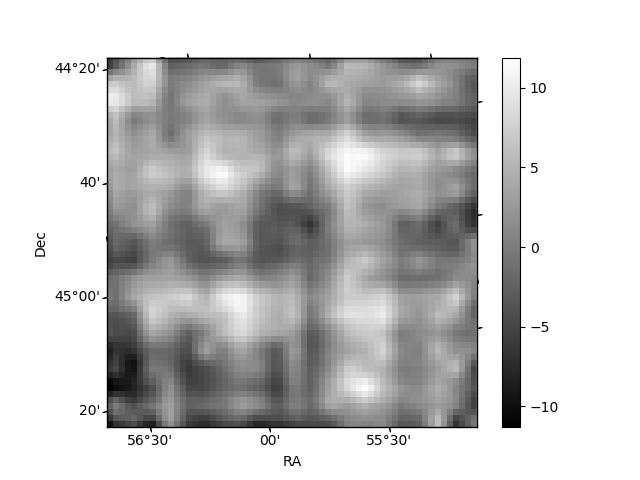
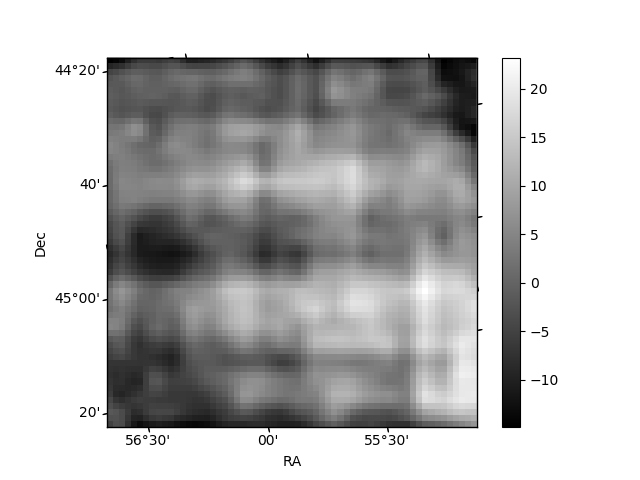
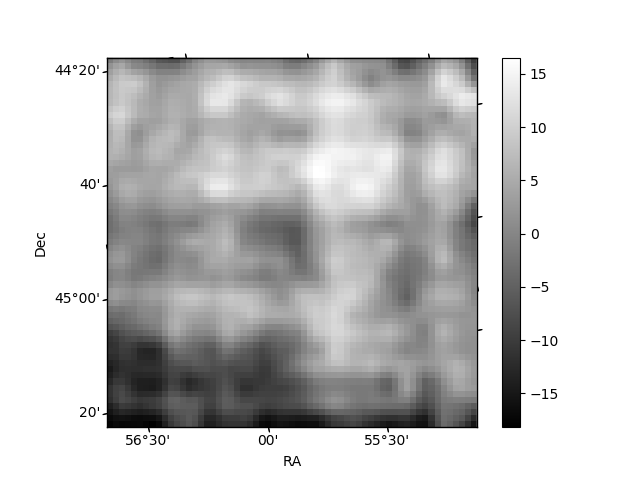
Histogram calculated using DETX and DETY for each event in the final _common_clean file
| Quadrant A | 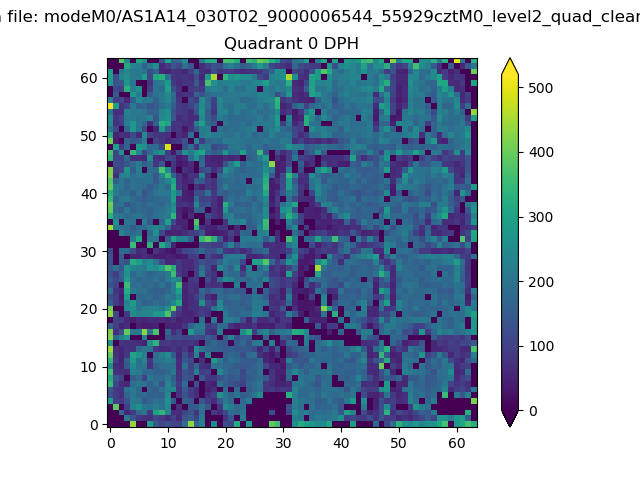 |
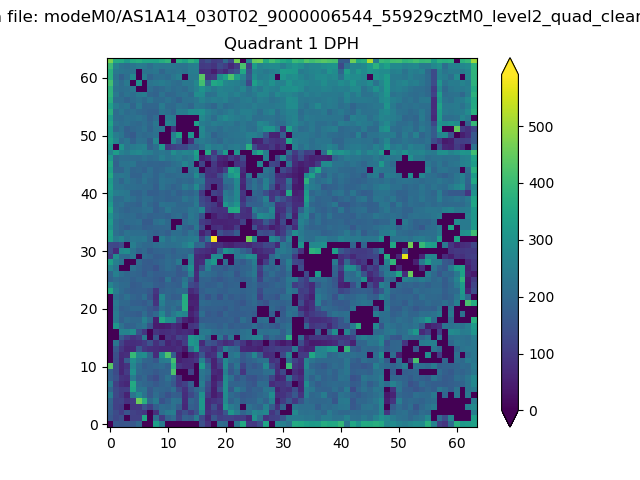 |
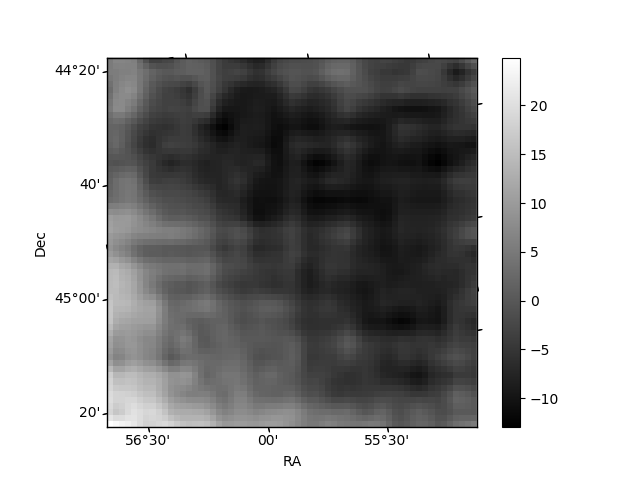
Quadrant B |
|---|---|---|---|
| Quadrant D | 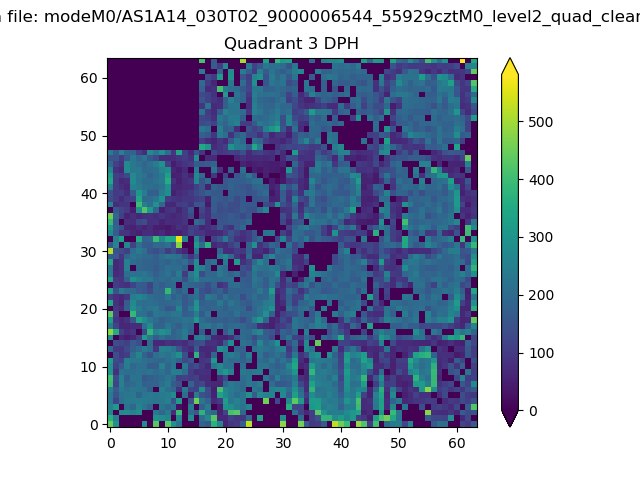 |
 |
Quadrant C |
| Plot type | Count rate plots | Images |
|---|---|---|
| Comparison with Poisson distribution Blue bars denote a histogram of data divided into 1 sec bins. Red curve is a Poisson curve with rate = median count rate of data. |
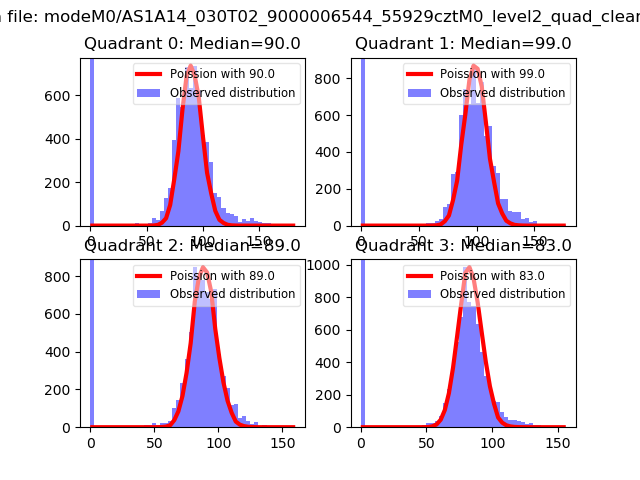 |
 |
| Quadrant-wise count rates Data is divided into 100 sec bins |
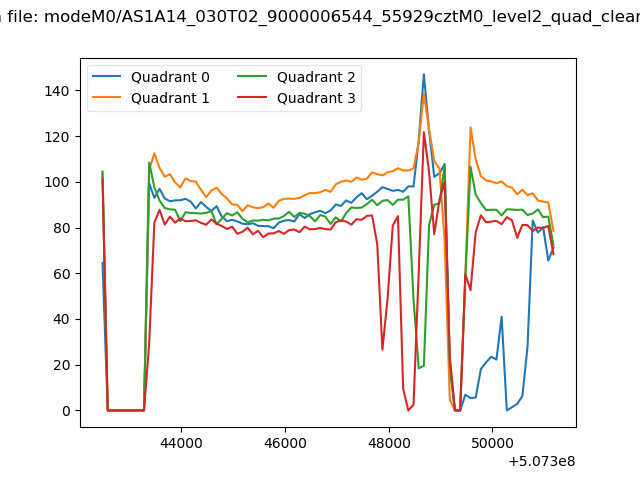 |
|
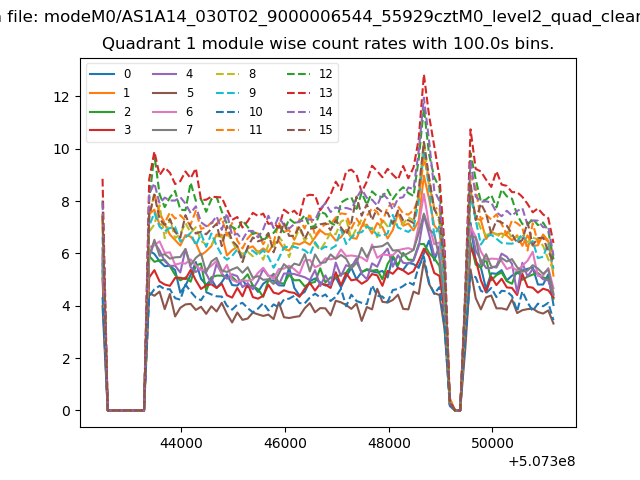
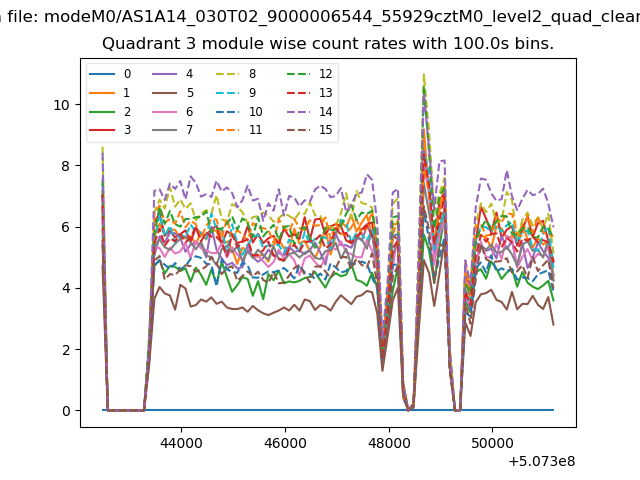
| Module-wise count rates for Quadrant A Data is divided into 100 sec bins |
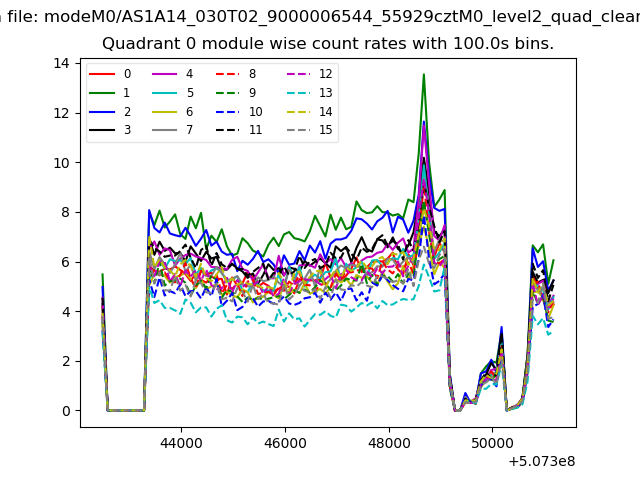 |
 |
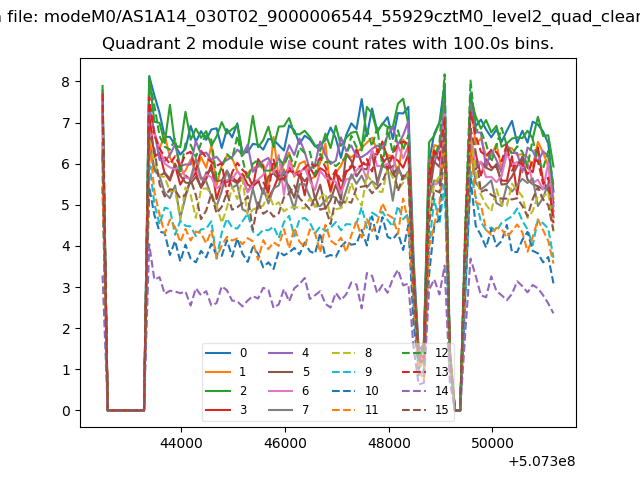
| Module-wise count rates for Quadrant B Data is divided into 100 sec bins |
 |
 |
| Module-wise count rates for Quadrant C Data is divided into 100 sec bins |
 |
 |
| Module-wise count rates for Quadrant D Data is divided into 100 sec bins |
 |
 |
| Parameter | Plot |
|---|---|
| CZT HV Monitor | 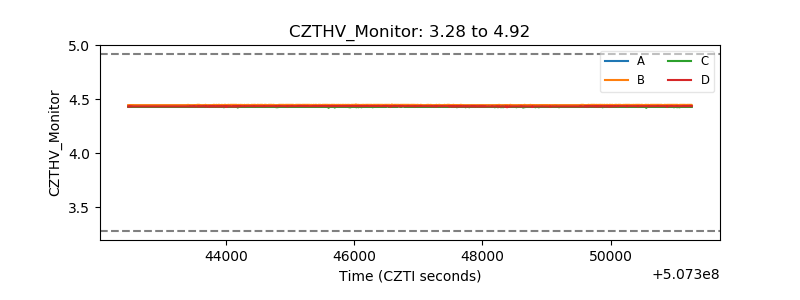 |
| D_VDD | 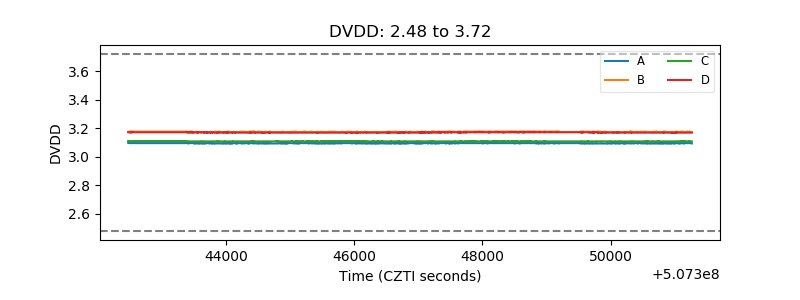 |
| Temperature 1 | 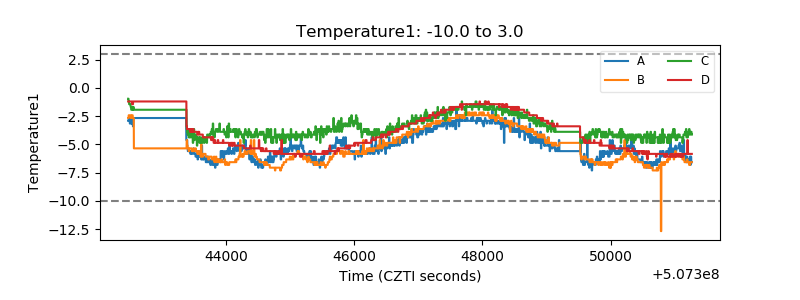 |
| Veto HV Monitor | 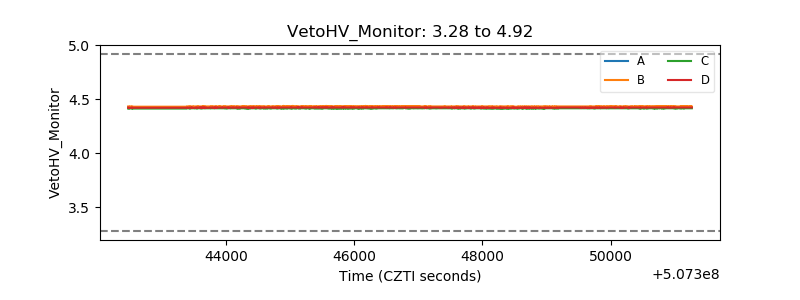 |
| Veto LLD | 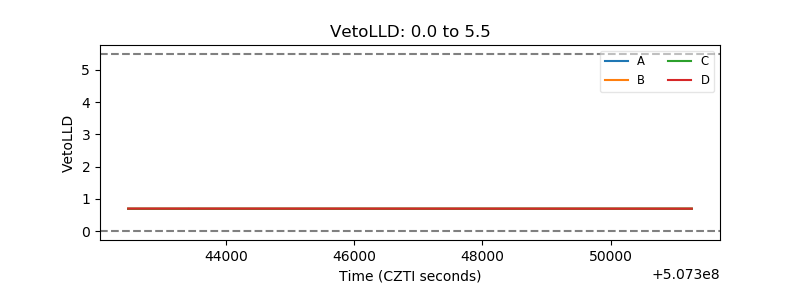 |
| Alpha Counter | 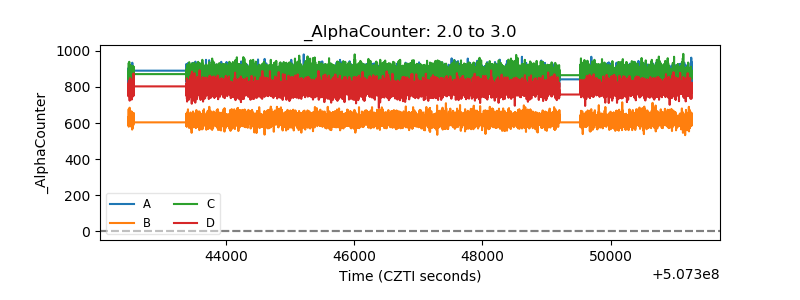 |
| _CPM_Rate | 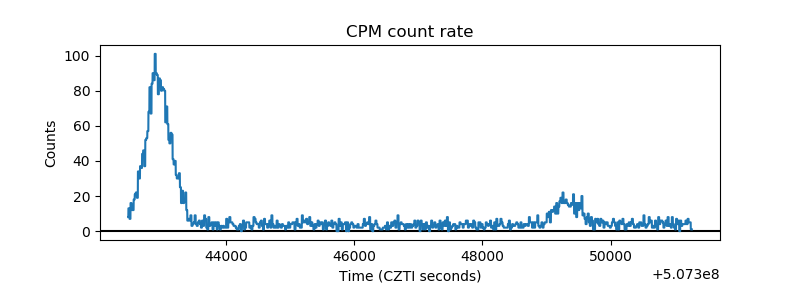 |
| CZT Counter | 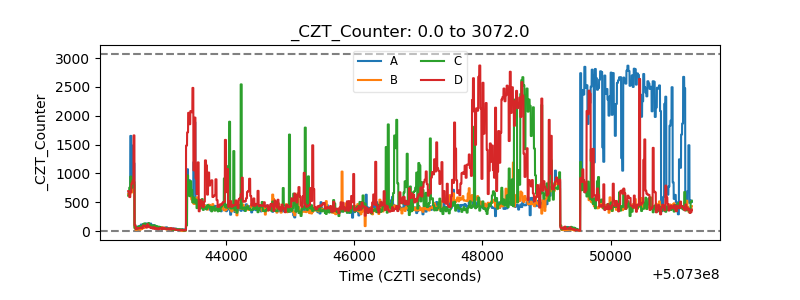 |
| +2.5 Volts monitor | 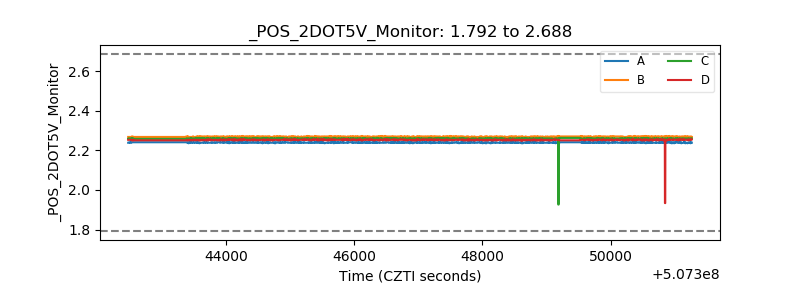 |
| +5 Volts monitor |  |
| _ROLL_ROT | 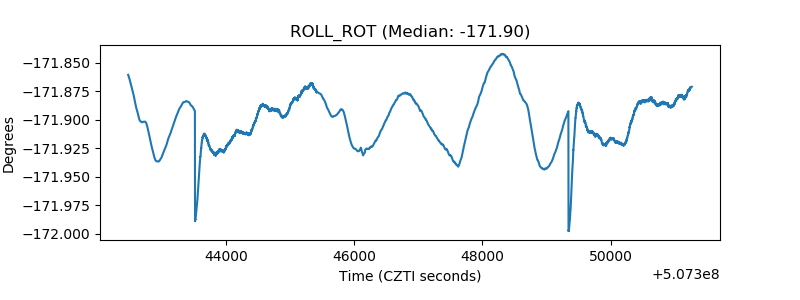 |
| _Roll_DEC | 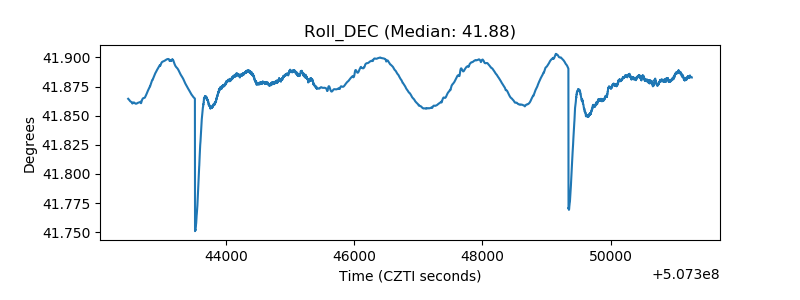 |
| _Roll_RA | 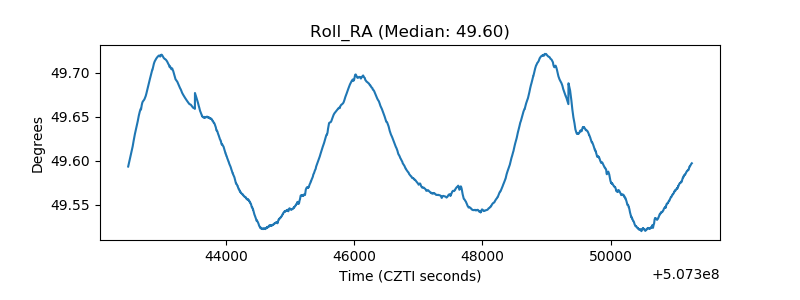 |
| Veto Counter | 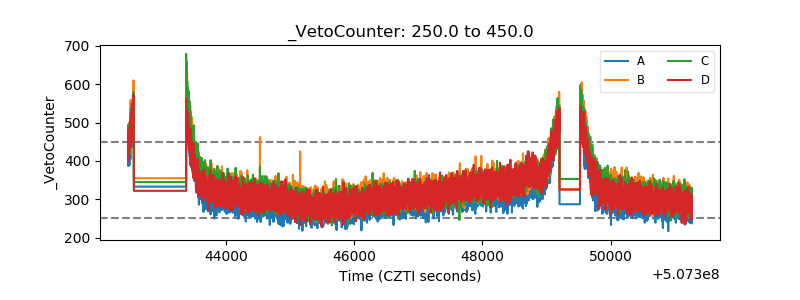 |