| Param | Original file | Final file |
|---|---|---|
| Filename | modeM0/AS1A14_030T02_9000006544_55930cztM0_level2.fits | modeM0/AS1A14_030T02_9000006544_55930cztM0_level2_quad_clean.evt |
| Size (bytes) | 700,496,640 | 112,314,240 |
| Size | 668.0 MB | 107.1 MB |
| Events in quadrant A | 6,743,214 | 670,667 |
| Events in quadrant B | 3,782,926 | 836,758 |
| Events in quadrant C | 6,122,468 | 701,229 |
| Events in quadrant D | 8,631,782 | 610,185 |
| Mode SS | |||
|---|---|---|---|
| Quadrant | BADHDUFLAG | Total packets | Discarded packets |
| A | 0 | 170 | 0 |
| B | 0 | 170 | 0 |
| C | 0 | 170 | 0 |
| D | 0 | 170 | 0 |
| Mode M9 | |||
|---|---|---|---|
| Quadrant | BADHDUFLAG | Total packets | Discarded packets |
| A | 0 | 3 | 0 |
| B | 0 | 3 | 0 |
| C | 0 | 3 | 0 |
| D | 0 | 3 | 0 |
| Mode M0 | |||
|---|---|---|---|
| Quadrant | BADHDUFLAG | Total packets | Discarded packets |
| A | 0 | 26187 | 1 |
| B | 0 | 17615 | 1 |
| C | 0 | 24231 | 1 |
| D | 0 | 31651 | 1 |
| Quadrant | Total seconds | Saturated seconds | Saturation percentage |
|---|---|---|---|
| A | 8374 | 1197 | 14.294244% |
| B | 8374 | 127 | 1.516599% |
| C | 8374 | 644 | 7.690471% |
| D | 8374 | 1357 | 16.204920% |
Noise dominated data is calculated using 1-second bins in cleaned event files. If a bin has >2000 counts, and if more than 50% of those come from <1% of pixels, then it is considered to be noise-dominated and hence unusable.
| Quadrant | # 1 sec bins | Bins with >0 counts | Bins with >2000 counts | High rate bins dominated by noise | Noise dominated (total time) | Noise dominated (detector-on time) | Marked lightcurve |
|---|---|---|---|---|---|---|---|
| A | 8694 | 8375 | 1177 | 1177 | 13.54% | 14.05% | 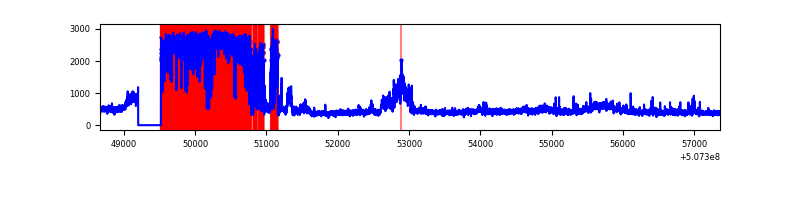 |
| B | 8694 | 8374 | 12 | 12 | 0.14% | 0.14% | 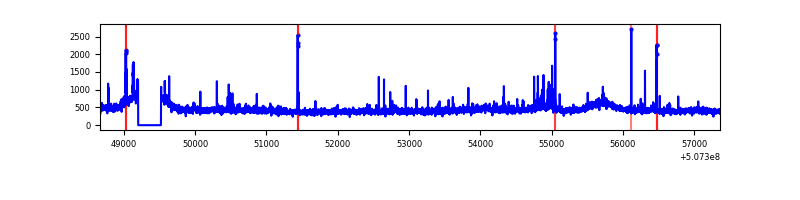 |
| C | 8694 | 8375 | 550 | 550 | 6.33% | 6.57% | 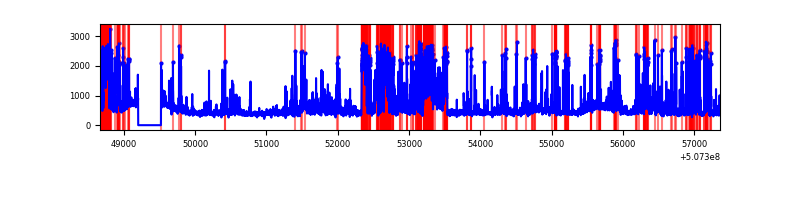 |
| D | 8694 | 8375 | 1397 | 1397 | 16.07% | 16.68% | 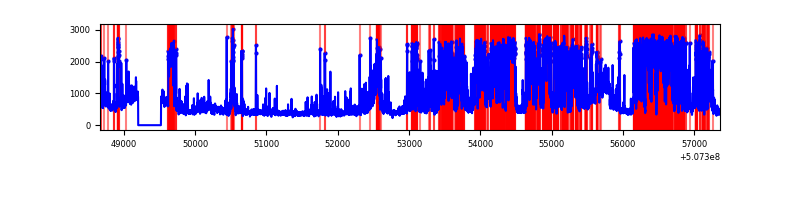 |
Top three noisy pixels from each quadrant. If the there are fewer than three noisy pixels in the level2.evt file, extra rows are filled as -1
| Pixel properties | Quadrant properties | ||||||
|---|---|---|---|---|---|---|---|
| Quadrant | DetID | PixID | Counts | Sigma | Mean | Median | Sigma |
| A | 12 | 115 | 3367883 | 16086.33 | 841 | 817 | 209.3 |
| A | 12 | 194 | 32524 | 151.48 | 841 | 817 | 209.3 |
| A | 4 | 206 | 29047 | 134.87 | 841 | 817 | 209.3 |
| B | 7 | 252 | 76684 | 398.21 | 889 | 854 | 190.4 |
| B | 7 | 0 | 69269 | 359.27 | 889 | 854 | 190.4 |
| B | 2 | 249 | 31837 | 162.7 | 889 | 854 | 190.4 |
| C | 12 | 252 | 1642830 | 7044.5 | 849 | 839 | 233.1 |
| C | 13 | 3 | 684912 | 2934.82 | 849 | 839 | 233.1 |
| C | 15 | 199 | 371253 | 1589.16 | 849 | 839 | 233.1 |
| D | 11 | 129 | 4302517 | 18641.76 | 817 | 780 | 230.8 |
| D | 7 | 129 | 555940 | 2405.81 | 817 | 780 | 230.8 |
| D | 6 | 42 | 249670 | 1078.58 | 817 | 780 | 230.8 |
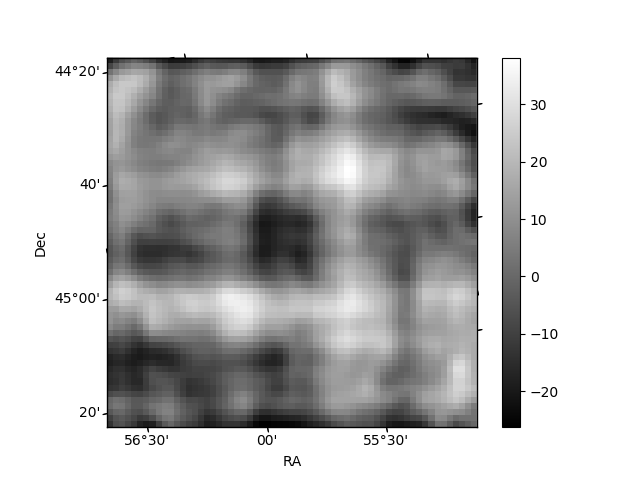
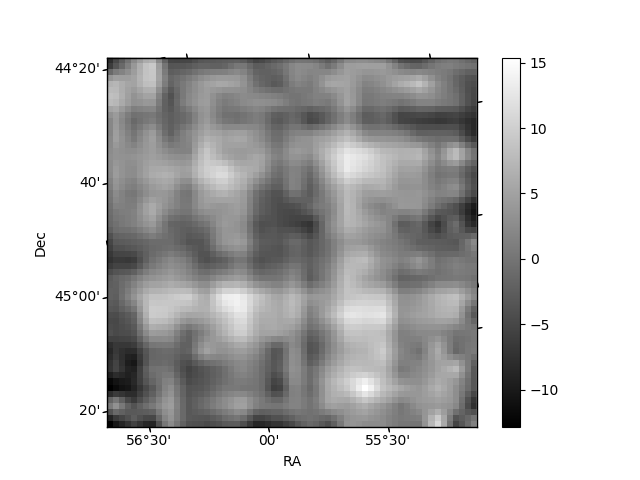
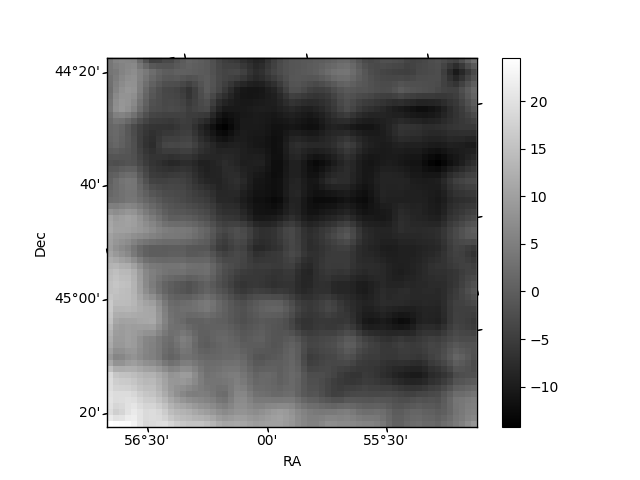
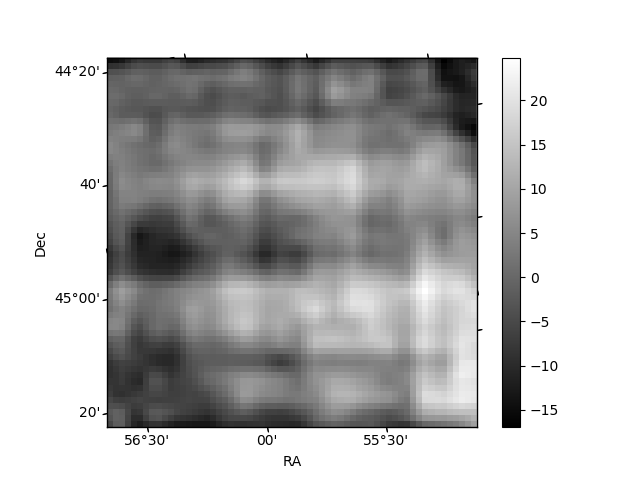
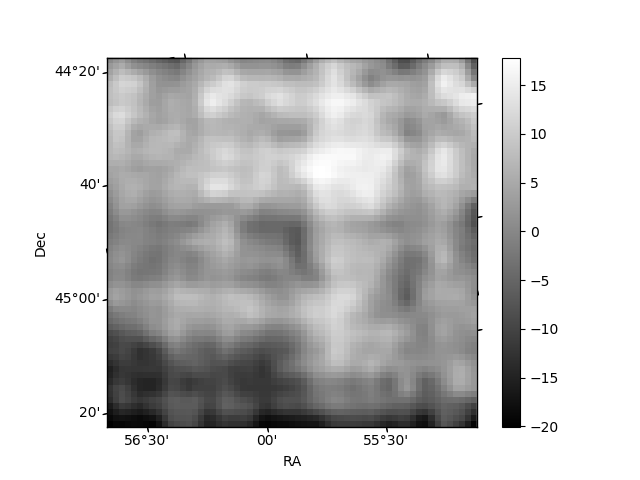
Histogram calculated using DETX and DETY for each event in the final _common_clean file
| Quadrant A | 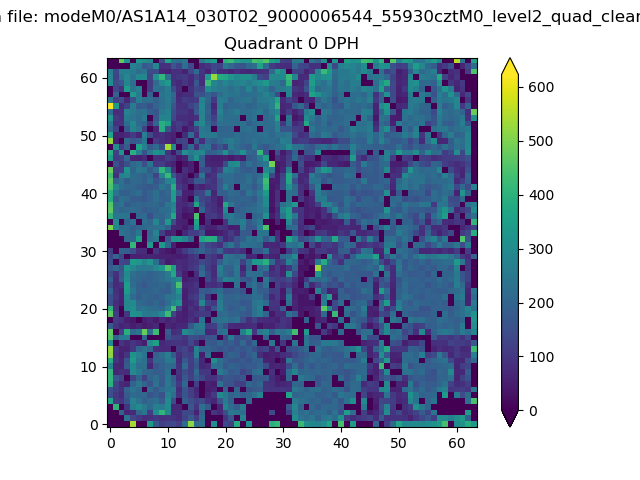 |
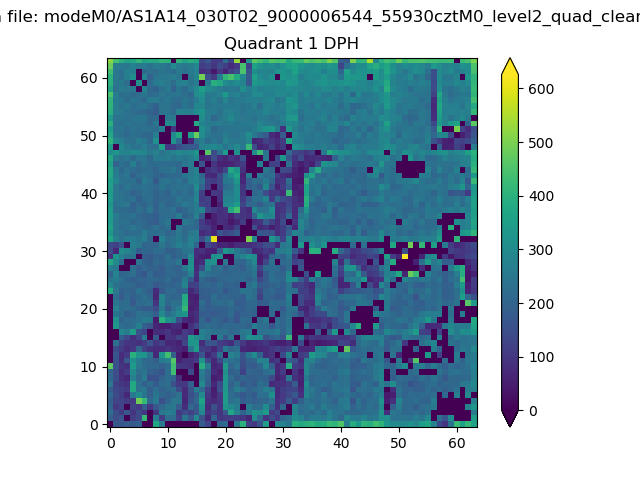 |
Quadrant B |
|---|---|---|---|
| Quadrant D | 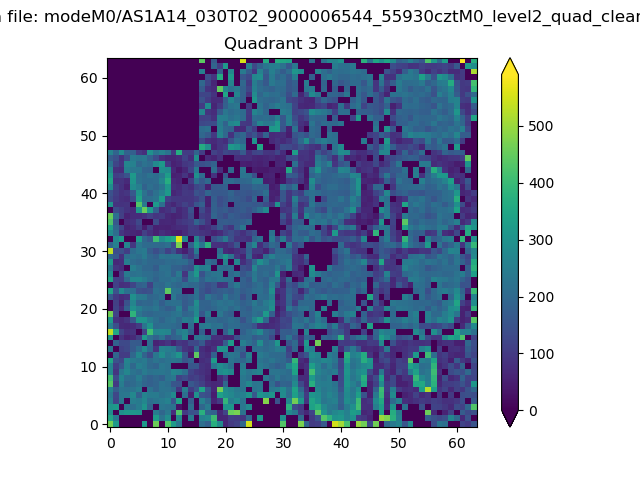 |
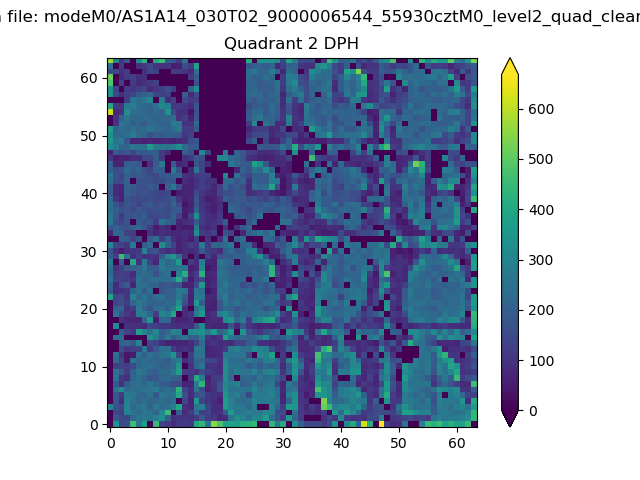 |
Quadrant C |
| Plot type | Count rate plots | Images |
|---|---|---|
| Comparison with Poisson distribution Blue bars denote a histogram of data divided into 1 sec bins. Red curve is a Poisson curve with rate = median count rate of data. |
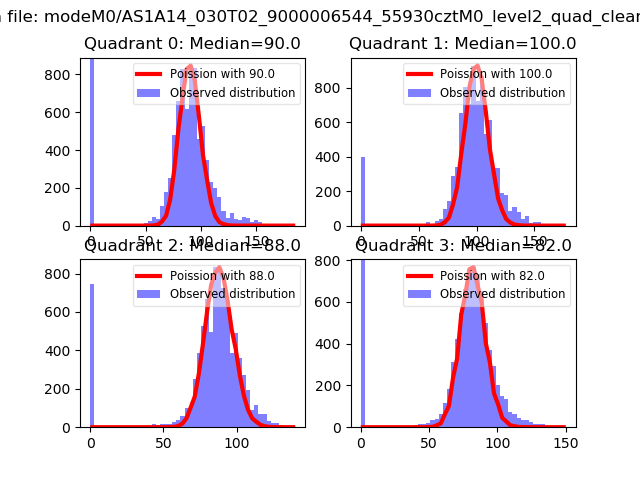 |
 |
| Quadrant-wise count rates Data is divided into 100 sec bins |
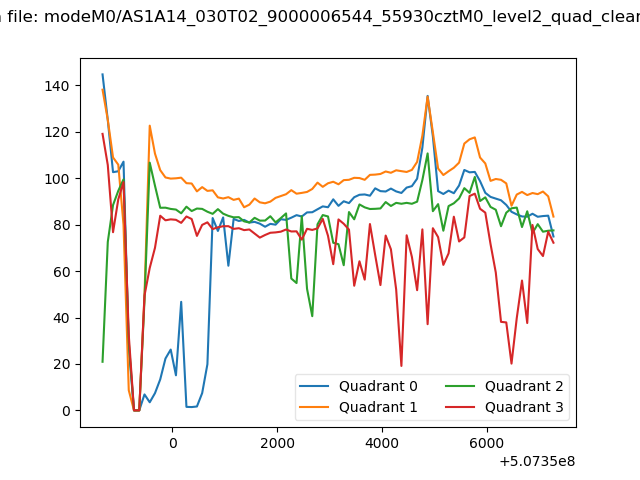 |
|
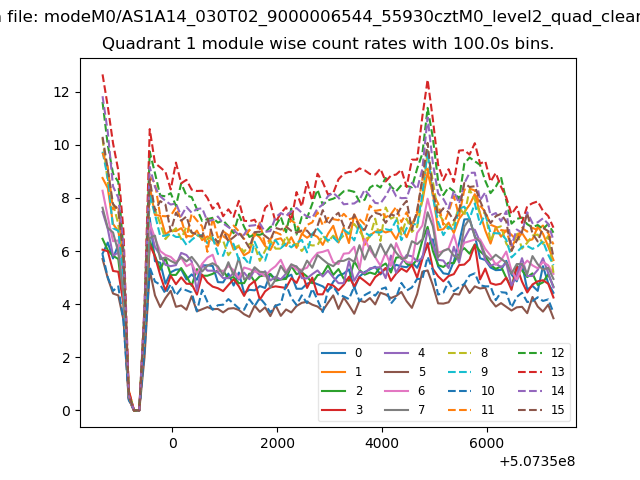
| Module-wise count rates for Quadrant A Data is divided into 100 sec bins |
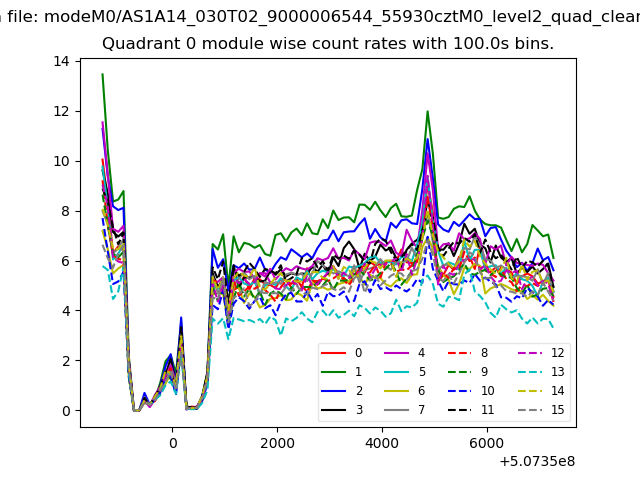 |
 |
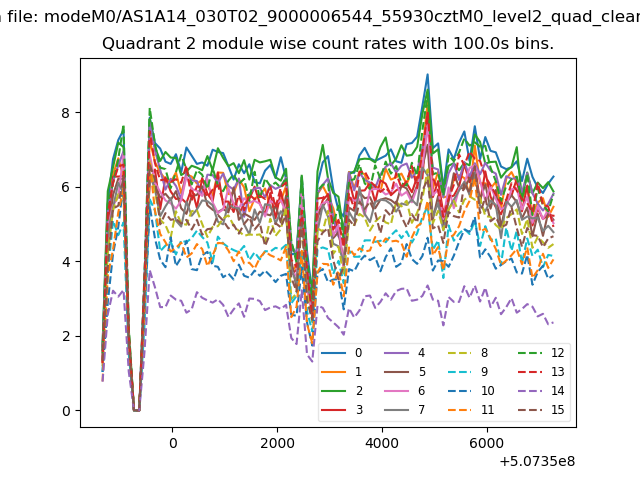
| Module-wise count rates for Quadrant B Data is divided into 100 sec bins |
 |
 |
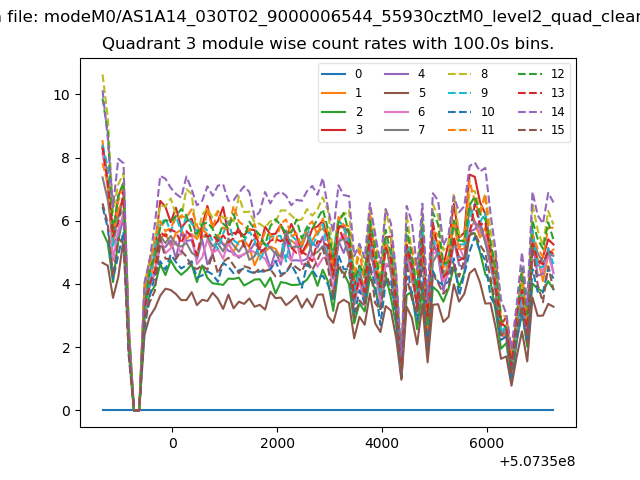
| Module-wise count rates for Quadrant C Data is divided into 100 sec bins |
 |
 |
| Module-wise count rates for Quadrant D Data is divided into 100 sec bins |
 |
 |
| Parameter | Plot |
|---|---|
| CZT HV Monitor | 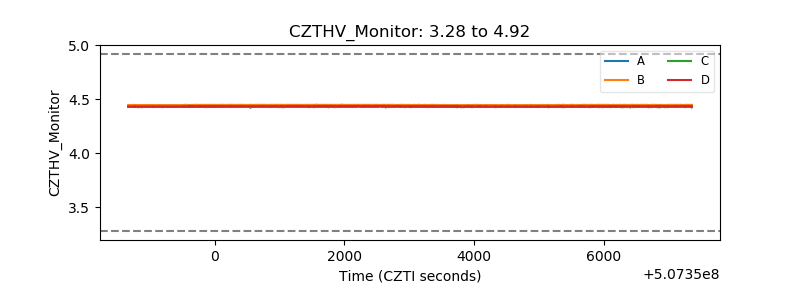 |
| D_VDD | 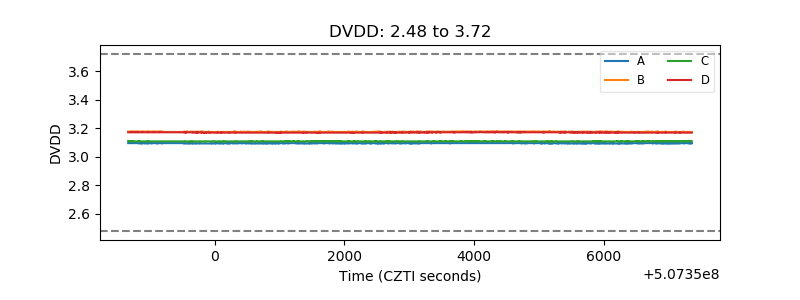 |
| Temperature 1 | 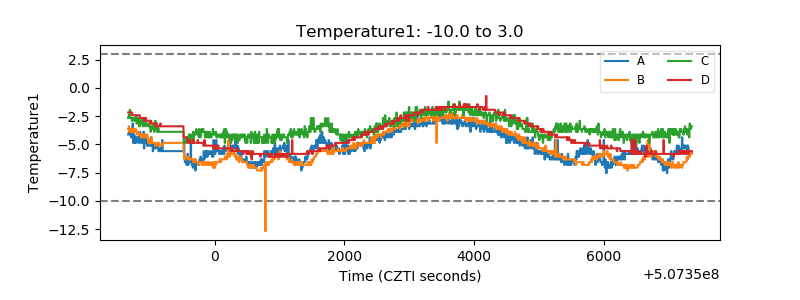 |
| Veto HV Monitor | 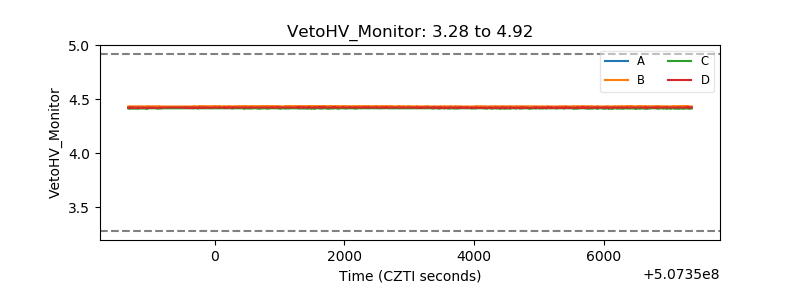 |
| Veto LLD | 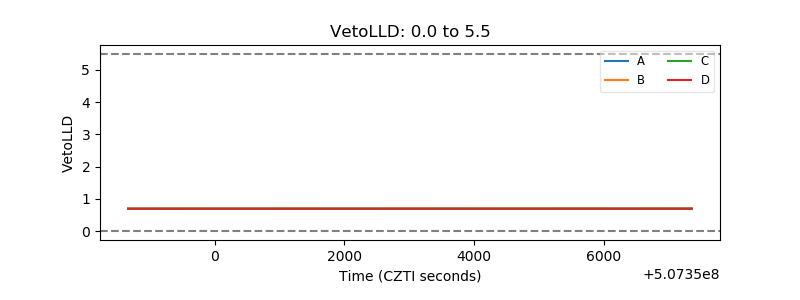 |
| Alpha Counter | 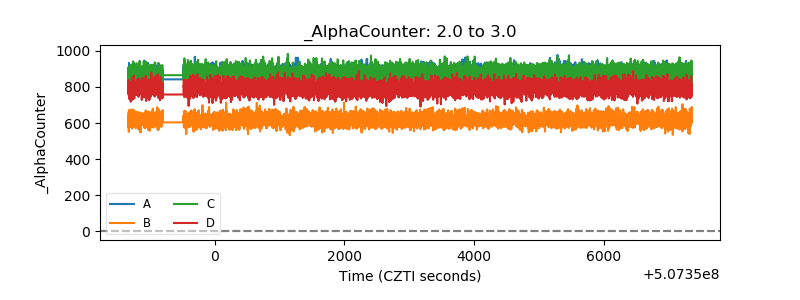 |
| _CPM_Rate | 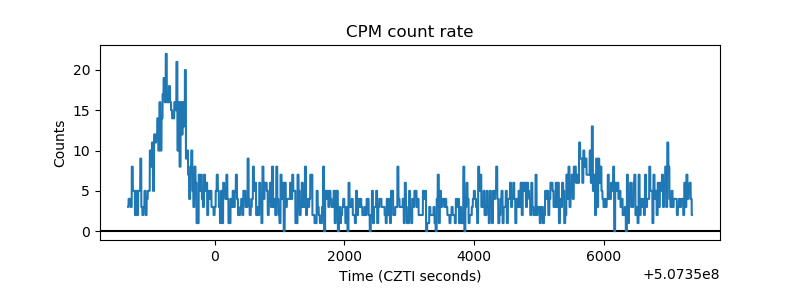 |
| CZT Counter | 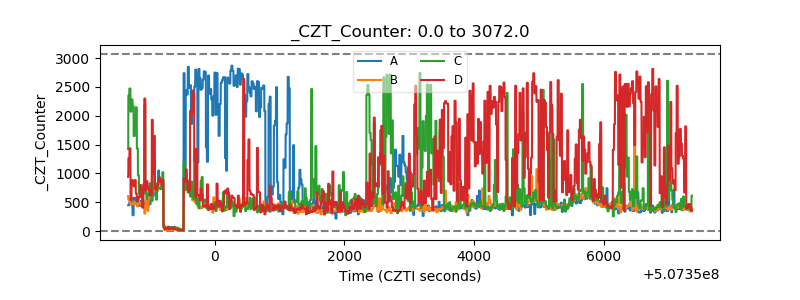 |
| +2.5 Volts monitor | 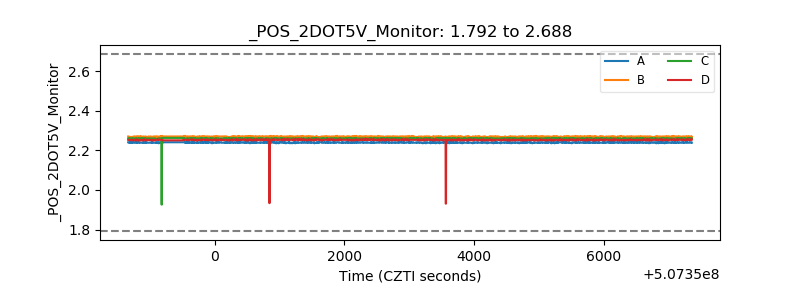 |
| +5 Volts monitor | 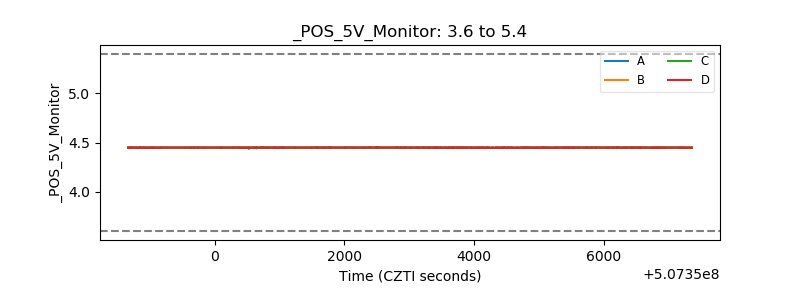 |
| _ROLL_ROT | 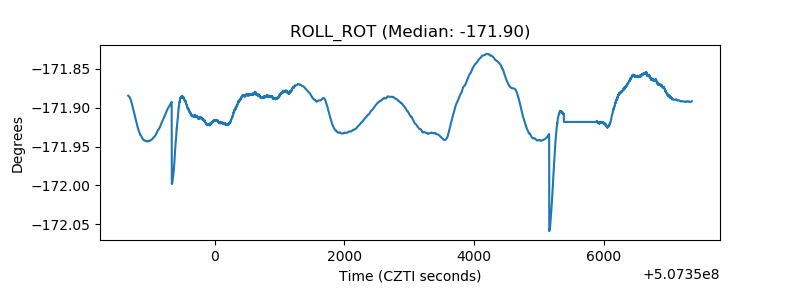 |
| _Roll_DEC | 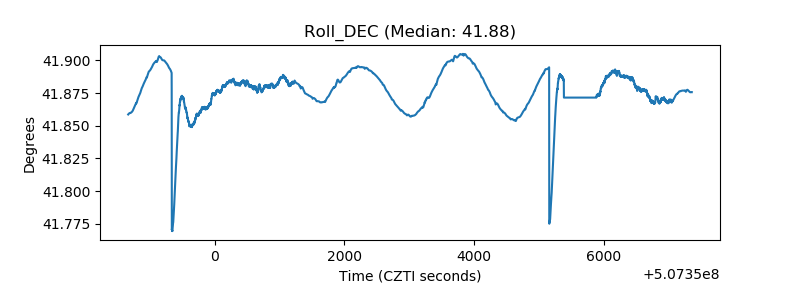 |
| _Roll_RA | 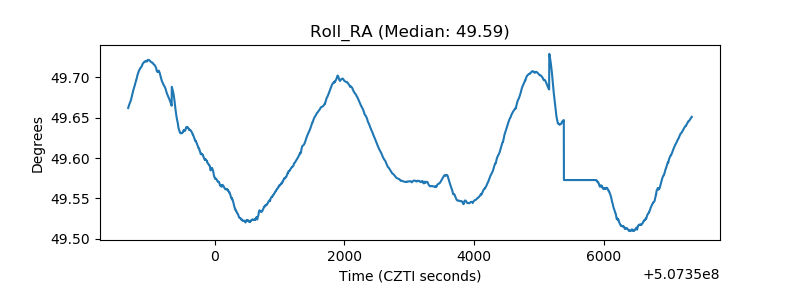 |
| Veto Counter | 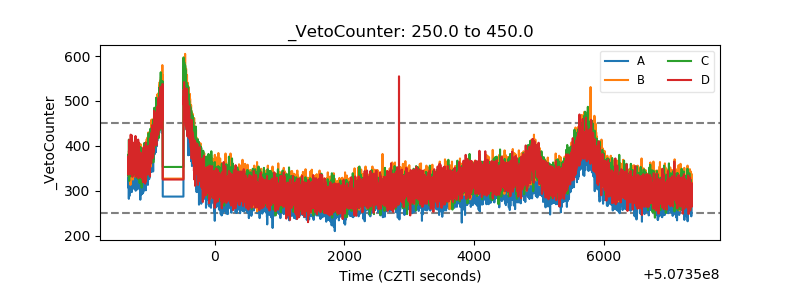 |