| Param | Original file | Final file |
|---|---|---|
| Filename | modeM0/AS1A14_030T02_9000006544_55931cztM0_level2.fits | modeM0/AS1A14_030T02_9000006544_55931cztM0_level2_quad_clean.evt |
| Size (bytes) | 520,983,360 | 109,690,560 |
| Size | 496.8 MB | 104.6 MB |
| Events in quadrant A | 3,738,566 | 707,806 |
| Events in quadrant B | 3,381,952 | 779,264 |
| Events in quadrant C | 4,674,552 | 677,687 |
| Events in quadrant D | 6,873,488 | 605,062 |
| Mode SS | |||
|---|---|---|---|
| Quadrant | BADHDUFLAG | Total packets | Discarded packets |
| A | 0 | 158 | 0 |
| B | 0 | 158 | 0 |
| C | 0 | 158 | 0 |
| D | 0 | 158 | 0 |
| Mode M0 | |||
|---|---|---|---|
| Quadrant | BADHDUFLAG | Total packets | Discarded packets |
| A | 0 | 17347 | 0 |
| B | 0 | 16320 | 0 |
| C | 0 | 19892 | 0 |
| D | 0 | 25896 | 0 |
| Quadrant | Total seconds | Saturated seconds | Saturation percentage |
|---|---|---|---|
| A | 7933 | 155 | 1.953864% |
| B | 7933 | 30 | 0.378167% |
| C | 7933 | 323 | 4.071600% |
| D | 7933 | 758 | 9.555023% |
Noise dominated data is calculated using 1-second bins in cleaned event files. If a bin has >2000 counts, and if more than 50% of those come from <1% of pixels, then it is considered to be noise-dominated and hence unusable.
| Quadrant | # 1 sec bins | Bins with >0 counts | Bins with >2000 counts | High rate bins dominated by noise | Noise dominated (total time) | Noise dominated (detector-on time) | Marked lightcurve |
|---|---|---|---|---|---|---|---|
| A | 7933 | 7933 | 147 | 147 | 1.85% | 1.85% | 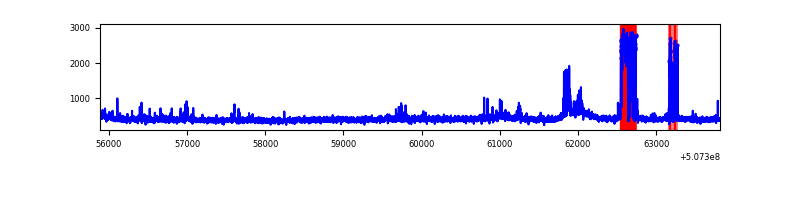 |
| B | 7932 | 7932 | 7 | 7 | 0.09% | 0.09% | 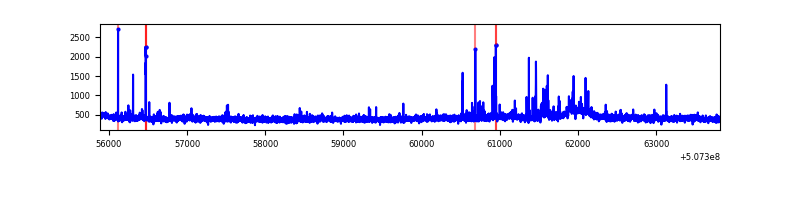 |
| C | 7932 | 7932 | 259 | 259 | 3.27% | 3.27% | 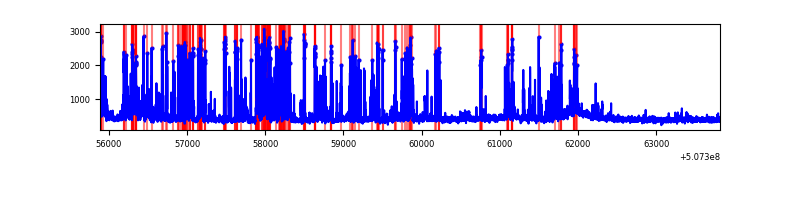 |
| D | 7933 | 7933 | 791 | 791 | 9.97% | 9.97% | 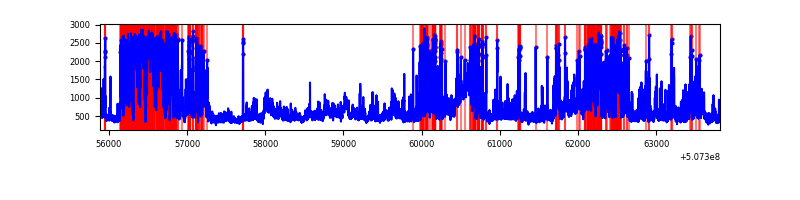 |
Top three noisy pixels from each quadrant. If the there are fewer than three noisy pixels in the level2.evt file, extra rows are filled as -1
| Pixel properties | Quadrant properties | ||||||
|---|---|---|---|---|---|---|---|
| Quadrant | DetID | PixID | Counts | Sigma | Mean | Median | Sigma |
| A | 4 | 249 | 482199 | 2404.74 | 808 | 786 | 200.2 |
| A | 7 | 64 | 37470 | 183.24 | 808 | 786 | 200.2 |
| A | 3 | 78 | 24410 | 118.01 | 808 | 786 | 200.2 |
| B | 2 | 249 | 81278 | 461.47 | 811 | 780 | 174.4 |
| B | 7 | 252 | 27317 | 152.13 | 811 | 780 | 174.4 |
| B | 0 | 199 | 22820 | 126.35 | 811 | 780 | 174.4 |
| C | 12 | 252 | 1122493 | 5226.92 | 787 | 781 | 214.6 |
| C | 15 | 199 | 296807 | 1379.41 | 787 | 781 | 214.6 |
| C | 6 | 223 | 103280 | 477.62 | 787 | 781 | 214.6 |
| D | 11 | 129 | 2577198 | 11915.22 | 761 | 727 | 216.2 |
| D | 7 | 129 | 511049 | 2360.05 | 761 | 727 | 216.2 |
| D | 2 | 62 | 433403 | 2000.97 | 761 | 727 | 216.2 |
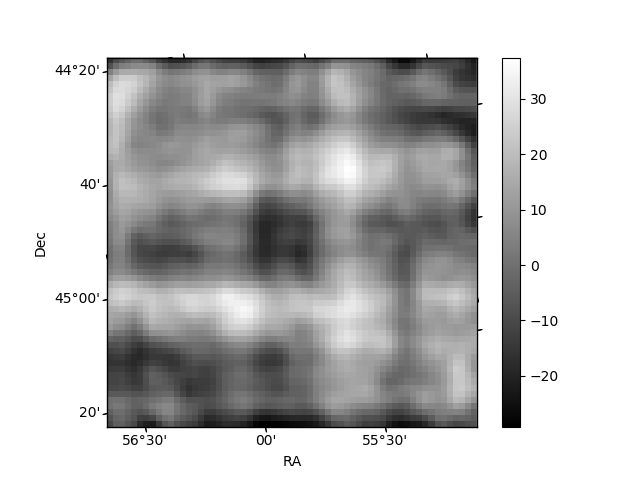
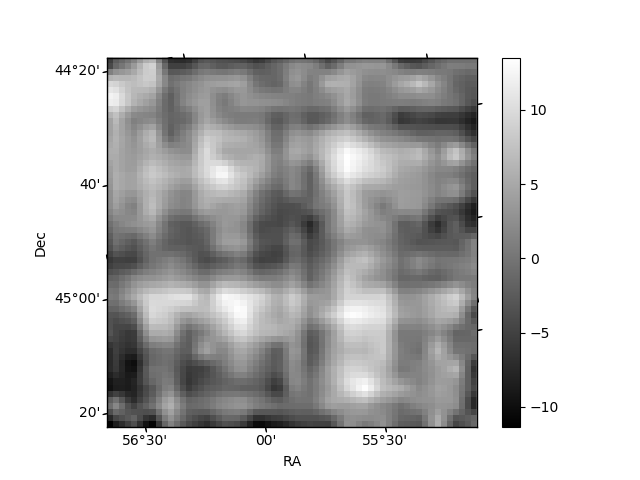
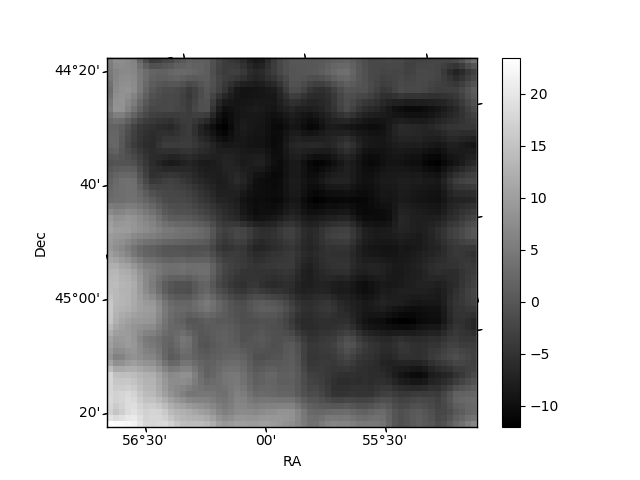
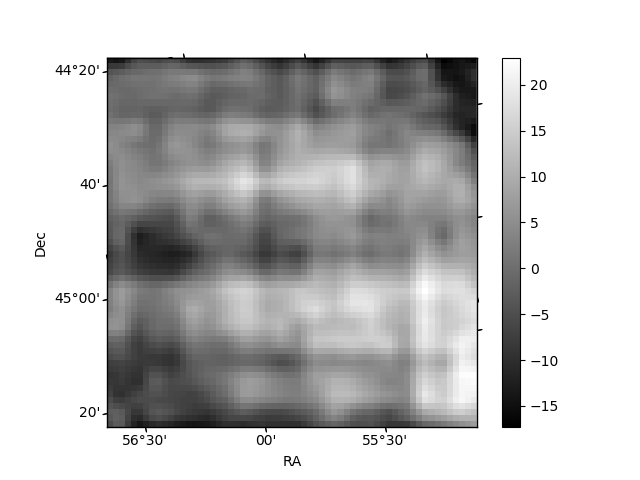
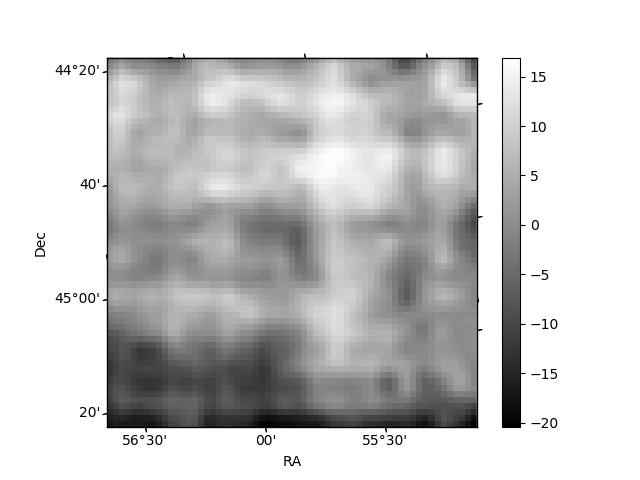
Histogram calculated using DETX and DETY for each event in the final _common_clean file
| Quadrant A | 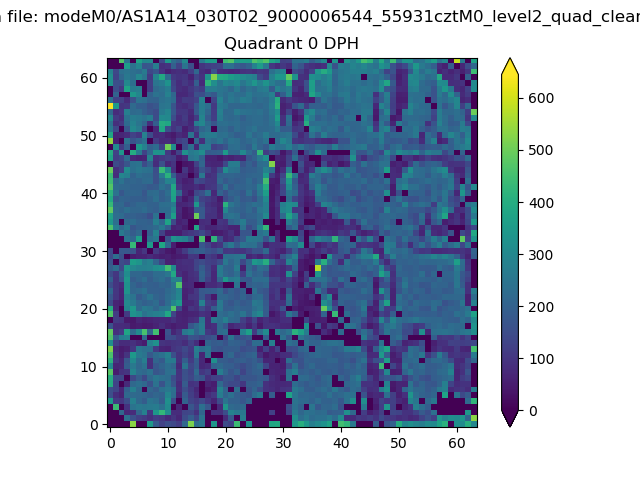 |
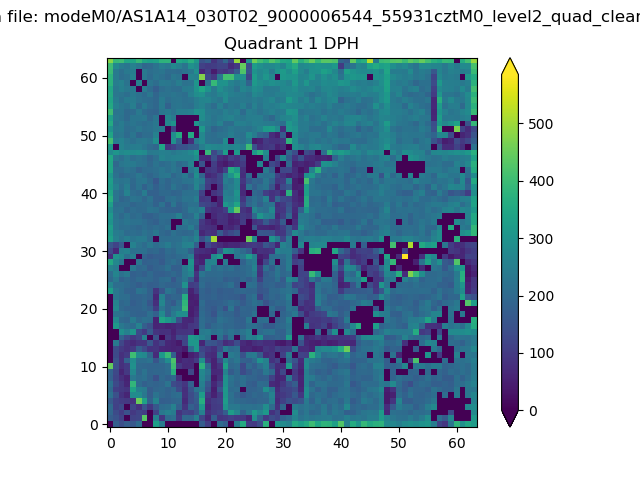 |
Quadrant B |
|---|---|---|---|
| Quadrant D | 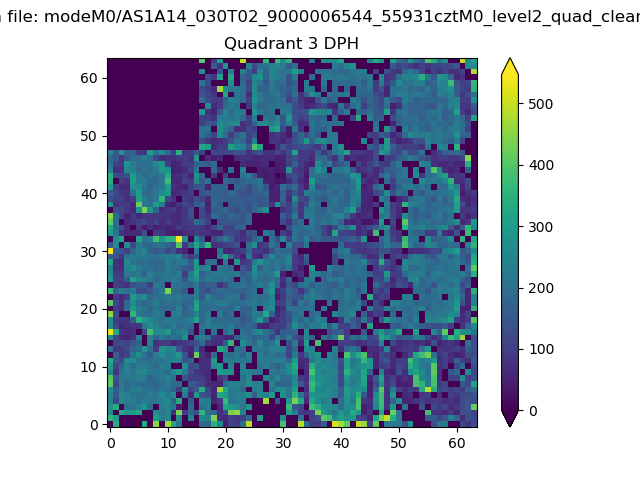 |
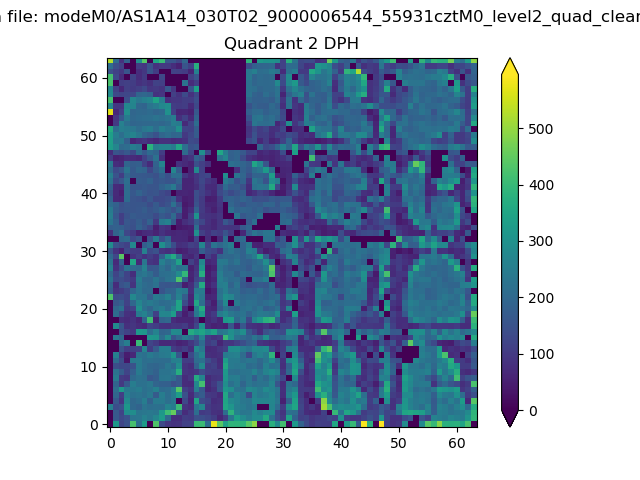 |
Quadrant C |
| Plot type | Count rate plots | Images |
|---|---|---|
| Comparison with Poisson distribution Blue bars denote a histogram of data divided into 1 sec bins. Red curve is a Poisson curve with rate = median count rate of data. |
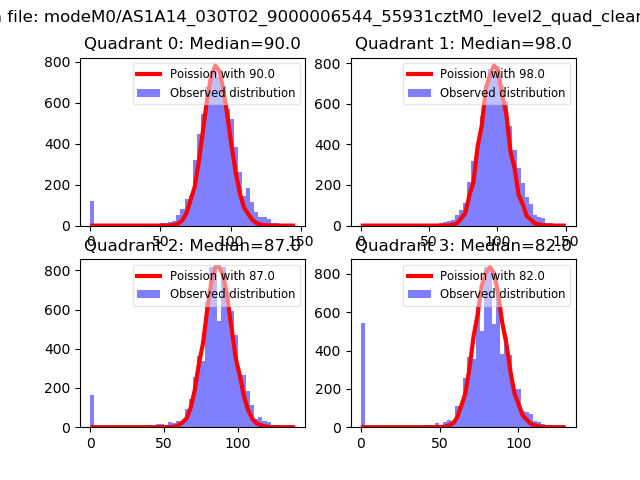 |
 |
| Quadrant-wise count rates Data is divided into 100 sec bins |
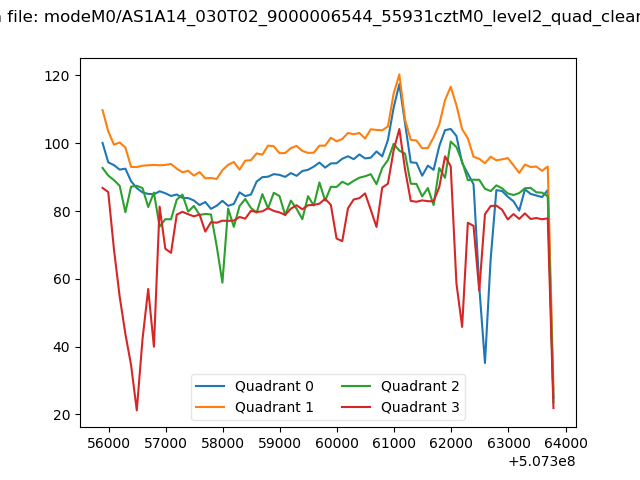 |
|
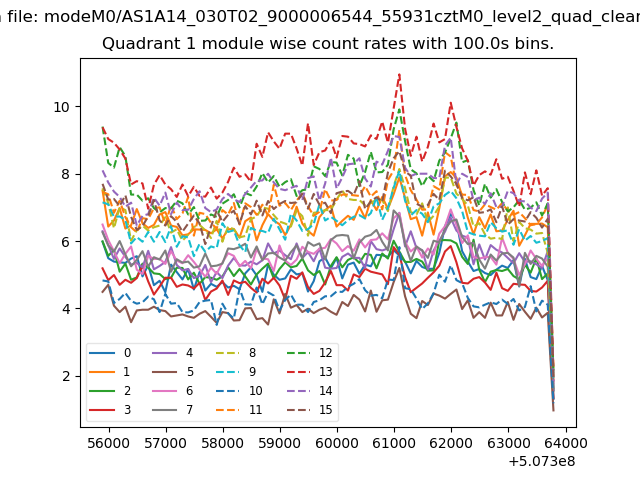
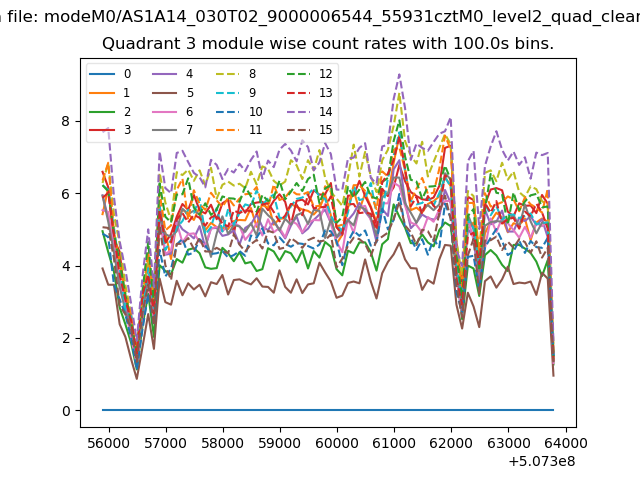
| Module-wise count rates for Quadrant A Data is divided into 100 sec bins |
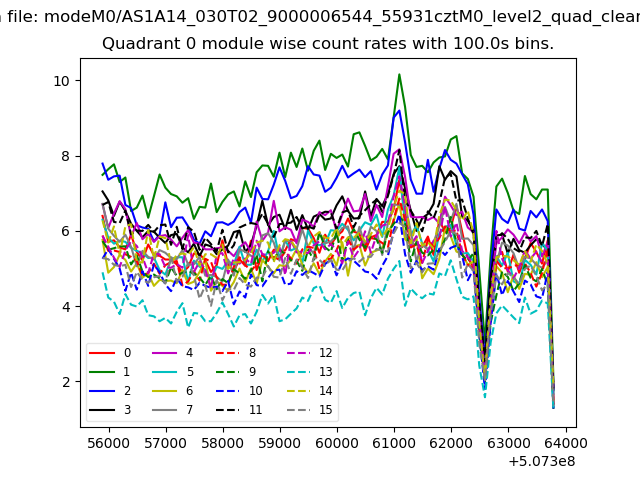 |
 |
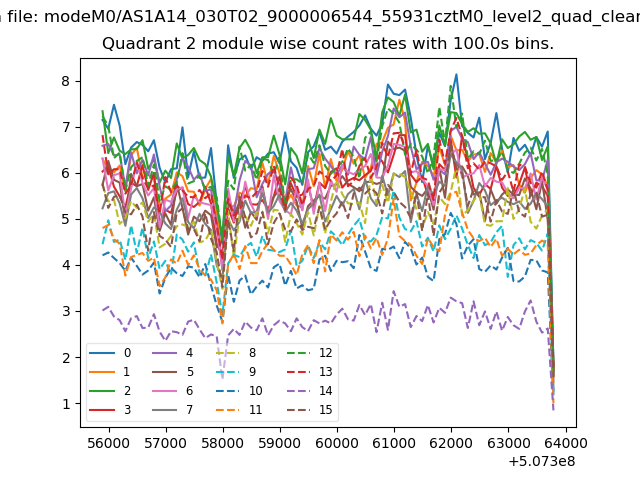
| Module-wise count rates for Quadrant B Data is divided into 100 sec bins |
 |
 |
| Module-wise count rates for Quadrant C Data is divided into 100 sec bins |
 |
 |
| Module-wise count rates for Quadrant D Data is divided into 100 sec bins |
 |
 |
| Parameter | Plot |
|---|---|
| CZT HV Monitor | 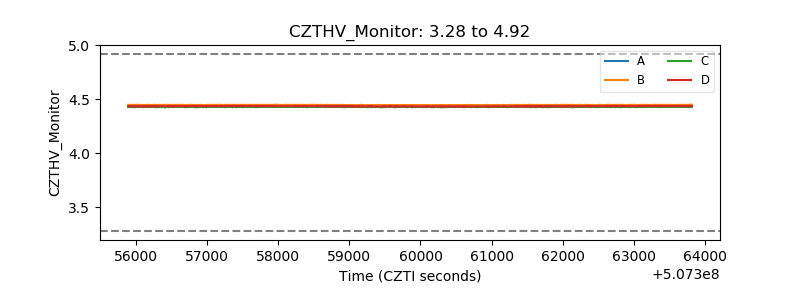 |
| D_VDD | 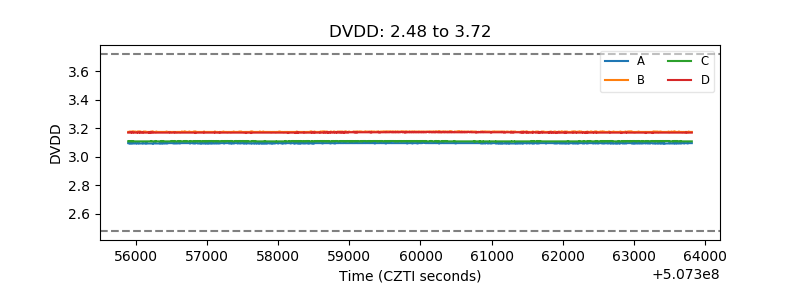 |
| Temperature 1 | 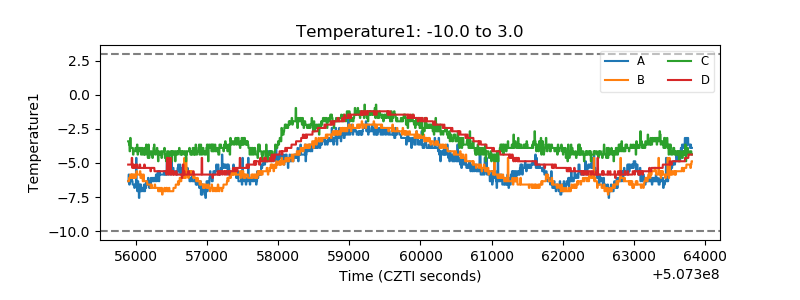 |
| Veto HV Monitor | 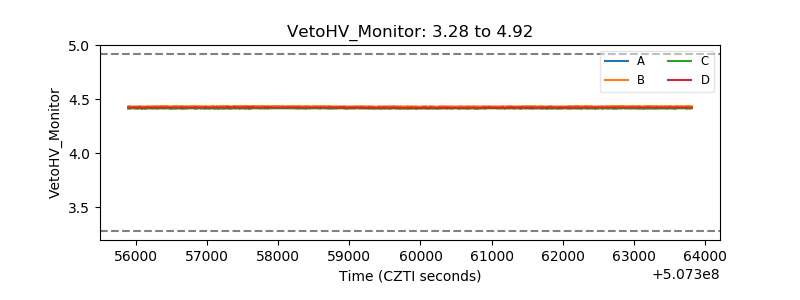 |
| Veto LLD | 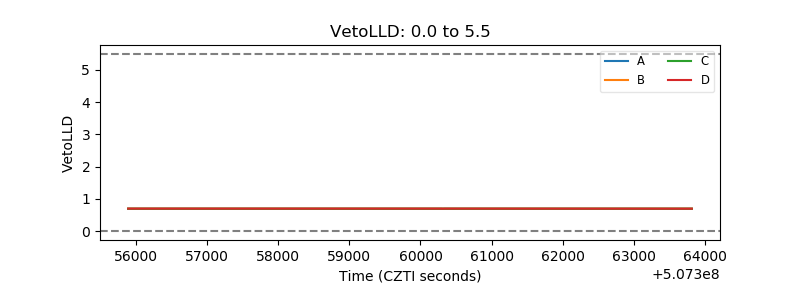 |
| Alpha Counter | 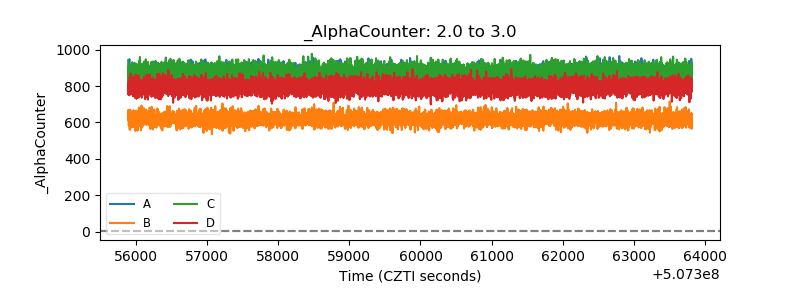 |
| _CPM_Rate | 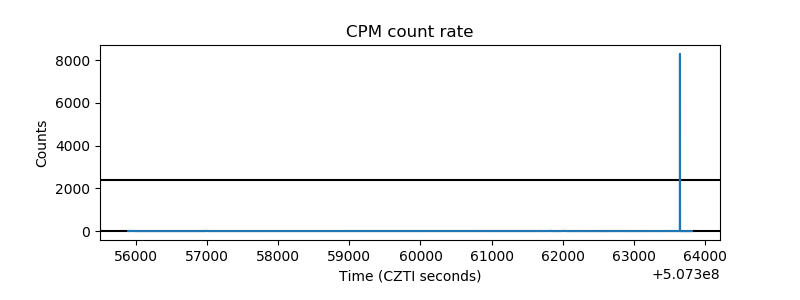 |
| CZT Counter | 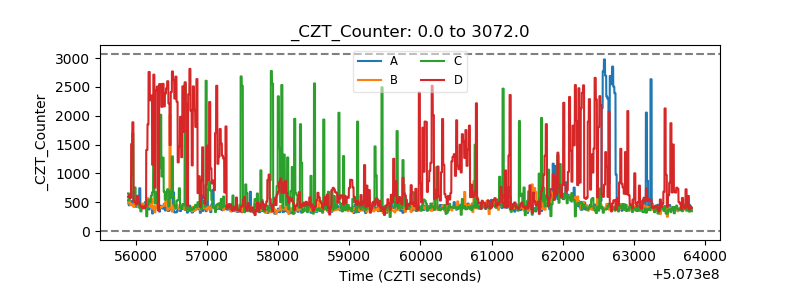 |
| +2.5 Volts monitor | 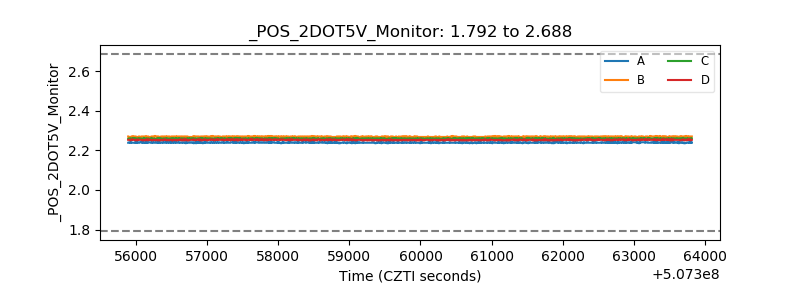 |
| +5 Volts monitor | 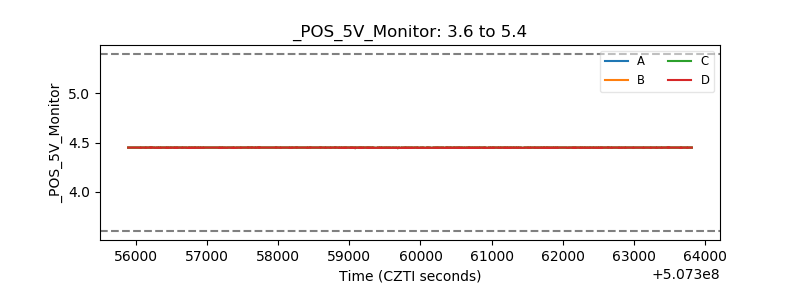 |
| _ROLL_ROT | 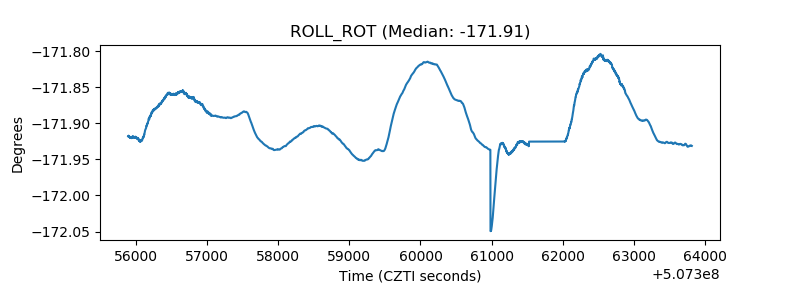 |
| _Roll_DEC | 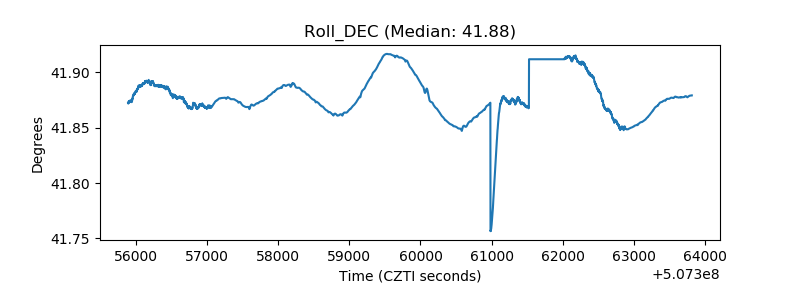 |
| _Roll_RA | 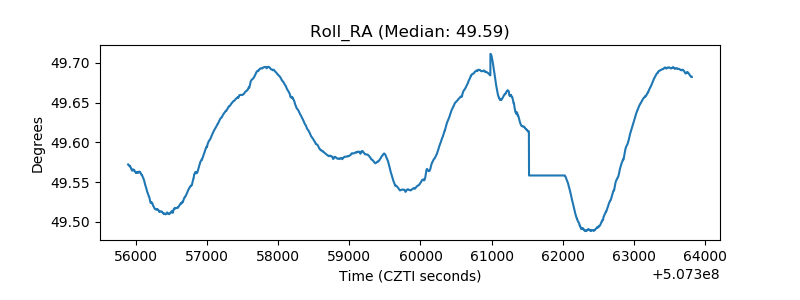 |
| Veto Counter | 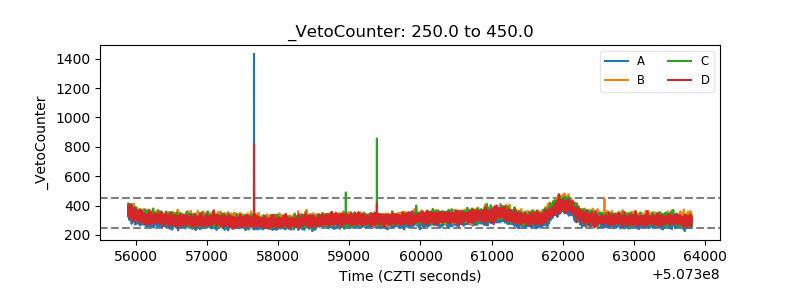 |