| Param | Original file | Final file |
|---|---|---|
| Filename | modeM0/AS1A14_030T02_9000006544_55937cztM0_level2.fits | modeM0/AS1A14_030T02_9000006544_55937cztM0_level2_quad_clean.evt |
| Size (bytes) | 422,809,920 | 100,267,200 |
| Size | 403.2 MB | 95.6 MB |
| Events in quadrant A | 3,216,220 | 672,149 |
| Events in quadrant B | 3,485,578 | 700,447 |
| Events in quadrant C | 3,466,708 | 621,066 |
| Events in quadrant D | 4,972,788 | 585,331 |
| Mode SS | |||
|---|---|---|---|
| Quadrant | BADHDUFLAG | Total packets | Discarded packets |
| A | 0 | 134 | 0 |
| B | 0 | 134 | 0 |
| C | 0 | 134 | 0 |
| D | 0 | 134 | 0 |
| Mode M9 | |||
|---|---|---|---|
| Quadrant | BADHDUFLAG | Total packets | Discarded packets |
| A | 0 | 9 | 0 |
| B | 0 | 9 | 0 |
| C | 0 | 9 | 0 |
| D | 0 | 9 | 0 |
| Mode M0 | |||
|---|---|---|---|
| Quadrant | BADHDUFLAG | Total packets | Discarded packets |
| A | 0 | 14370 | 1 |
| B | 0 | 15374 | 1 |
| C | 0 | 15299 | 1 |
| D | 0 | 19280 | 1 |
| Quadrant | Total seconds | Saturated seconds | Saturation percentage |
|---|---|---|---|
| A | 6554 | 108 | 1.647849% |
| B | 6555 | 211 | 3.218917% |
| C | 6555 | 131 | 1.998474% |
| D | 6555 | 285 | 4.347826% |
Noise dominated data is calculated using 1-second bins in cleaned event files. If a bin has >2000 counts, and if more than 50% of those come from <1% of pixels, then it is considered to be noise-dominated and hence unusable.
| Quadrant | # 1 sec bins | Bins with >0 counts | Bins with >2000 counts | High rate bins dominated by noise | Noise dominated (total time) | Noise dominated (detector-on time) | Marked lightcurve |
|---|---|---|---|---|---|---|---|
| A | 7464 | 6555 | 14 | 14 | 0.19% | 0.21% | 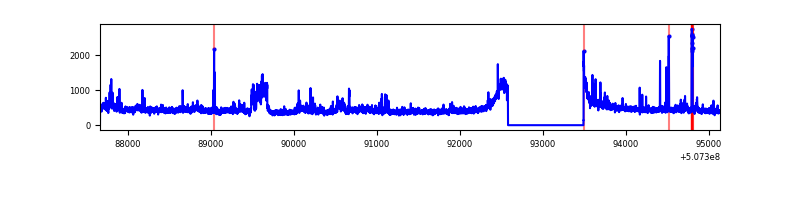 |
| B | 7464 | 6555 | 100 | 100 | 1.34% | 1.53% | 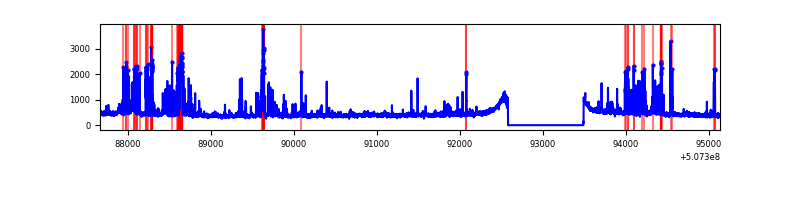 |
| C | 7464 | 6555 | 54 | 54 | 0.72% | 0.82% | 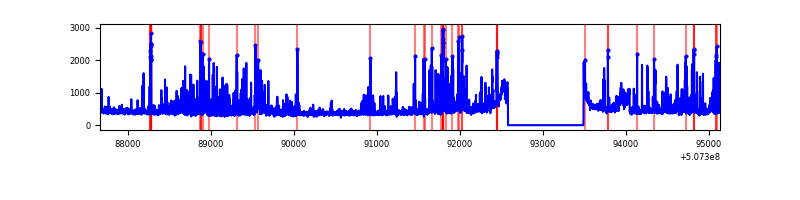 |
| D | 7464 | 6555 | 212 | 212 | 2.84% | 3.23% | 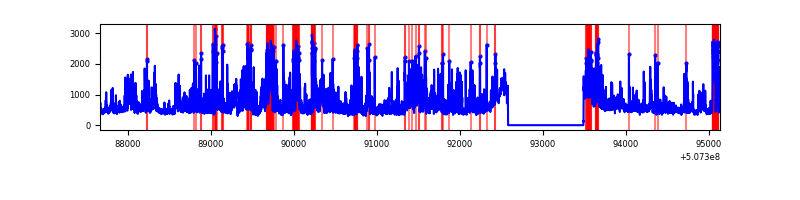 |
Top three noisy pixels from each quadrant. If the there are fewer than three noisy pixels in the level2.evt file, extra rows are filled as -1
| Pixel properties | Quadrant properties | ||||||
|---|---|---|---|---|---|---|---|
| Quadrant | DetID | PixID | Counts | Sigma | Mean | Median | Sigma |
| A | 12 | 115 | 297797 | 1642.24 | 711 | 691 | 180.9 |
| A | 7 | 64 | 74768 | 409.46 | 711 | 691 | 180.9 |
| A | 3 | 14 | 42668 | 232.02 | 711 | 691 | 180.9 |
| B | 5 | 185 | 675568 | 4548.63 | 688 | 666 | 148.4 |
| B | 10 | 247 | 23590 | 154.5 | 688 | 666 | 148.4 |
| B | 12 | 111 | 17394 | 112.74 | 688 | 666 | 148.4 |
| C | 14 | 80 | 435294 | 2303.39 | 677 | 669 | 188.7 |
| C | 12 | 252 | 184364 | 973.53 | 677 | 669 | 188.7 |
| C | 6 | 223 | 94987 | 499.86 | 677 | 669 | 188.7 |
| D | 11 | 129 | 1050646 | 5383.73 | 680 | 649 | 195.0 |
| D | 6 | 42 | 512159 | 2622.71 | 680 | 649 | 195.0 |
| D | 15 | 234 | 217434 | 1111.54 | 680 | 649 | 195.0 |
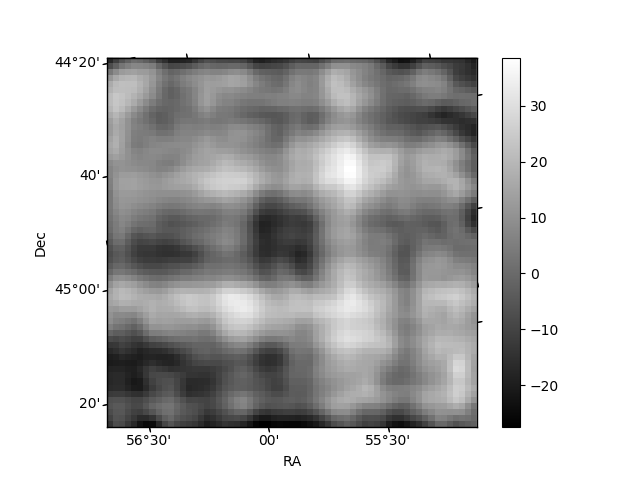
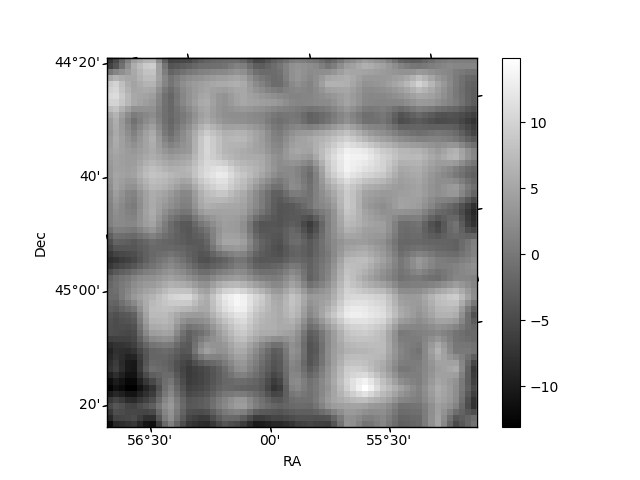
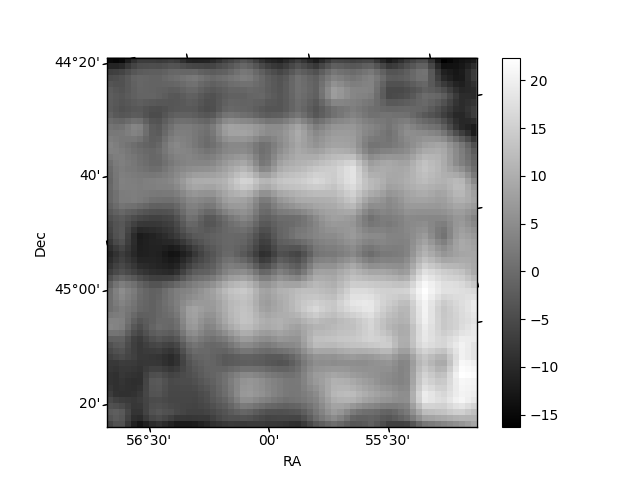
Histogram calculated using DETX and DETY for each event in the final _common_clean file
| Quadrant A | 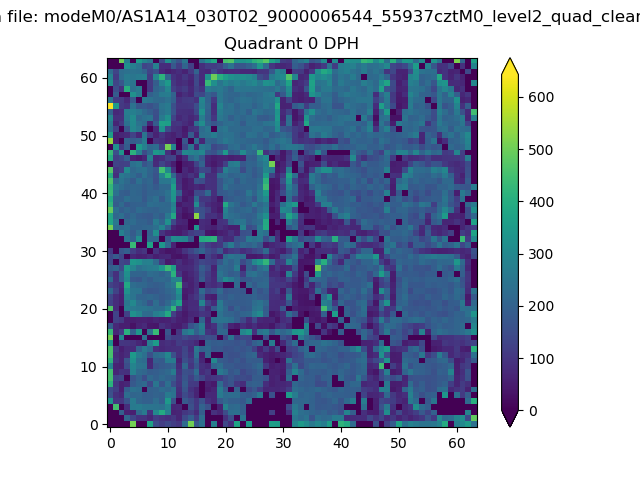 |
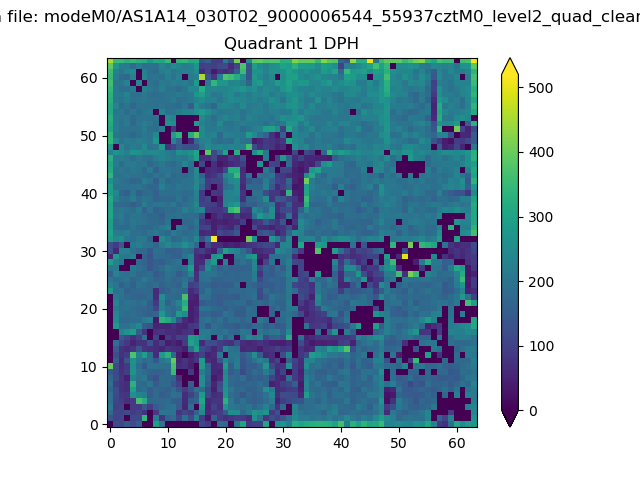 |
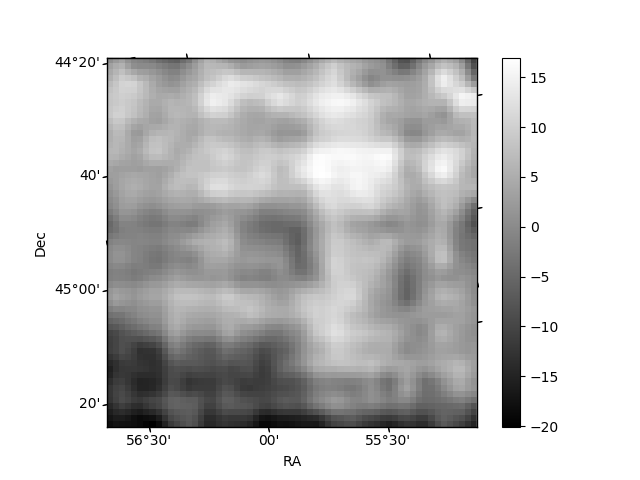
Quadrant B |
|---|---|---|---|
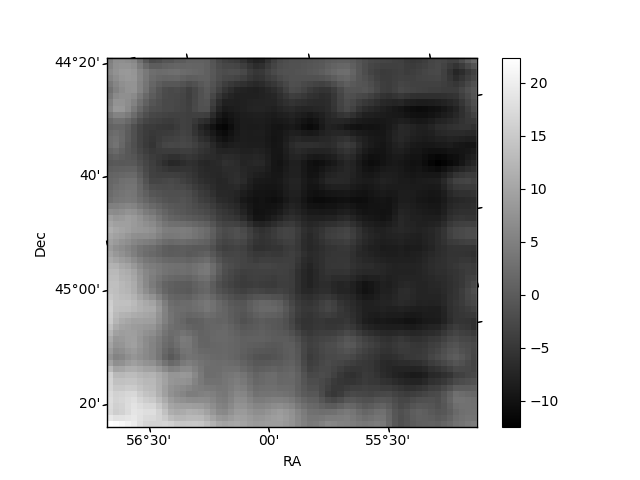
| Quadrant D | 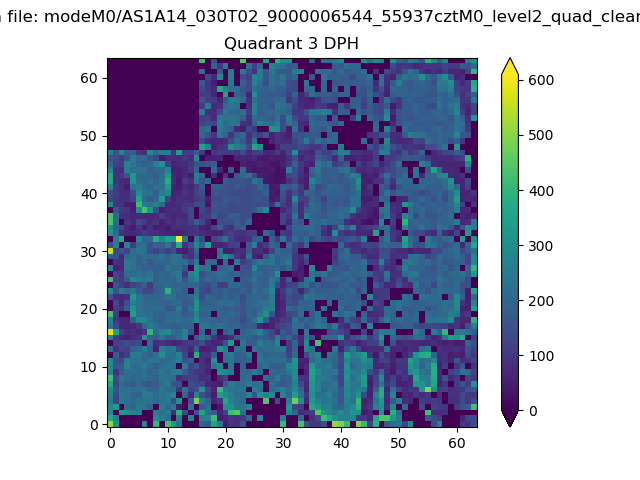 |
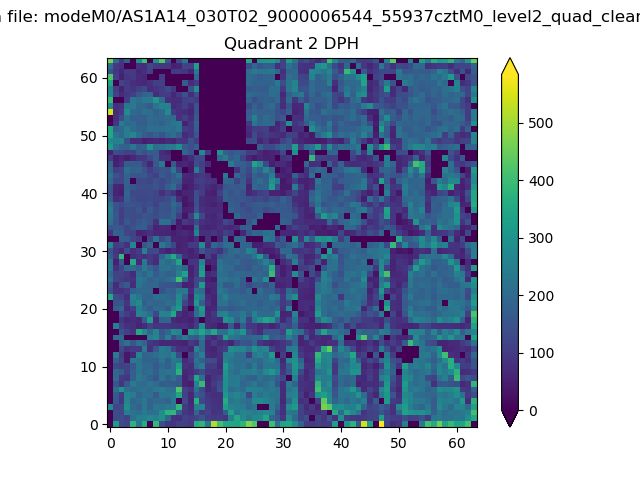 |
Quadrant C |
| Plot type | Count rate plots | Images |
|---|---|---|
| Comparison with Poisson distribution Blue bars denote a histogram of data divided into 1 sec bins. Red curve is a Poisson curve with rate = median count rate of data. |
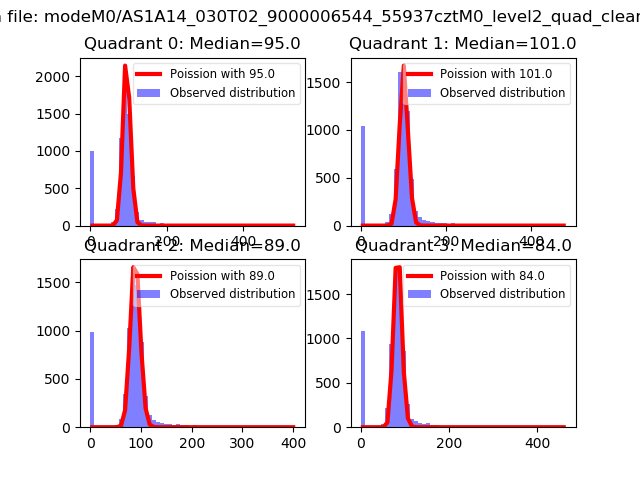 |
 |
| Quadrant-wise count rates Data is divided into 100 sec bins |
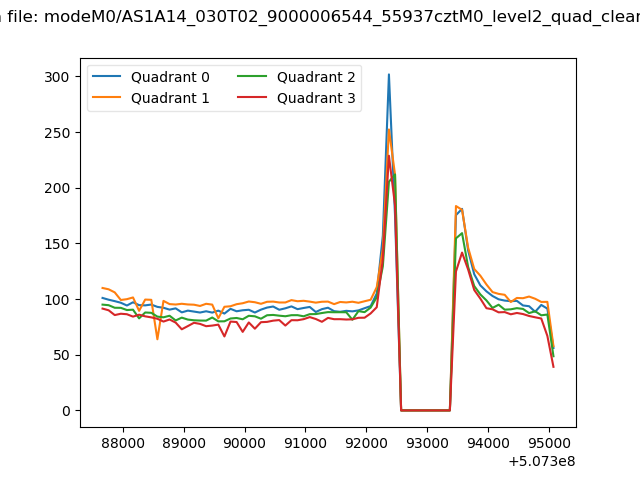 |
|
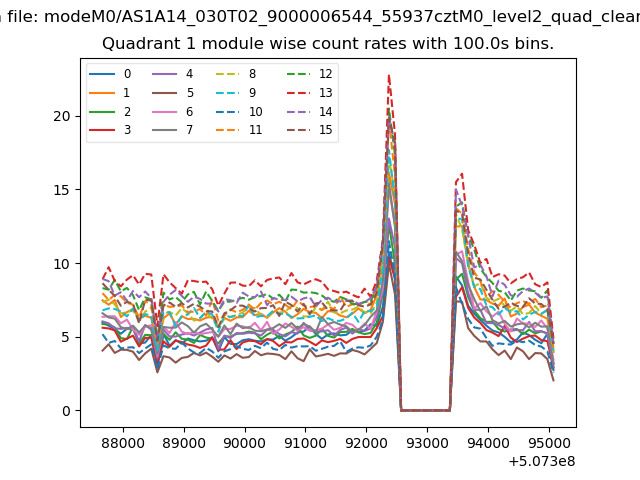
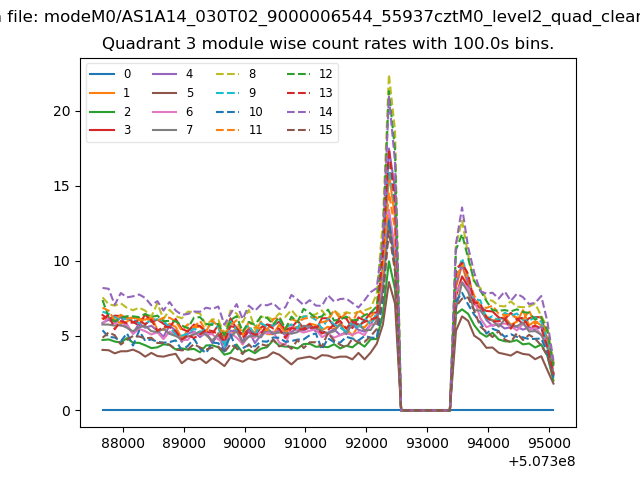
| Module-wise count rates for Quadrant A Data is divided into 100 sec bins |
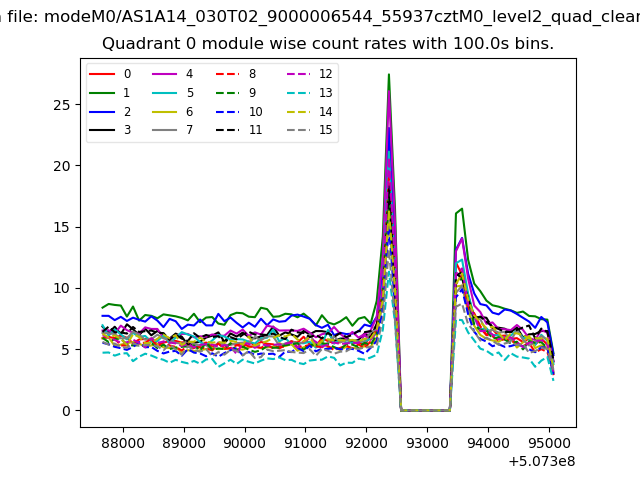 |
 |
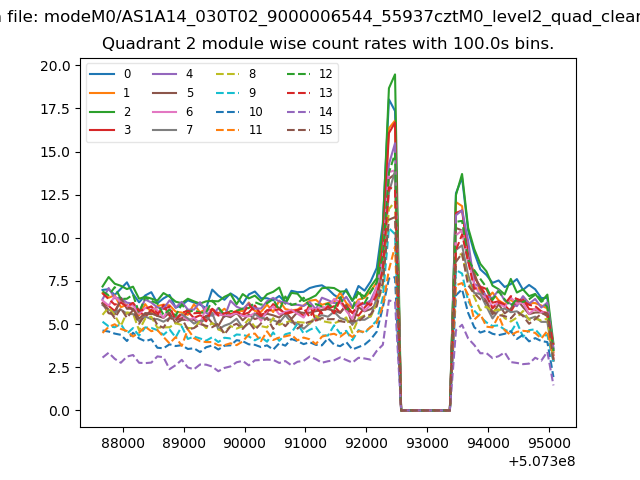
| Module-wise count rates for Quadrant B Data is divided into 100 sec bins |
 |
 |
| Module-wise count rates for Quadrant C Data is divided into 100 sec bins |
 |
 |
| Module-wise count rates for Quadrant D Data is divided into 100 sec bins |
 |
 |
| Parameter | Plot |
|---|---|
| CZT HV Monitor | 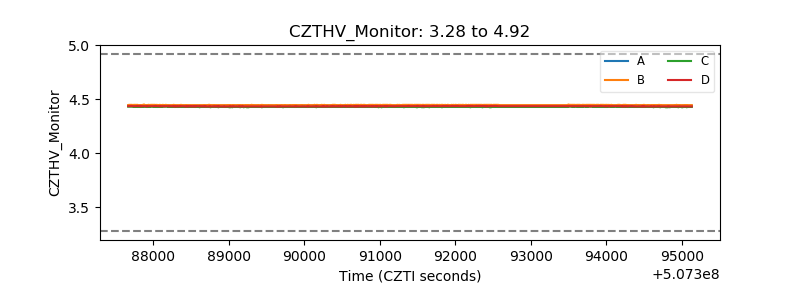 |
| D_VDD | 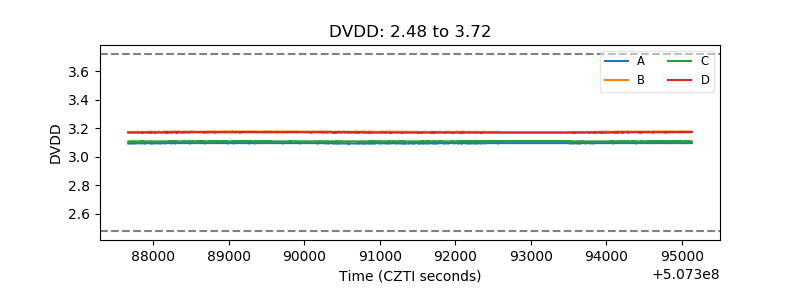 |
| Temperature 1 | 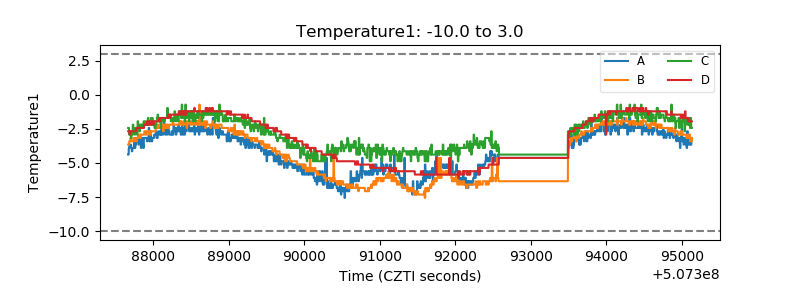 |
| Veto HV Monitor |  |
| Veto LLD | 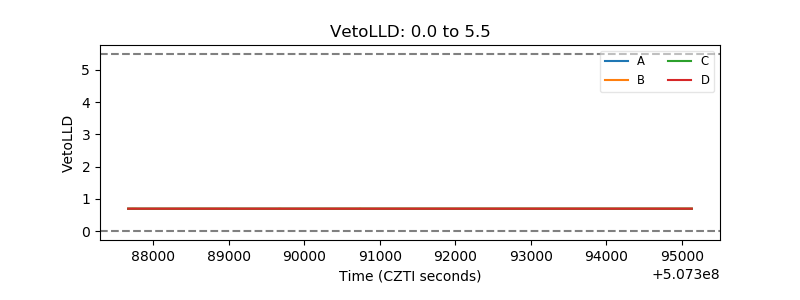 |
| Alpha Counter | 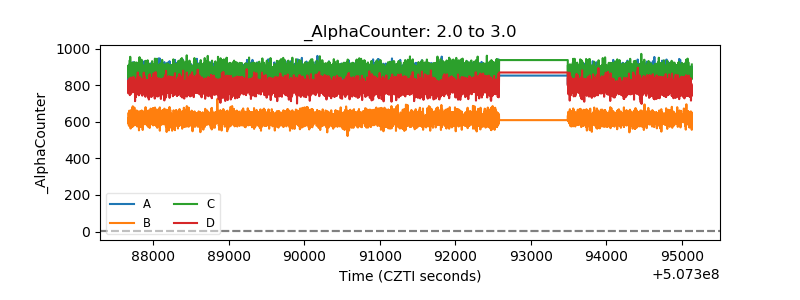 |
| _CPM_Rate | 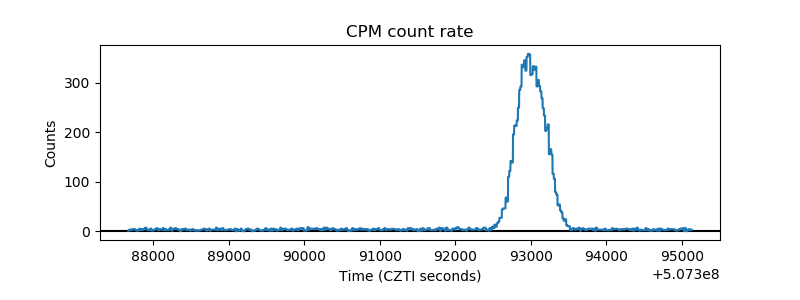 |
| CZT Counter | 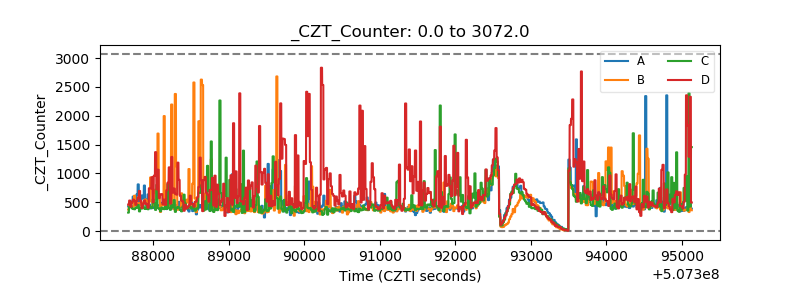 |
| +2.5 Volts monitor | 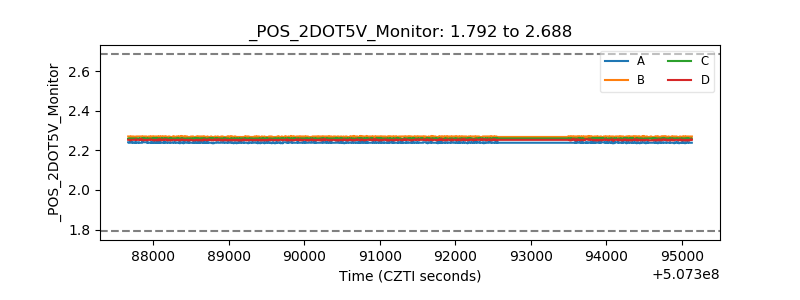 |
| +5 Volts monitor |  |
| _ROLL_ROT | 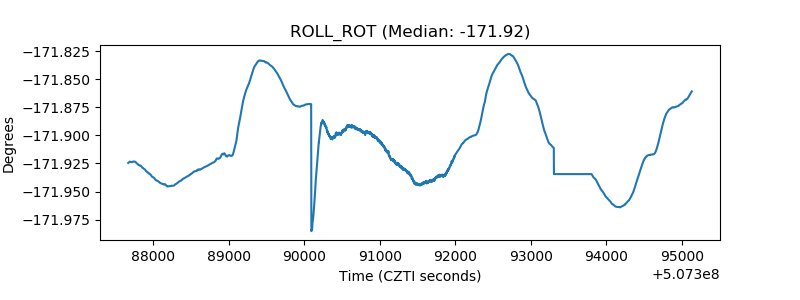 |
| _Roll_DEC | 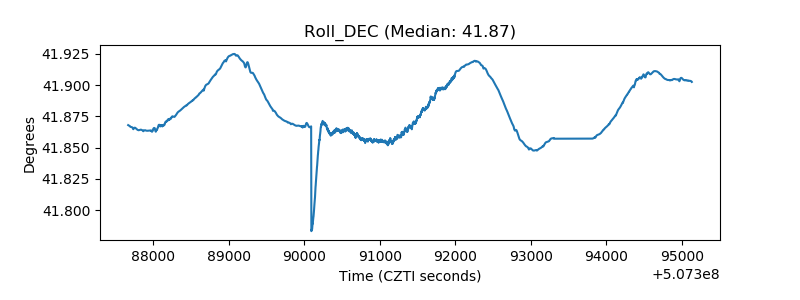 |
| _Roll_RA | 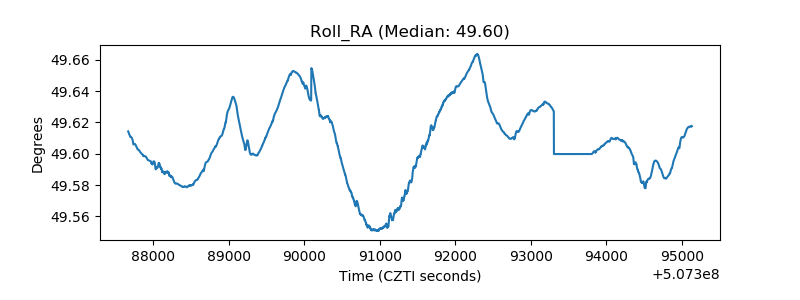 |
| Veto Counter | 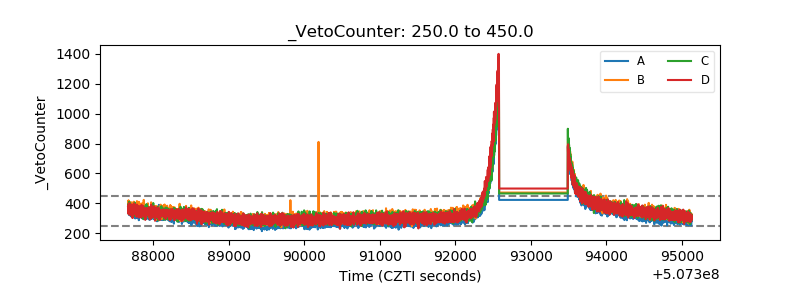 |