| Param | Original file | Final file |
|---|---|---|
| Filename | modeM0/AS1A14_030T02_9000006544_55939cztM0_level2.fits | modeM0/AS1A14_030T02_9000006544_55939cztM0_level2_quad_clean.evt |
| Size (bytes) | 396,786,240 | 88,179,840 |
| Size | 378.4 MB | 84.1 MB |
| Events in quadrant A | 3,890,243 | 574,518 |
| Events in quadrant B | 2,999,448 | 622,628 |
| Events in quadrant C | 3,454,936 | 532,616 |
| Events in quadrant D | 3,875,978 | 521,257 |
| Mode SS | |||
|---|---|---|---|
| Quadrant | BADHDUFLAG | Total packets | Discarded packets |
| A | 0 | 122 | 0 |
| B | 0 | 122 | 0 |
| C | 0 | 122 | 0 |
| D | 0 | 122 | 0 |
| Mode M9 | |||
|---|---|---|---|
| Quadrant | BADHDUFLAG | Total packets | Discarded packets |
| A | 0 | 10 | 0 |
| B | 0 | 10 | 0 |
| C | 0 | 10 | 0 |
| D | 0 | 10 | 0 |
| Mode M0 | |||
|---|---|---|---|
| Quadrant | BADHDUFLAG | Total packets | Discarded packets |
| A | 0 | 15758 | 1 |
| B | 0 | 13490 | 1 |
| C | 0 | 14625 | 1 |
| D | 0 | 15715 | 1 |
| Quadrant | Total seconds | Saturated seconds | Saturation percentage |
|---|---|---|---|
| A | 6000 | 213 | 3.550000% |
| B | 6000 | 119 | 1.983333% |
| C | 6001 | 352 | 5.865689% |
| D | 6001 | 185 | 3.082820% |
Noise dominated data is calculated using 1-second bins in cleaned event files. If a bin has >2000 counts, and if more than 50% of those come from <1% of pixels, then it is considered to be noise-dominated and hence unusable.
| Quadrant | # 1 sec bins | Bins with >0 counts | Bins with >2000 counts | High rate bins dominated by noise | Noise dominated (total time) | Noise dominated (detector-on time) | Marked lightcurve |
|---|---|---|---|---|---|---|---|
| A | 7055 | 6001 | 169 | 169 | 2.40% | 2.82% | 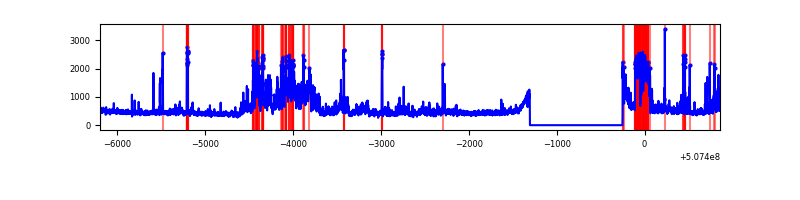 |
| B | 7055 | 6001 | 53 | 53 | 0.75% | 0.88% | 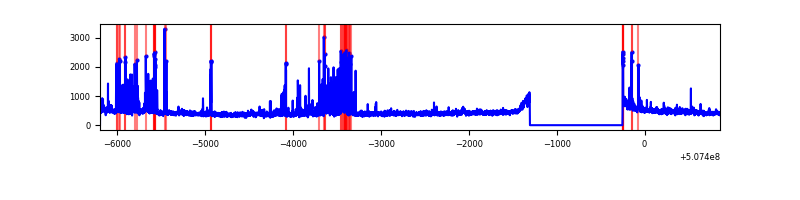 |
| C | 7056 | 6002 | 106 | 106 | 1.50% | 1.77% | 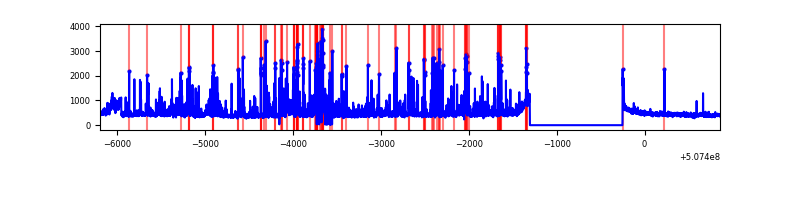 |
| D | 7056 | 6002 | 188 | 188 | 2.66% | 3.13% | 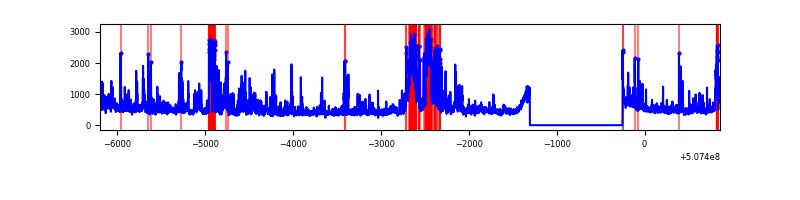 |
Top three noisy pixels from each quadrant. If the there are fewer than three noisy pixels in the level2.evt file, extra rows are filled as -1
| Pixel properties | Quadrant properties | ||||||
|---|---|---|---|---|---|---|---|
| Quadrant | DetID | PixID | Counts | Sigma | Mean | Median | Sigma |
| A | 12 | 115 | 1195442 | 7515.75 | 632 | 615 | 159.0 |
| A | 3 | 14 | 140646 | 880.83 | 632 | 615 | 159.0 |
| A | 0 | 8 | 75125 | 468.69 | 632 | 615 | 159.0 |
| B | 5 | 185 | 441626 | 3317.79 | 622 | 601 | 132.9 |
| B | 0 | 229 | 22161 | 162.19 | 622 | 601 | 132.9 |
| B | 7 | 252 | 18349 | 133.52 | 622 | 601 | 132.9 |
| C | 12 | 252 | 656804 | 3997.12 | 593 | 586 | 164.2 |
| C | 14 | 80 | 204115 | 1239.73 | 593 | 586 | 164.2 |
| C | 5 | 80 | 82896 | 501.36 | 593 | 586 | 164.2 |
| D | 6 | 42 | 522030 | 2988.4 | 615 | 589 | 174.5 |
| D | 11 | 129 | 439908 | 2517.76 | 615 | 589 | 174.5 |
| D | 12 | 16 | 167283 | 955.33 | 615 | 589 | 174.5 |
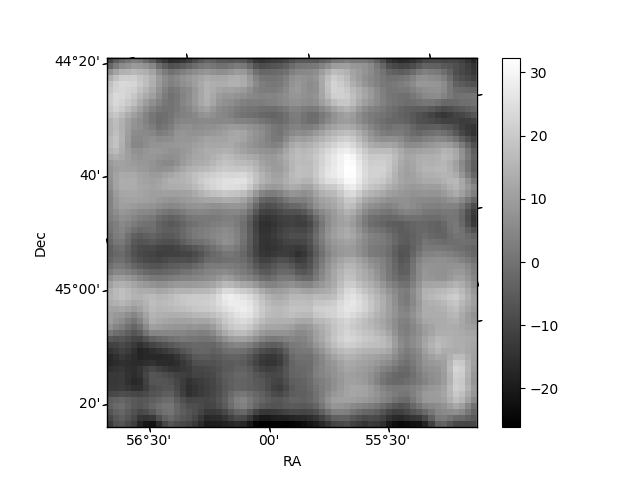
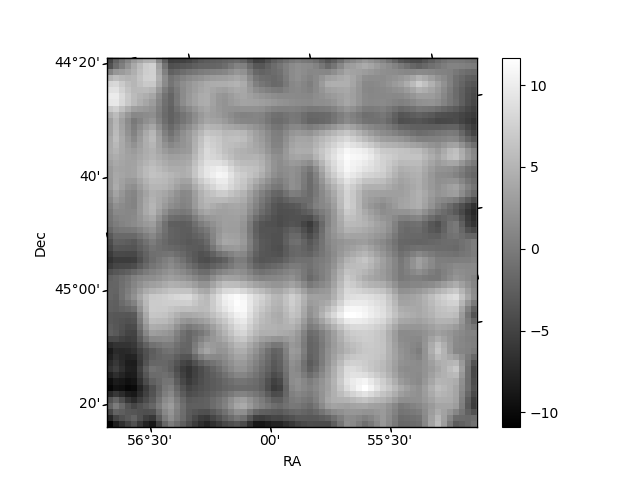
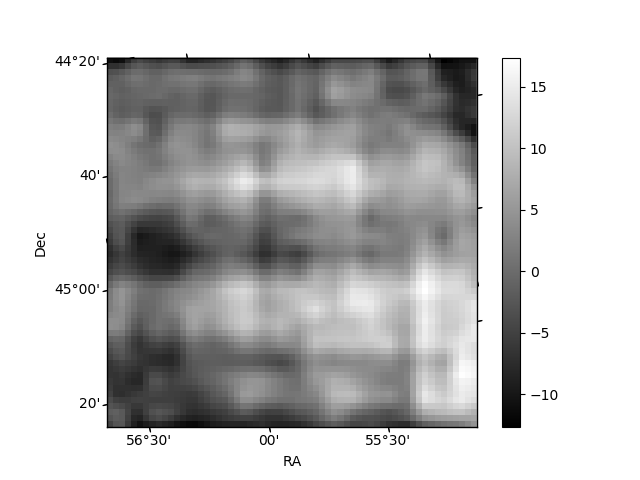
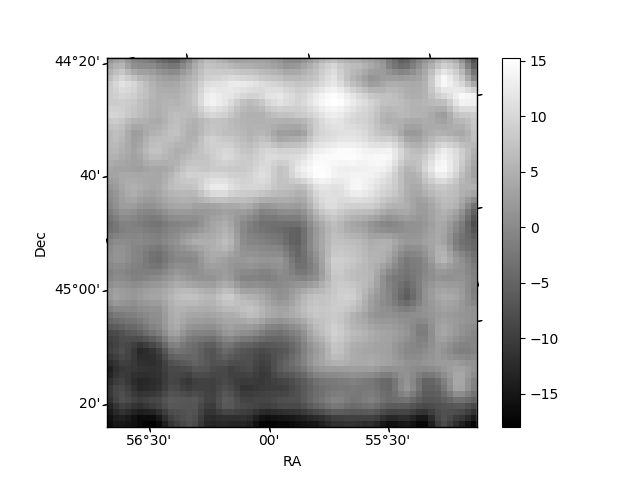
Histogram calculated using DETX and DETY for each event in the final _common_clean file
| Quadrant A | 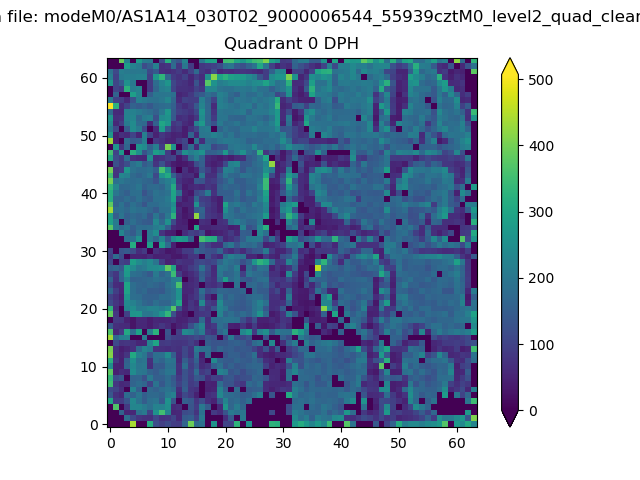 |
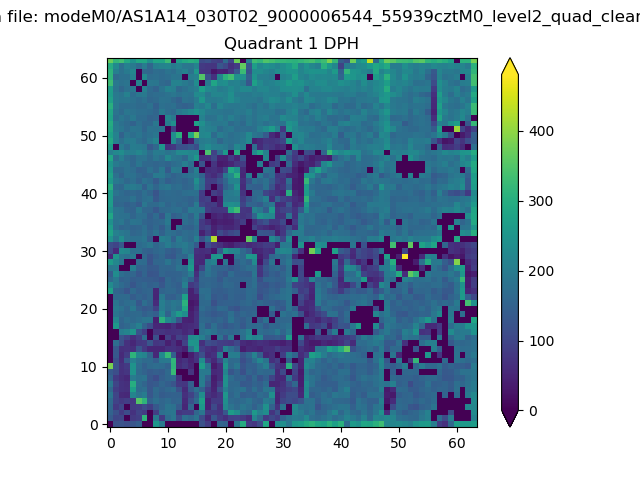 |
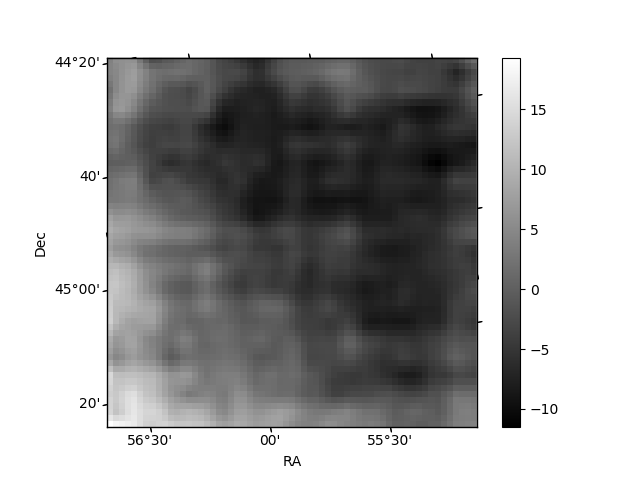
Quadrant B |
|---|---|---|---|
| Quadrant D | 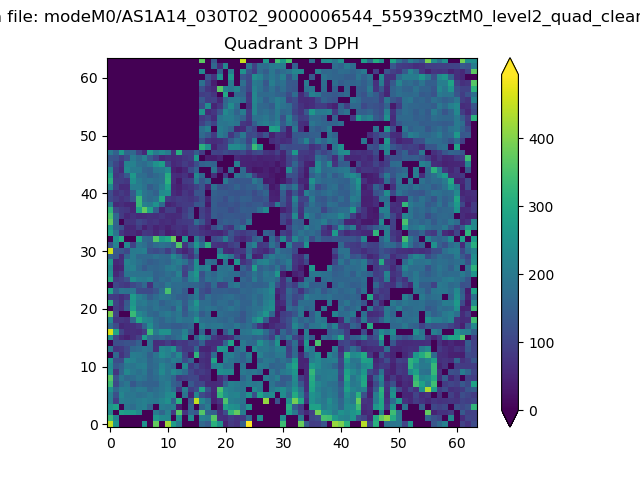 |
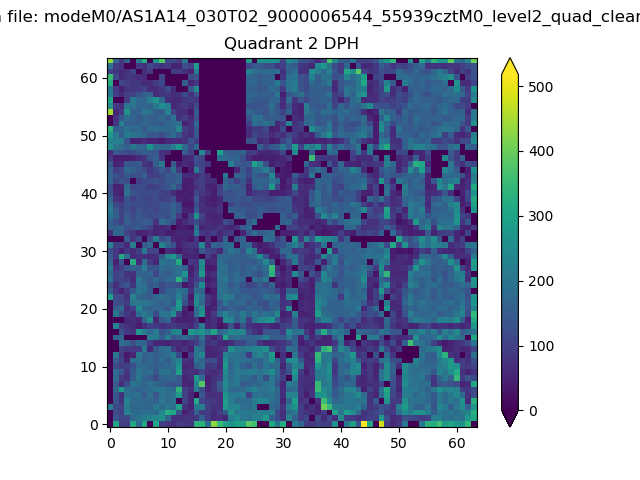 |
Quadrant C |
| Plot type | Count rate plots | Images |
|---|---|---|
| Comparison with Poisson distribution Blue bars denote a histogram of data divided into 1 sec bins. Red curve is a Poisson curve with rate = median count rate of data. |
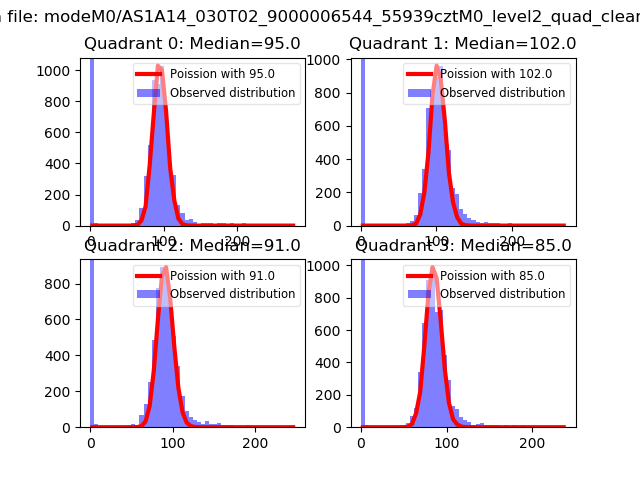 |
 |
| Quadrant-wise count rates Data is divided into 100 sec bins |
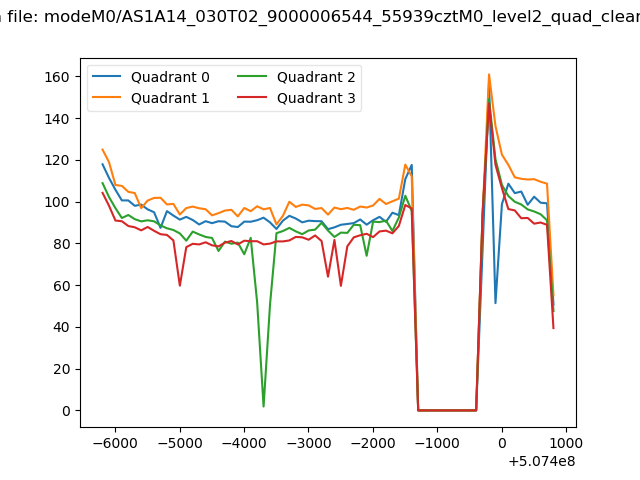 |
|
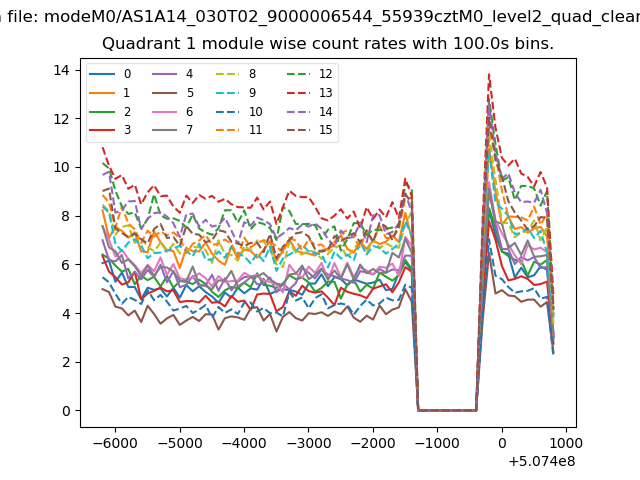
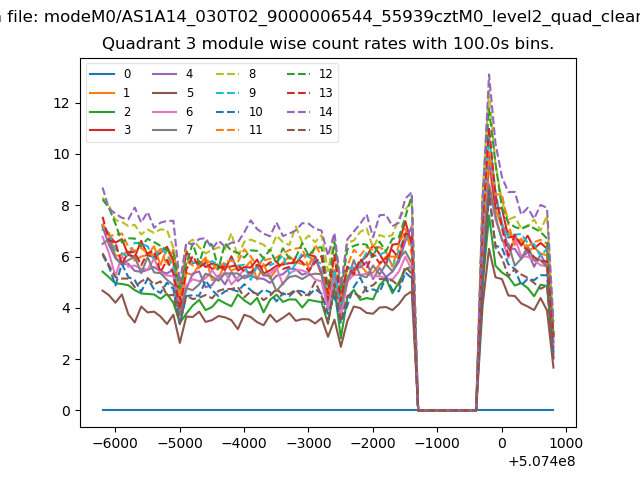
| Module-wise count rates for Quadrant A Data is divided into 100 sec bins |
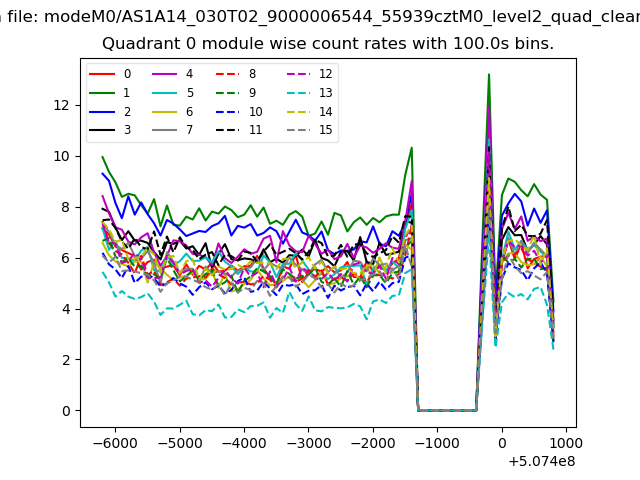 |
 |
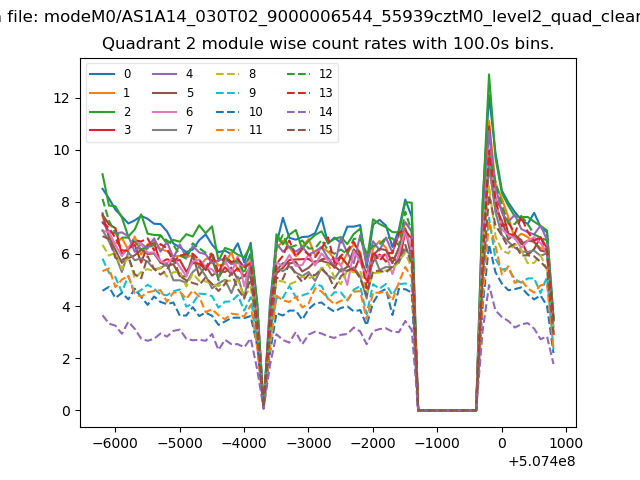
| Module-wise count rates for Quadrant B Data is divided into 100 sec bins |
 |
 |
| Module-wise count rates for Quadrant C Data is divided into 100 sec bins |
 |
 |
| Module-wise count rates for Quadrant D Data is divided into 100 sec bins |
 |
 |
| Parameter | Plot |
|---|---|
| CZT HV Monitor |  |
| D_VDD | 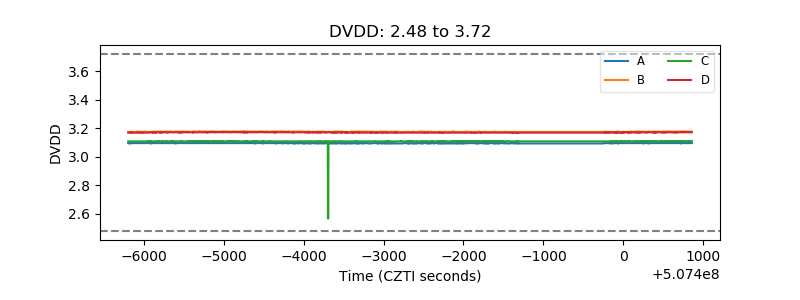 |
| Temperature 1 | 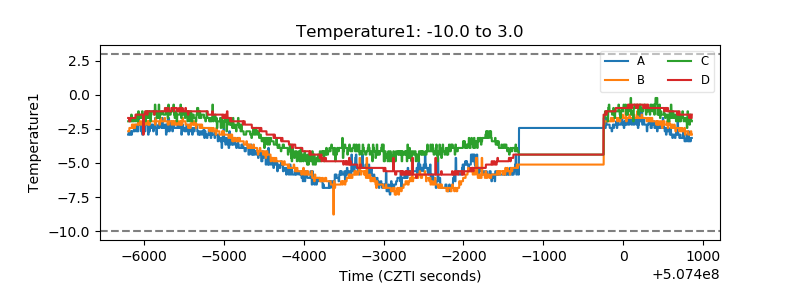 |
| Veto HV Monitor | 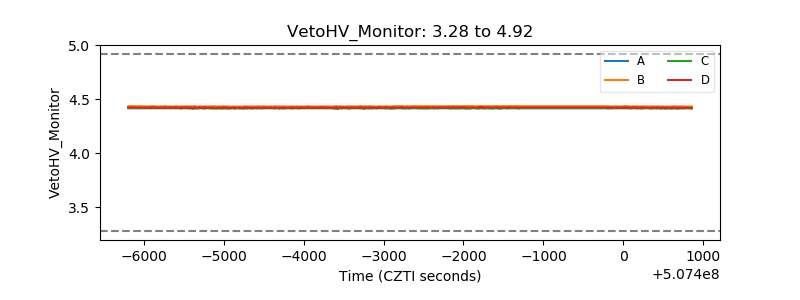 |
| Veto LLD | 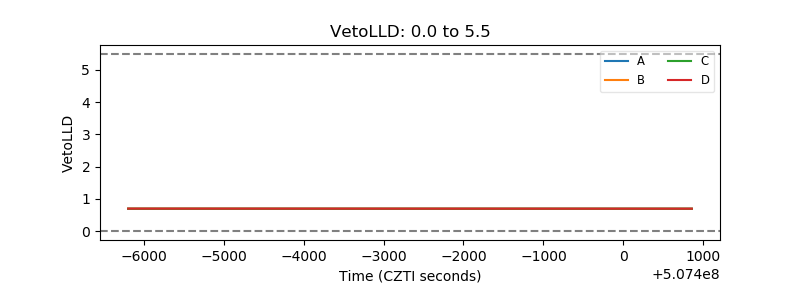 |
| Alpha Counter | 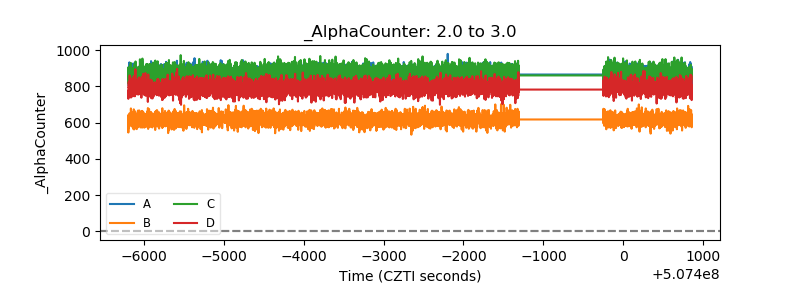 |
| _CPM_Rate | 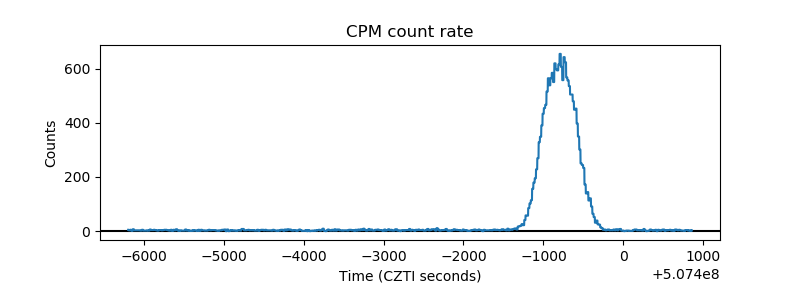 |
| CZT Counter | 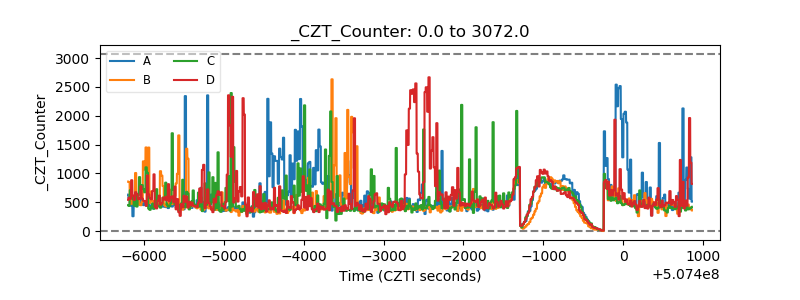 |
| +2.5 Volts monitor |  |
| +5 Volts monitor |  |
| _ROLL_ROT | 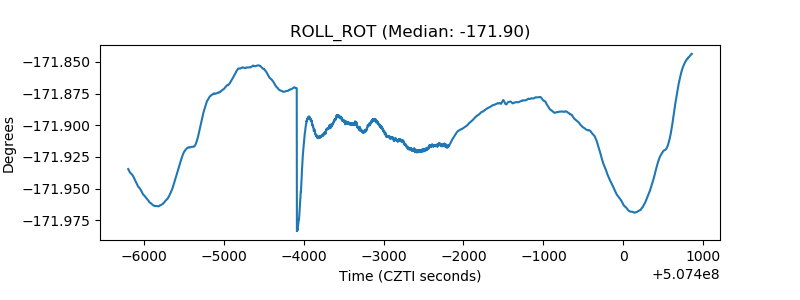 |
| _Roll_DEC | 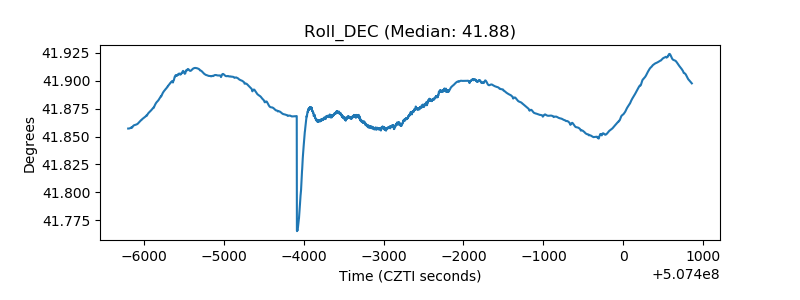 |
| _Roll_RA | 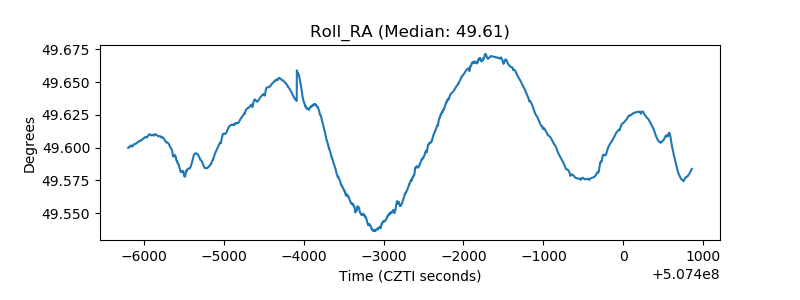 |
| Veto Counter | 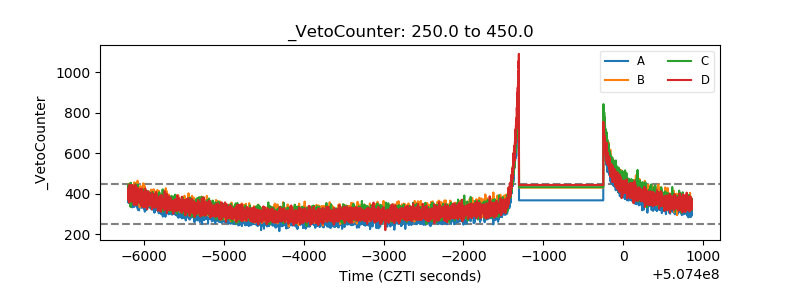 |