| Param | Original file | Final file |
|---|---|---|
| Filename | modeM0/AS1A14_066T02_9000006546_55940cztM0_level2.fits | modeM0/AS1A14_066T02_9000006546_55940cztM0_level2_quad_clean.evt |
| Size (bytes) | 435,677,760 | 94,164,480 |
| Size | 415.5 MB | 89.8 MB |
| Events in quadrant A | 4,434,373 | 604,893 |
| Events in quadrant B | 2,929,513 | 678,191 |
| Events in quadrant C | 4,317,154 | 569,311 |
| Events in quadrant D | 3,948,975 | 552,947 |
| Mode M9 | |||
|---|---|---|---|
| Quadrant | BADHDUFLAG | Total packets | Discarded packets |
| A | 0 | 20 | 0 |
| B | 0 | 21 | 0 |
| C | 0 | 21 | 0 |
| D | 0 | 21 | 0 |
| Mode M0 | |||
|---|---|---|---|
| Quadrant | BADHDUFLAG | Total packets | Discarded packets |
| A | 0 | 17678 | 2 |
| B | 0 | 13451 | 2 |
| C | 0 | 17716 | 2 |
| D | 0 | 16353 | 3 |
| Mode SS | |||
|---|---|---|---|
| Quadrant | BADHDUFLAG | Total packets | Discarded packets |
| A | 0 | 130 | 0 |
| B | 0 | 130 | 0 |
| C | 0 | 130 | 0 |
| D | 0 | 130 | 0 |
| Quadrant | Total seconds | Saturated seconds | Saturation percentage |
|---|---|---|---|
| A | 6392 | 443 | 6.930538% |
| B | 6392 | 58 | 0.907384% |
| C | 6392 | 461 | 7.212140% |
| D | 6391 | 221 | 3.457988% |
Noise dominated data is calculated using 1-second bins in cleaned event files. If a bin has >2000 counts, and if more than 50% of those come from <1% of pixels, then it is considered to be noise-dominated and hence unusable.
| Quadrant | # 1 sec bins | Bins with >0 counts | Bins with >2000 counts | High rate bins dominated by noise | Noise dominated (total time) | Noise dominated (detector-on time) | Marked lightcurve |
|---|---|---|---|---|---|---|---|
| A | 7532 | 6393 | 510 | 510 | 6.77% | 7.98% | 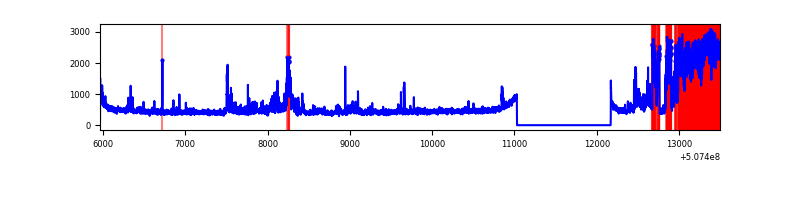 |
| B | 7532 | 6393 | 11 | 11 | 0.15% | 0.17% | 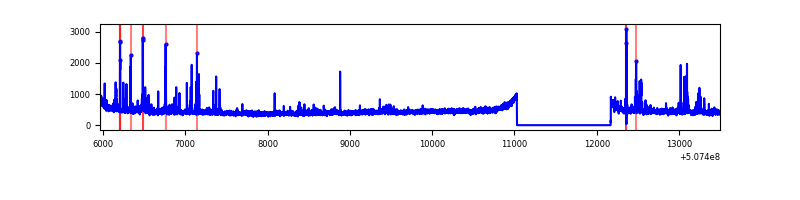 |
| C | 7532 | 6393 | 402 | 402 | 5.34% | 6.29% | 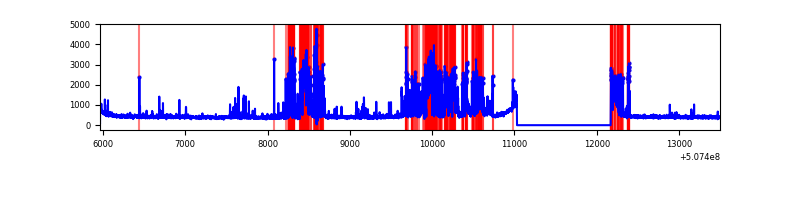 |
| D | 7531 | 6392 | 144 | 144 | 1.91% | 2.25% | 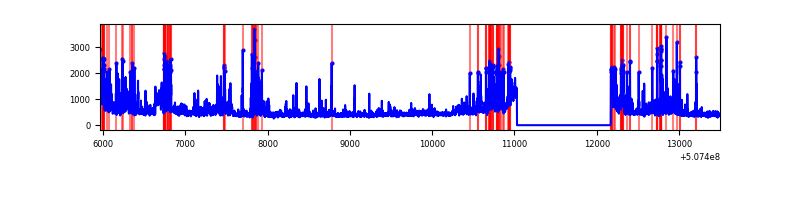 |
Top three noisy pixels from each quadrant. If the there are fewer than three noisy pixels in the level2.evt file, extra rows are filled as -1
| Pixel properties | Quadrant properties | ||||||
|---|---|---|---|---|---|---|---|
| Quadrant | DetID | PixID | Counts | Sigma | Mean | Median | Sigma |
| A | 12 | 115 | 1560102 | 9195.74 | 684 | 666 | 169.6 |
| A | 3 | 14 | 107434 | 629.59 | 684 | 666 | 169.6 |
| A | 0 | 8 | 37710 | 218.44 | 684 | 666 | 169.6 |
| B | 10 | 247 | 64041 | 427.47 | 687 | 663 | 148.3 |
| B | 7 | 252 | 40026 | 265.49 | 687 | 663 | 148.3 |
| B | 12 | 111 | 17413 | 112.97 | 687 | 663 | 148.3 |
| C | 14 | 80 | 1516819 | 8324.44 | 660 | 653 | 182.1 |
| C | 15 | 199 | 106093 | 578.91 | 660 | 653 | 182.1 |
| C | 13 | 3 | 83045 | 452.37 | 660 | 653 | 182.1 |
| D | 11 | 129 | 833881 | 4360.1 | 665 | 636 | 191.1 |
| D | 2 | 31 | 119212 | 620.47 | 665 | 636 | 191.1 |
| D | 15 | 125 | 113282 | 589.44 | 665 | 636 | 191.1 |
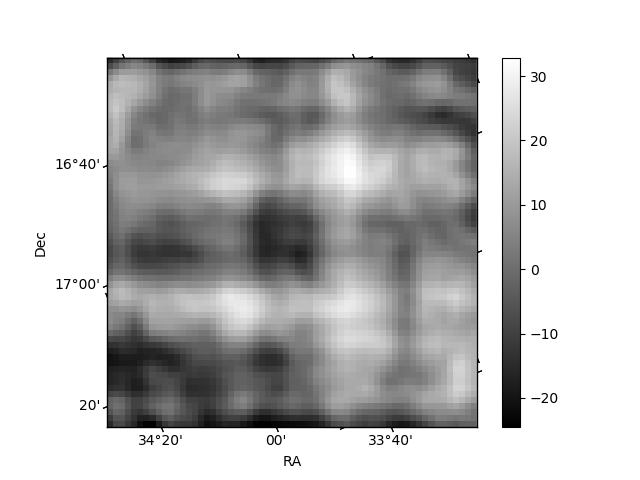
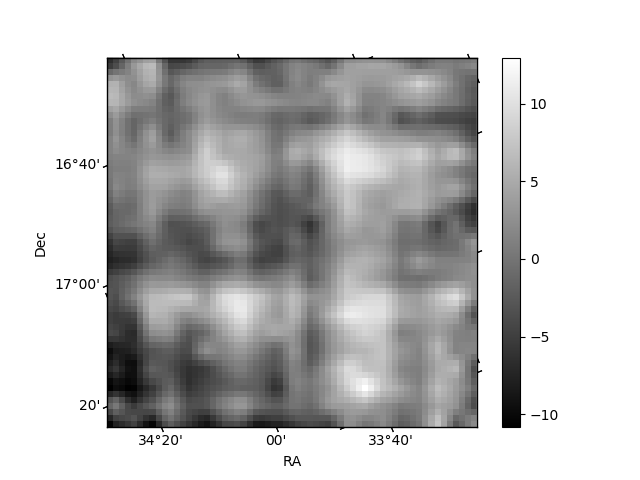
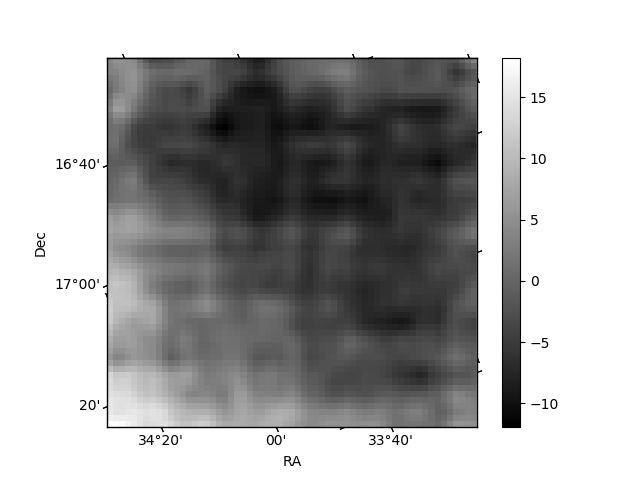
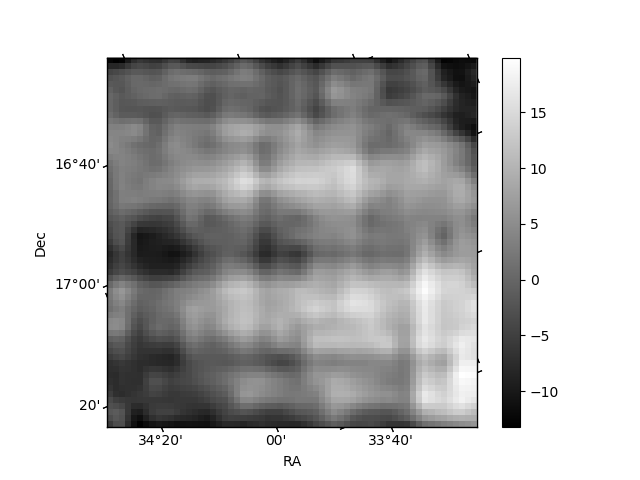
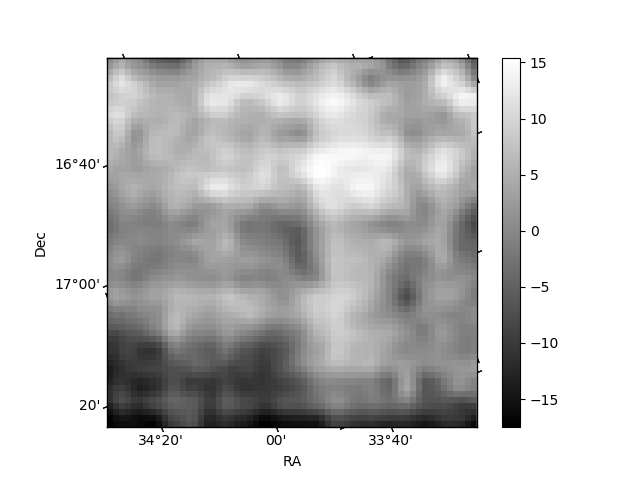
Histogram calculated using DETX and DETY for each event in the final _common_clean file
| Quadrant A | 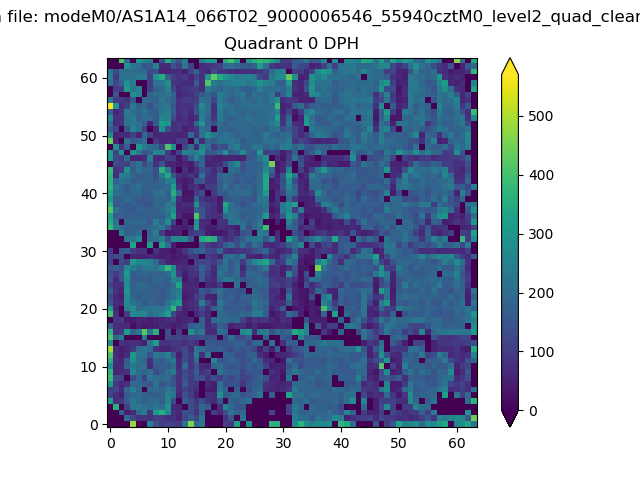 |
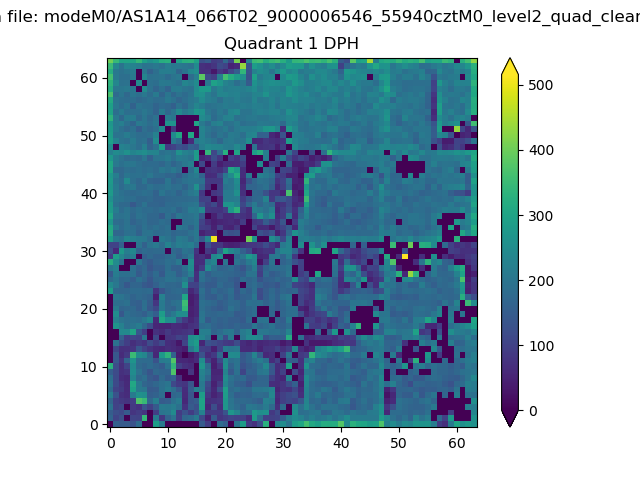 |
Quadrant B |
|---|---|---|---|
| Quadrant D | 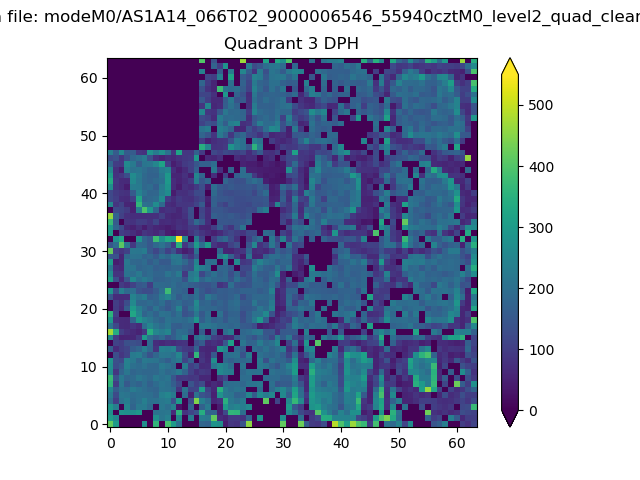 |
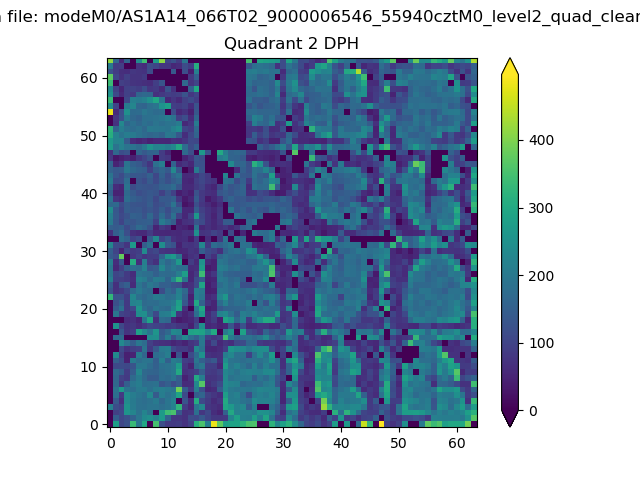 |
Quadrant C |
| Plot type | Count rate plots | Images |
|---|---|---|
| Comparison with Poisson distribution Blue bars denote a histogram of data divided into 1 sec bins. Red curve is a Poisson curve with rate = median count rate of data. |
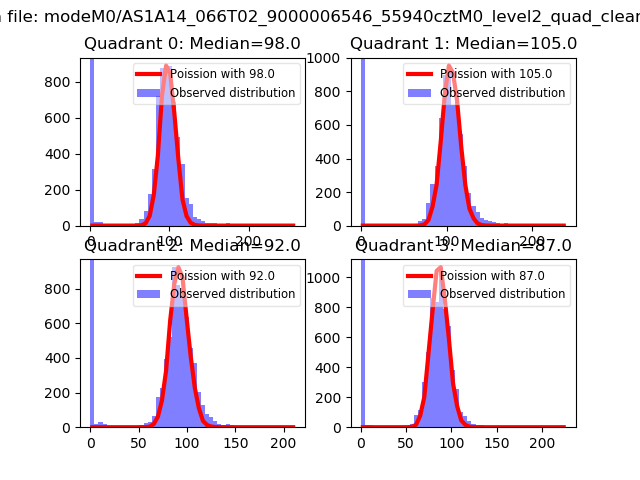 |
 |
| Quadrant-wise count rates Data is divided into 100 sec bins |
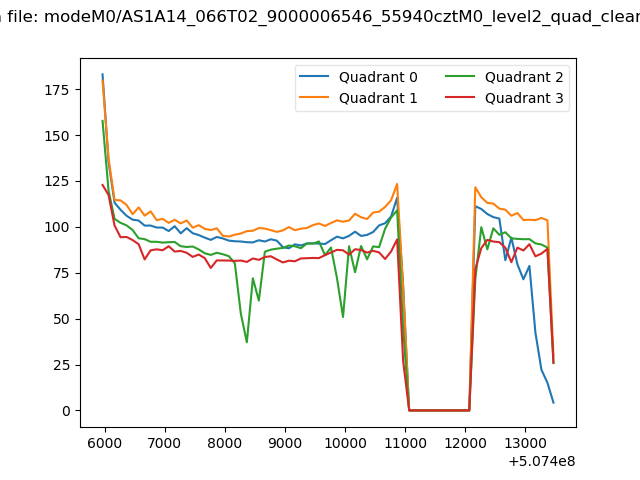 |
|
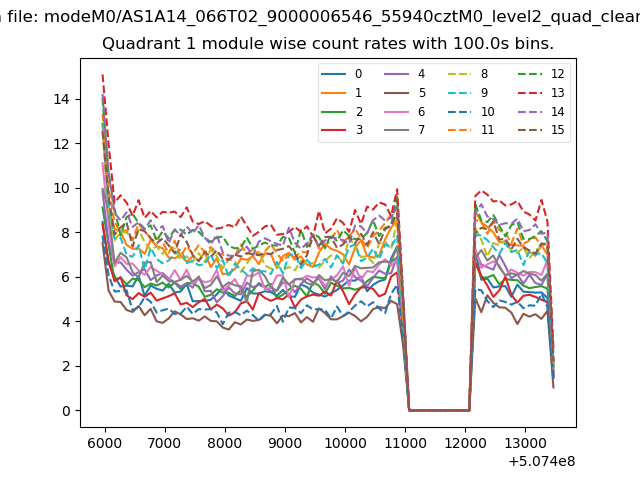
| Module-wise count rates for Quadrant A Data is divided into 100 sec bins |
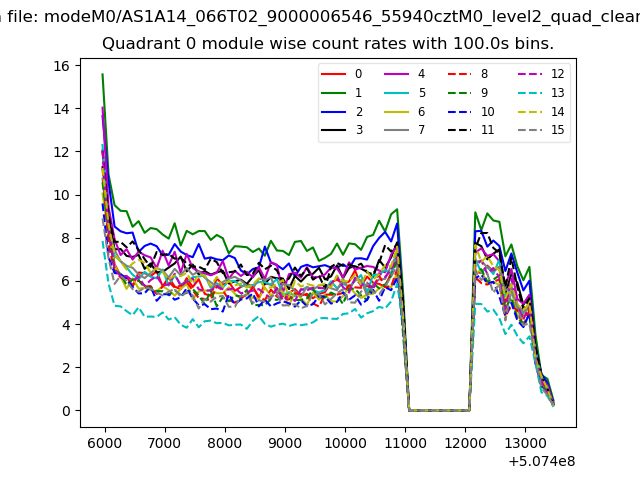 |
 |
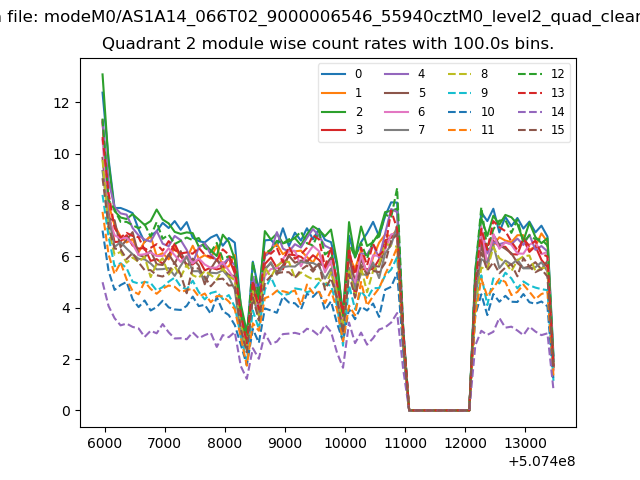
| Module-wise count rates for Quadrant B Data is divided into 100 sec bins |
 |
 |
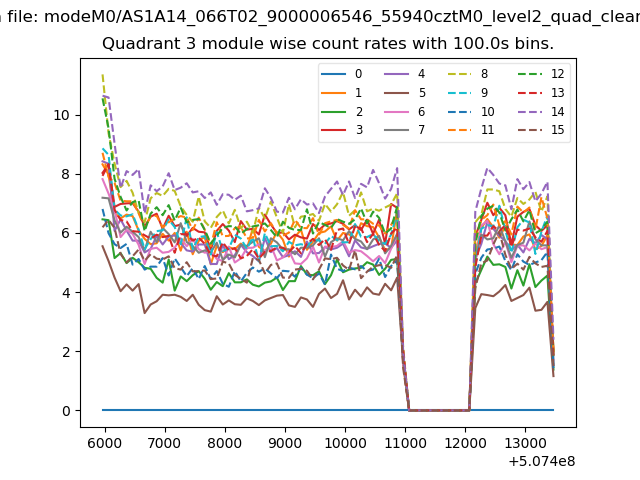
| Module-wise count rates for Quadrant C Data is divided into 100 sec bins |
 |
 |
| Module-wise count rates for Quadrant D Data is divided into 100 sec bins |
 |
 |
| Parameter | Plot |
|---|---|
| CZT HV Monitor | 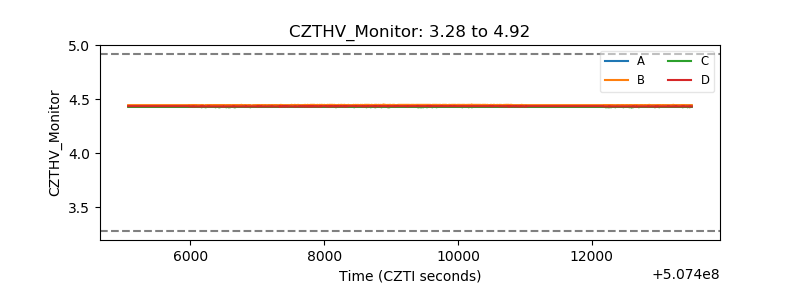 |
| D_VDD | 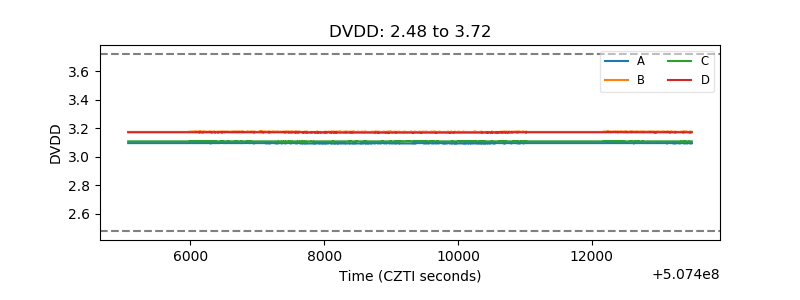 |
| Temperature 1 | 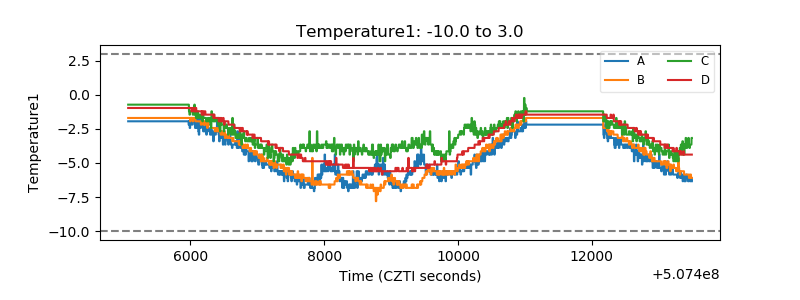 |
| Veto HV Monitor | 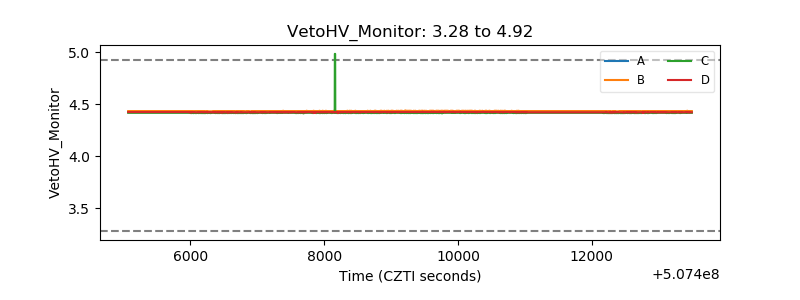 |
| Veto LLD | 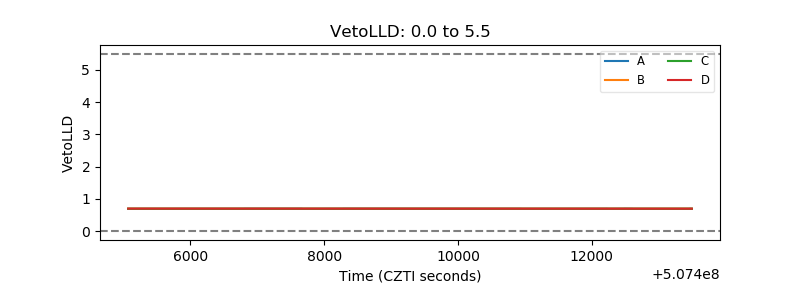 |
| Alpha Counter | 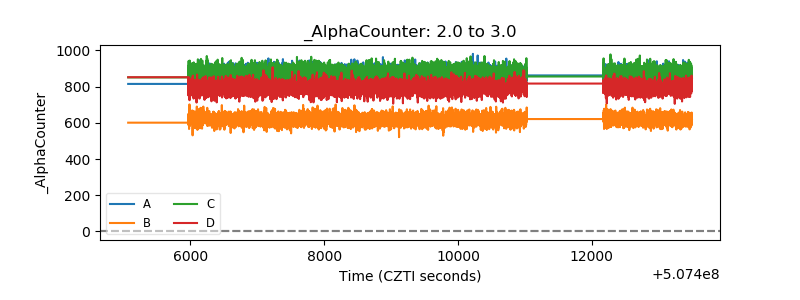 |
| _CPM_Rate | 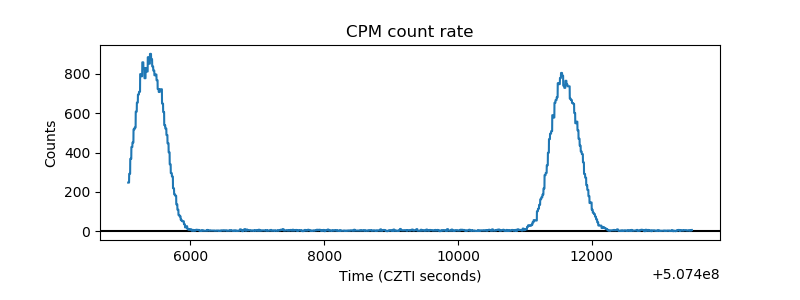 |
| CZT Counter | 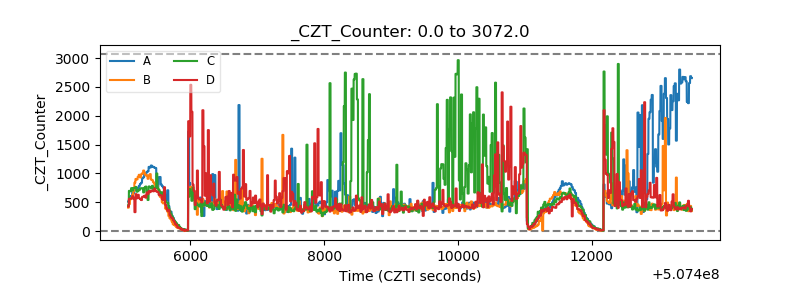 |
| +2.5 Volts monitor |  |
| +5 Volts monitor |  |
| _ROLL_ROT | 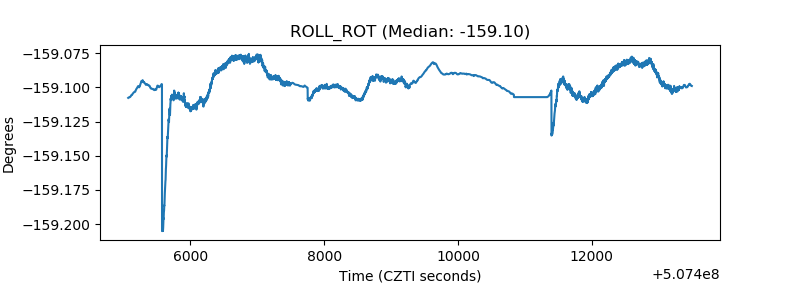 |
| _Roll_DEC | 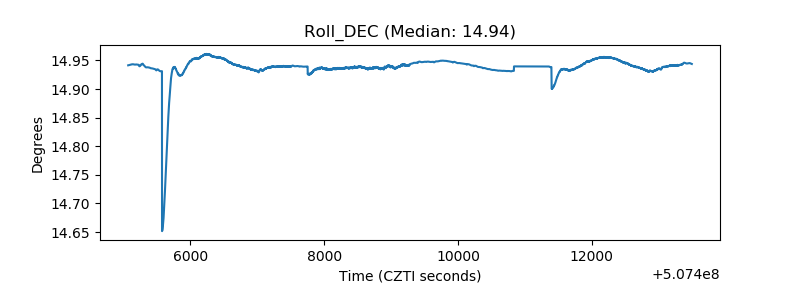 |
| _Roll_RA | 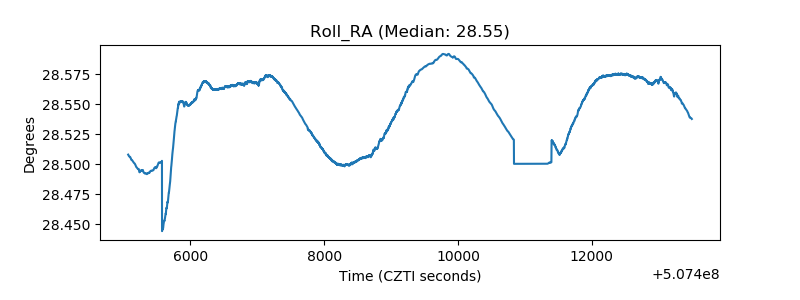 |
| Veto Counter | 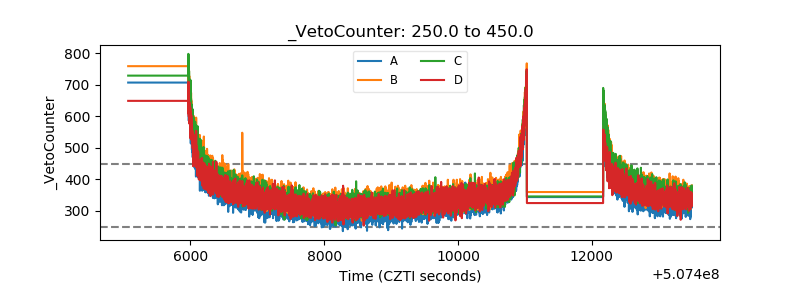 |