| Param | Original file | Final file |
|---|---|---|
| Filename | modeM0/AS1A14_066T02_9000006546_55942cztM0_level2.fits | modeM0/AS1A14_066T02_9000006546_55942cztM0_level2_quad_clean.evt |
| Size (bytes) | 399,718,080 | 97,588,800 |
| Size | 381.2 MB | 93.1 MB |
| Events in quadrant A | 3,084,787 | 643,114 |
| Events in quadrant B | 3,083,730 | 684,769 |
| Events in quadrant C | 4,422,407 | 574,533 |
| Events in quadrant D | 3,674,679 | 577,601 |
| Mode M9 | |||
|---|---|---|---|
| Quadrant | BADHDUFLAG | Total packets | Discarded packets |
| A | 0 | 17 | 0 |
| B | 0 | 18 | 0 |
| C | 0 | 18 | 0 |
| D | 0 | 18 | 0 |
| Mode M0 | |||
|---|---|---|---|
| Quadrant | BADHDUFLAG | Total packets | Discarded packets |
| A | 0 | 14285 | 2 |
| B | 0 | 14467 | 2 |
| C | 0 | 18234 | 2 |
| D | 0 | 15984 | 2 |
| Mode SS | |||
|---|---|---|---|
| Quadrant | BADHDUFLAG | Total packets | Discarded packets |
| A | 0 | 138 | 0 |
| B | 0 | 138 | 0 |
| C | 0 | 138 | 0 |
| D | 0 | 138 | 0 |
| Quadrant | Total seconds | Saturated seconds | Saturation percentage |
|---|---|---|---|
| A | 6815 | 26 | 0.381511% |
| B | 6815 | 77 | 1.129861% |
| C | 6815 | 498 | 7.307410% |
| D | 6815 | 62 | 0.909758% |
Noise dominated data is calculated using 1-second bins in cleaned event files. If a bin has >2000 counts, and if more than 50% of those come from <1% of pixels, then it is considered to be noise-dominated and hence unusable.
| Quadrant | # 1 sec bins | Bins with >0 counts | Bins with >2000 counts | High rate bins dominated by noise | Noise dominated (total time) | Noise dominated (detector-on time) | Marked lightcurve |
|---|---|---|---|---|---|---|---|
| A | 7800 | 6816 | 7 | 7 | 0.09% | 0.10% | 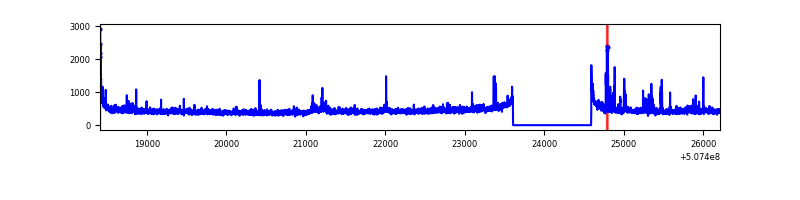 |
| B | 7800 | 6816 | 30 | 30 | 0.38% | 0.44% | 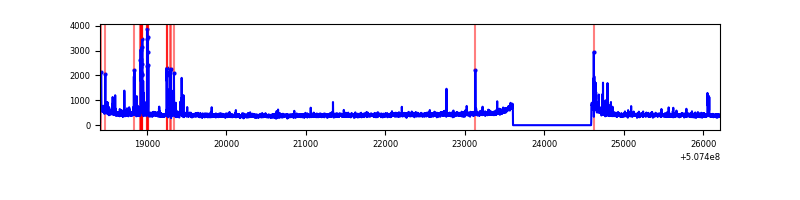 |
| C | 7800 | 6816 | 421 | 421 | 5.40% | 6.18% | 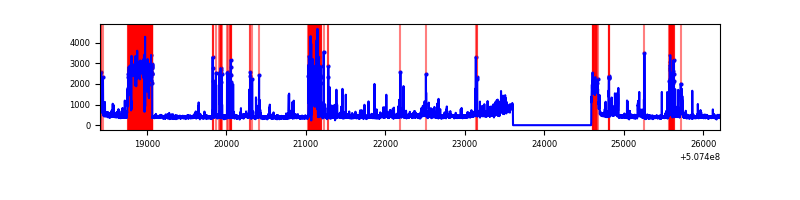 |
| D | 7800 | 6816 | 53 | 53 | 0.68% | 0.78% | 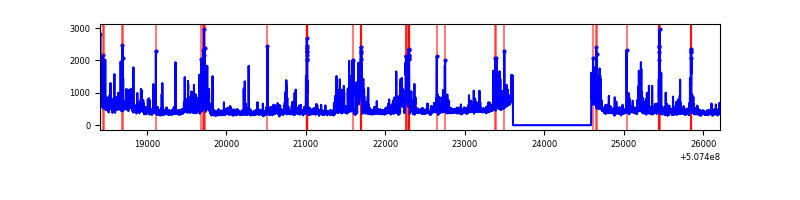 |
Top three noisy pixels from each quadrant. If the there are fewer than three noisy pixels in the level2.evt file, extra rows are filled as -1
| Pixel properties | Quadrant properties | ||||||
|---|---|---|---|---|---|---|---|
| Quadrant | DetID | PixID | Counts | Sigma | Mean | Median | Sigma |
| A | 3 | 14 | 165138 | 915.78 | 719 | 701 | 179.6 |
| A | 12 | 115 | 80439 | 444.07 | 719 | 701 | 179.6 |
| A | 4 | 3 | 19621 | 105.37 | 719 | 701 | 179.6 |
| B | 7 | 252 | 173811 | 1134.96 | 711 | 685 | 152.5 |
| B | 12 | 111 | 18558 | 117.17 | 711 | 685 | 152.5 |
| B | 11 | 111 | 17726 | 111.72 | 711 | 685 | 152.5 |
| C | 13 | 3 | 799999 | 4271.53 | 680 | 676 | 187.1 |
| C | 12 | 252 | 391689 | 2089.55 | 680 | 676 | 187.1 |
| C | 15 | 199 | 217337 | 1157.82 | 680 | 676 | 187.1 |
| D | 8 | 160 | 263053 | 1327.63 | 697 | 666 | 197.6 |
| D | 11 | 129 | 116601 | 586.61 | 697 | 666 | 197.6 |
| D | 1 | 31 | 81205 | 407.51 | 697 | 666 | 197.6 |
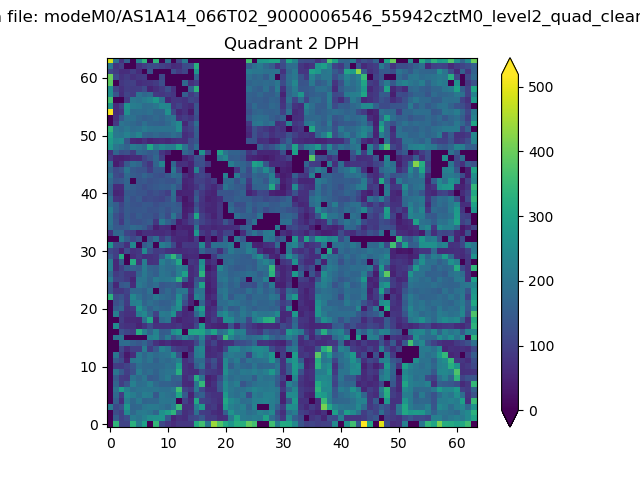
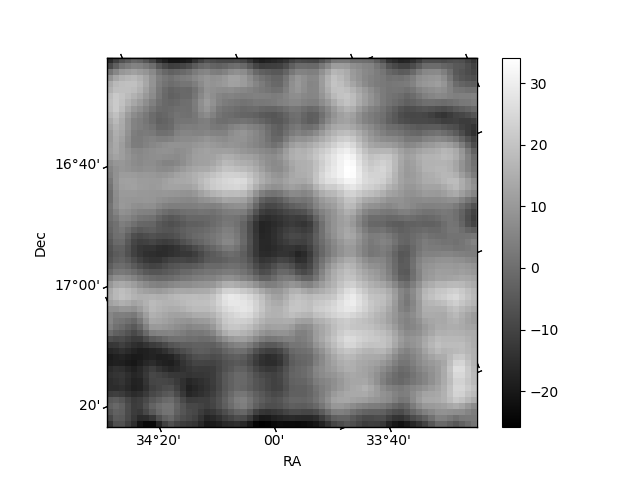
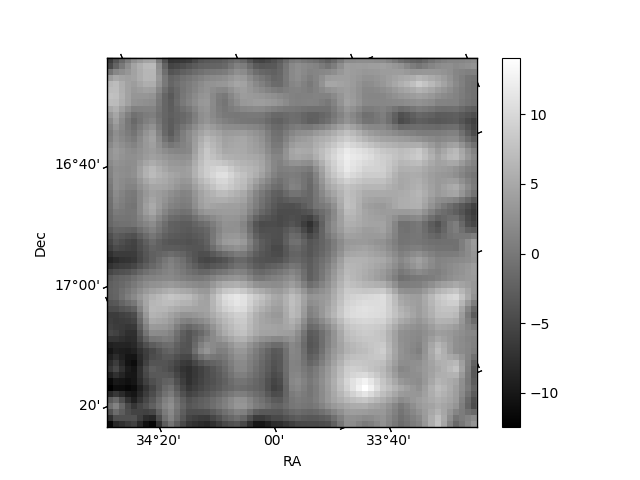
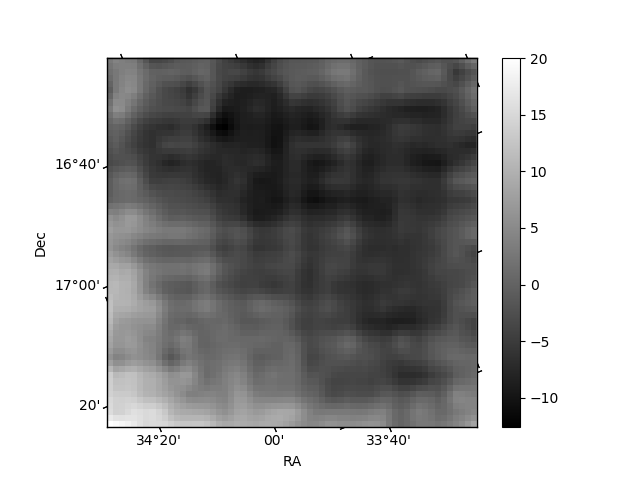
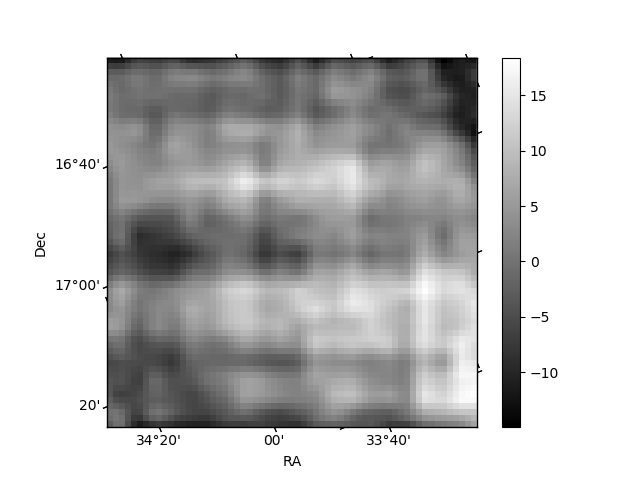
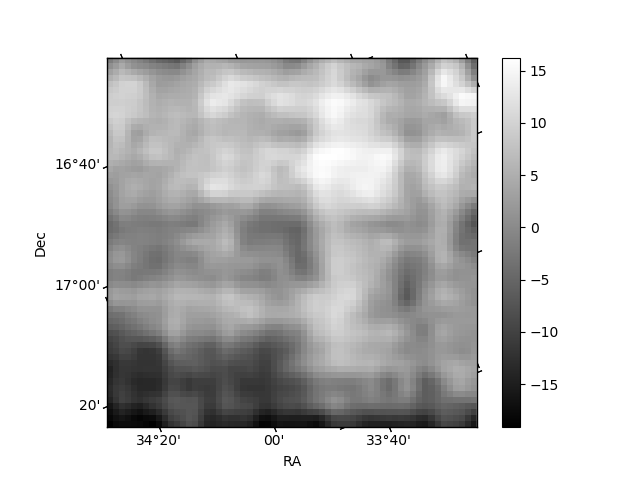
Histogram calculated using DETX and DETY for each event in the final _common_clean file
| Quadrant A | 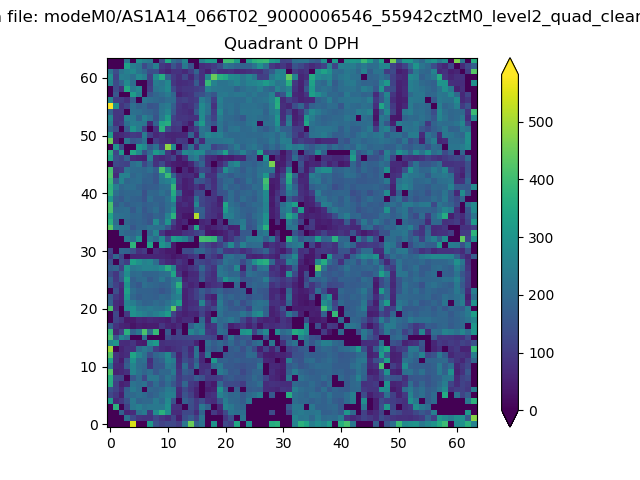 |
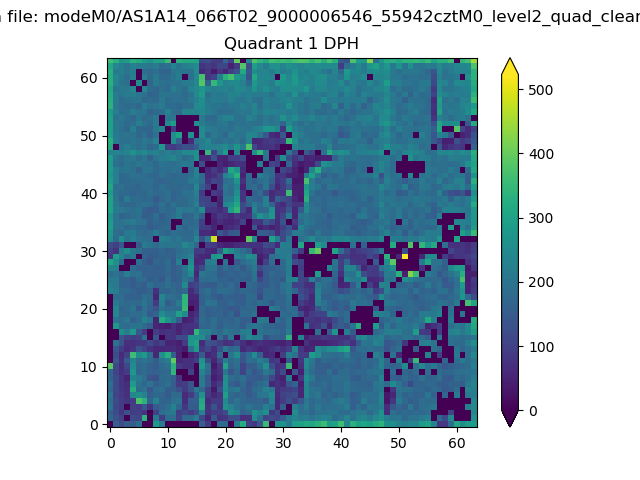 |
Quadrant B |
|---|---|---|---|
| Quadrant D | 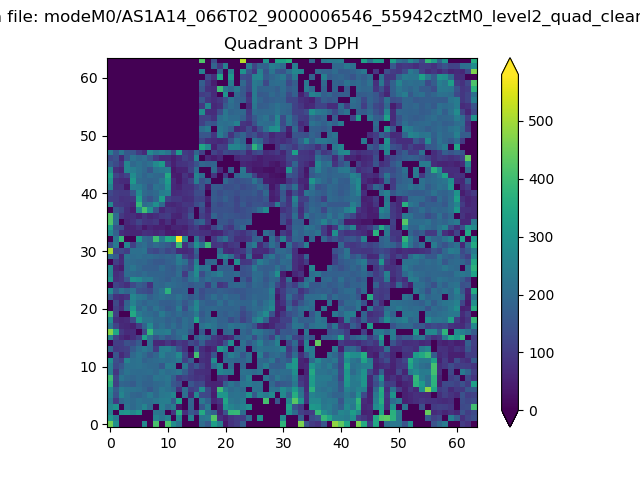 |
 |
Quadrant C |
| Plot type | Count rate plots | Images |
|---|---|---|
| Comparison with Poisson distribution Blue bars denote a histogram of data divided into 1 sec bins. Red curve is a Poisson curve with rate = median count rate of data. |
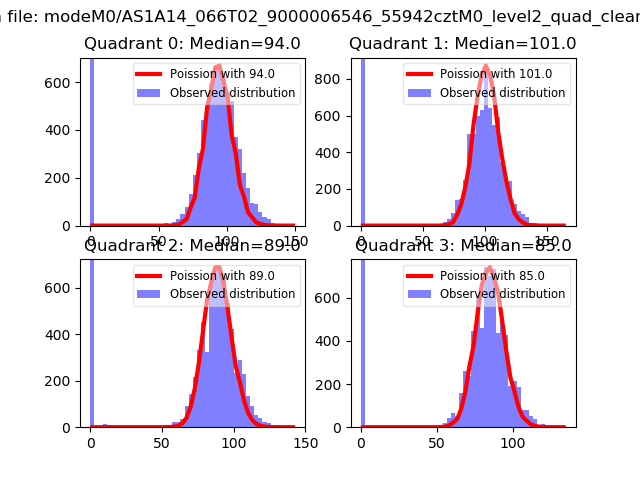 |
 |
| Quadrant-wise count rates Data is divided into 100 sec bins |
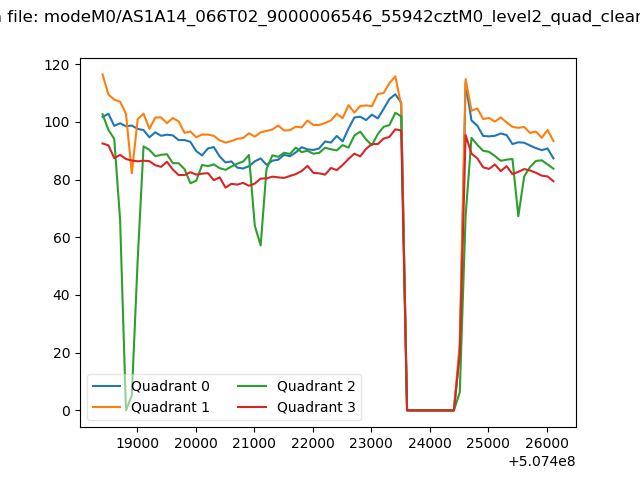 |
|
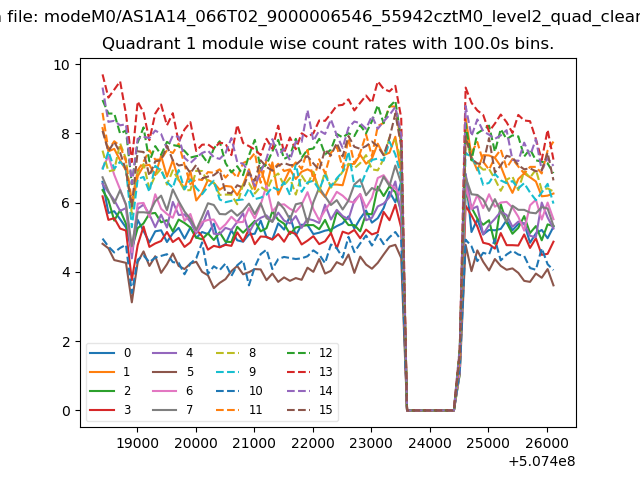
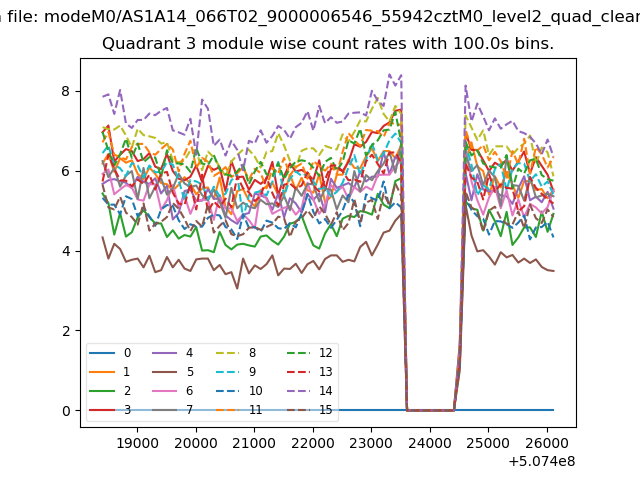
| Module-wise count rates for Quadrant A Data is divided into 100 sec bins |
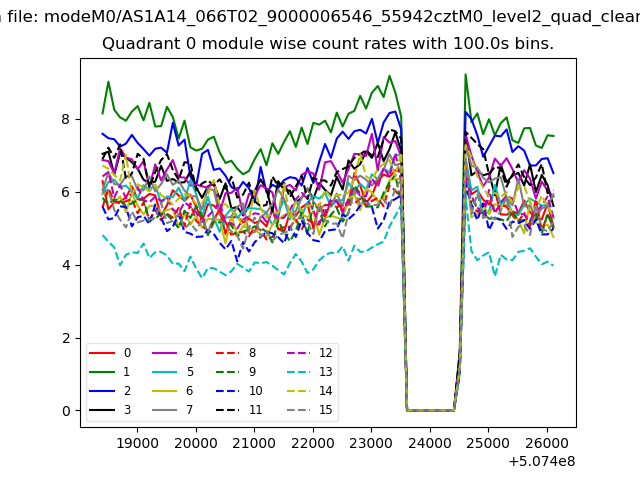 |
 |
| Module-wise count rates for Quadrant B Data is divided into 100 sec bins |
 |
 |
| Module-wise count rates for Quadrant C Data is divided into 100 sec bins |
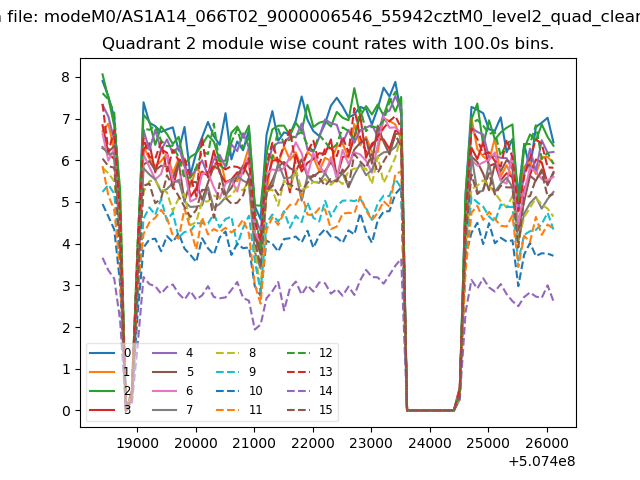 |
 |
| Module-wise count rates for Quadrant D Data is divided into 100 sec bins |
 |
 |
| Parameter | Plot |
|---|---|
| CZT HV Monitor |  |
| D_VDD | 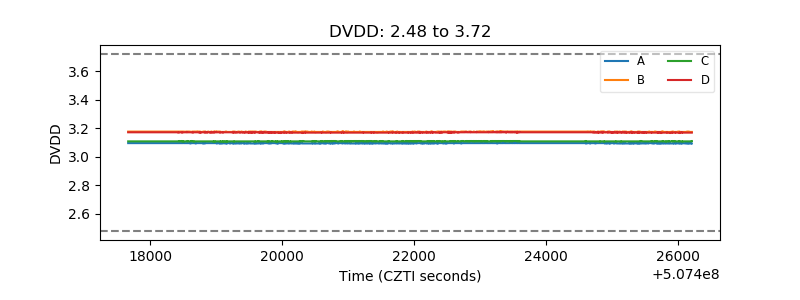 |
| Temperature 1 | 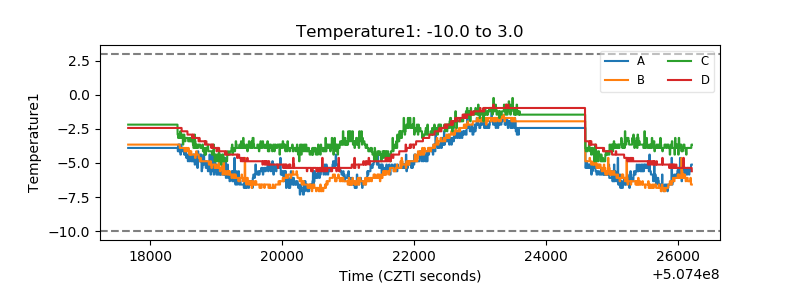 |
| Veto HV Monitor | 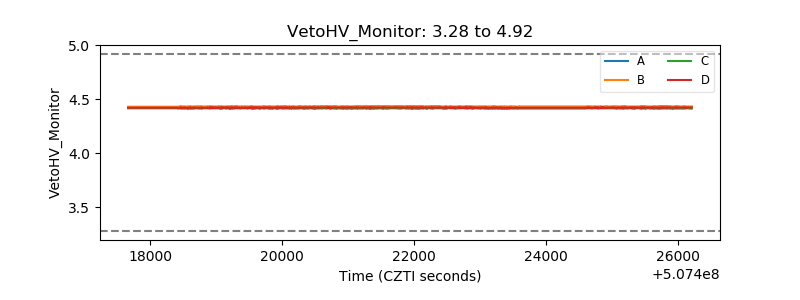 |
| Veto LLD | 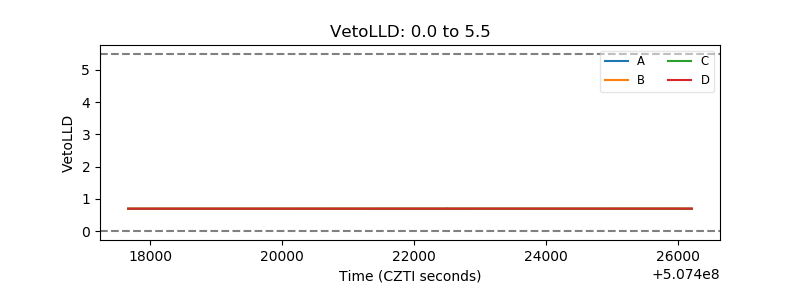 |
| Alpha Counter | 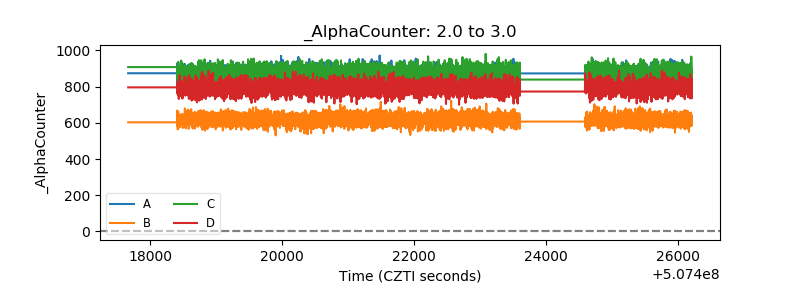 |
| _CPM_Rate | 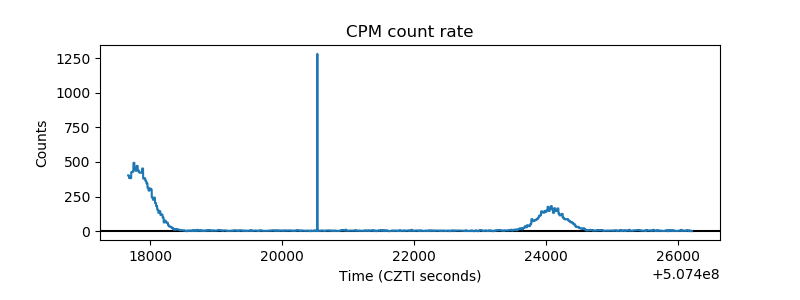 |
| CZT Counter | 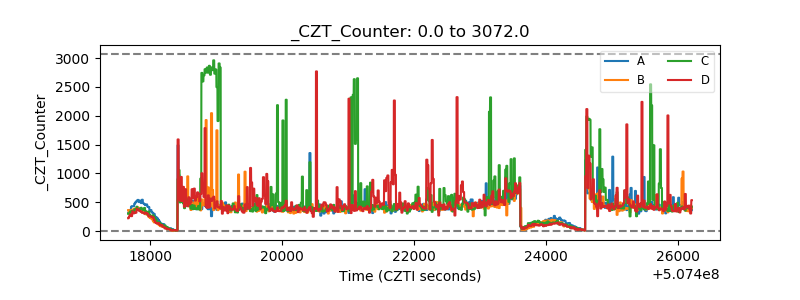 |
| +2.5 Volts monitor | 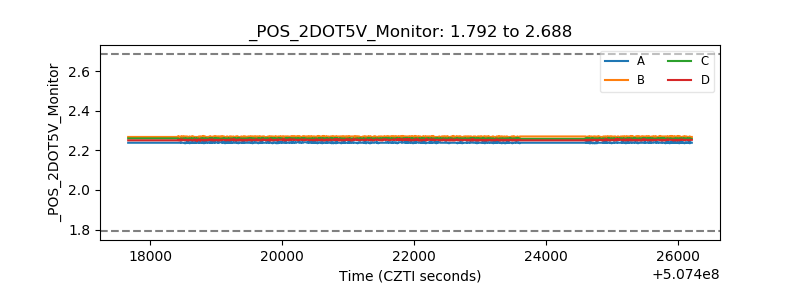 |
| +5 Volts monitor |  |
| _ROLL_ROT | 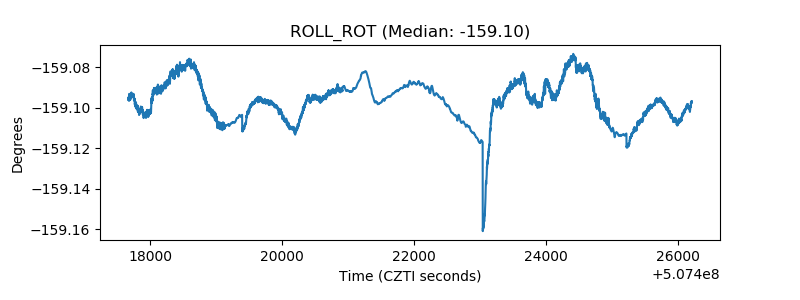 |
| _Roll_DEC | 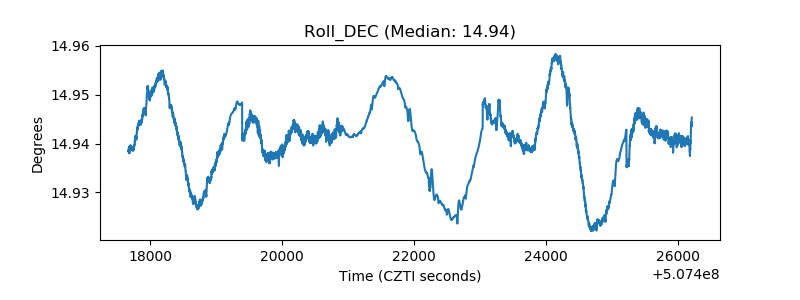 |
| _Roll_RA | 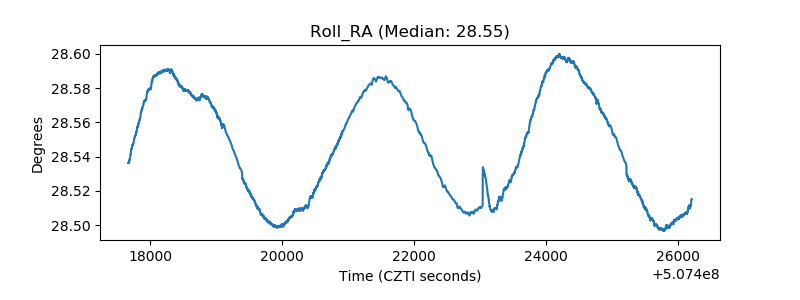 |
| Veto Counter | 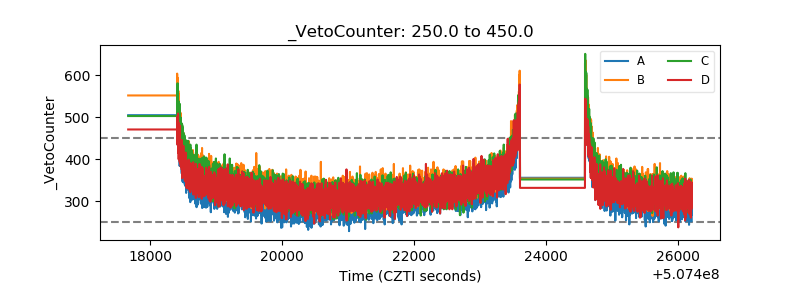 |